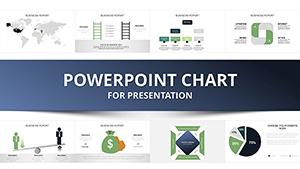
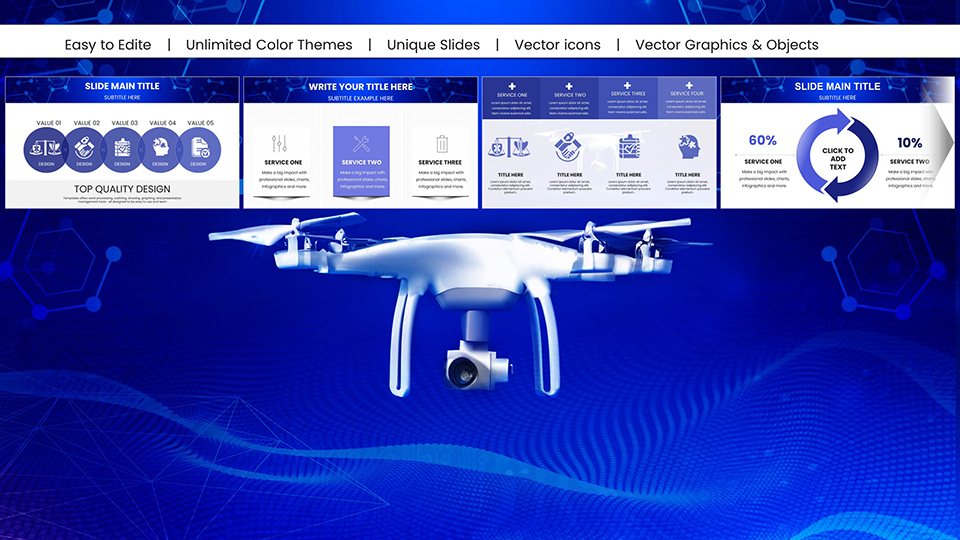
Flying Drone PowerPoint Charts Presentation: Capture Aerial Perspectives in Your Slides


Type: PowerPoint Charts template
Category: Illustrations
Sources Available: .pptx
Product ID: PC01019
Template incl.: 58 editable slides
Imagine presenting data that literally takes flight, turning mundane metrics into soaring narratives. Our Flying Drone PowerPoint Charts Presentation template is crafted for visionaries in aviation, surveying, and tech exploration, featuring 58 fully editable slides that mimic the freedom of drone flight. Tailored for professionals mapping urban landscapes or educators teaching remote sensing, this template transforms complex aerial data into accessible visuals. With seamless compatibility across Microsoft PowerPoint and Google Slides, you can customize every aspect - from vibrant sky-blue palettes to dynamic layouts - ensuring your presentations hover above the ordinary. Users love how it resolves common issues like cluttered drone footage analysis, offering clean charts that highlight patterns in environmental monitoring, where drones have revolutionized data collection as noted by the FAA's integration guidelines.
Exploring Key Features for Drone Enthusiasts
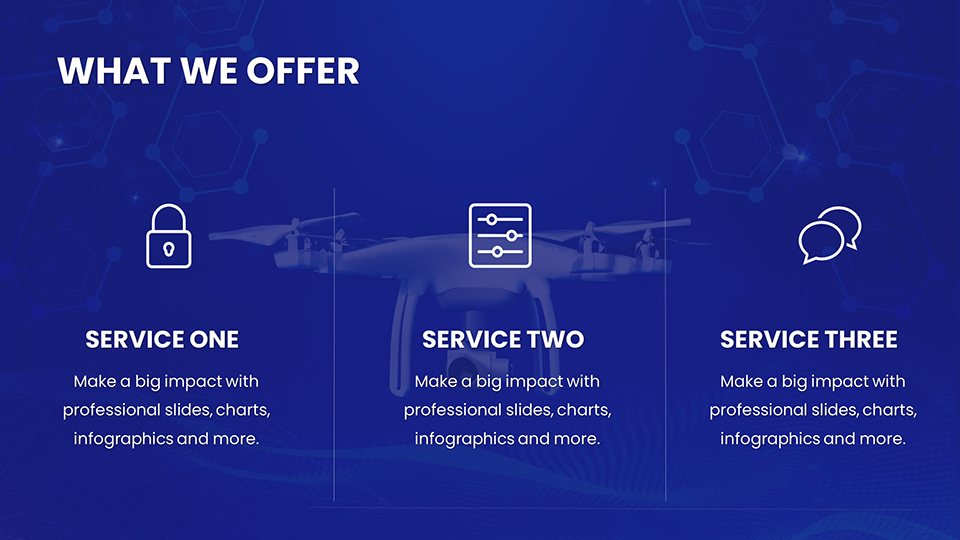
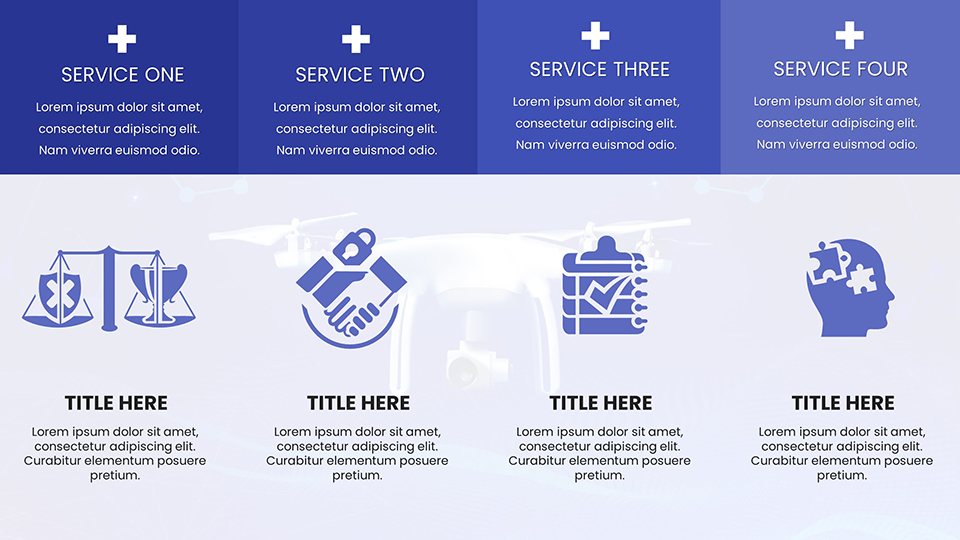
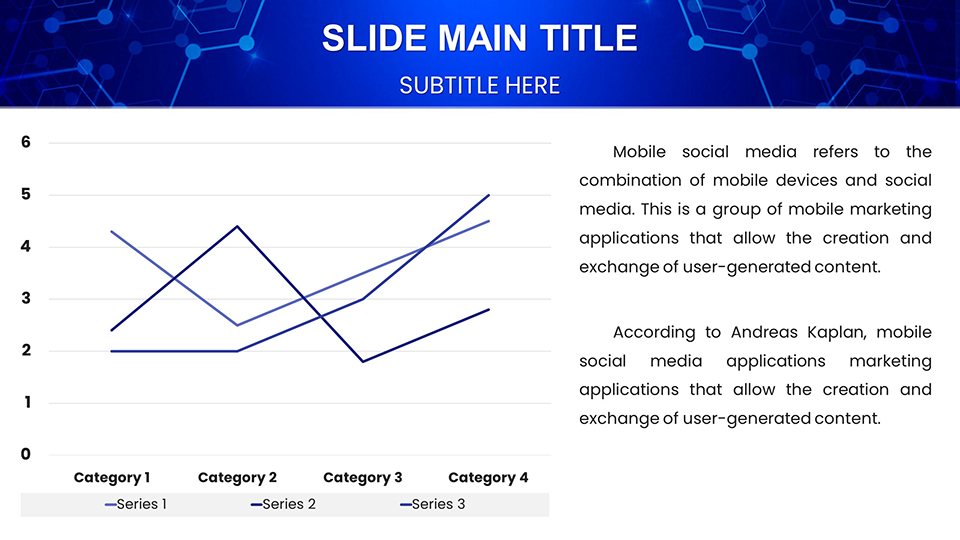
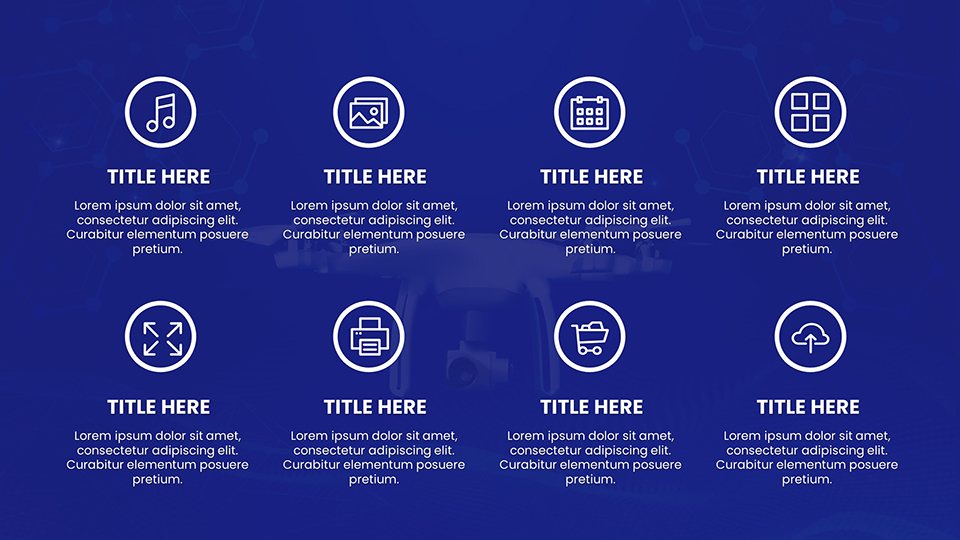
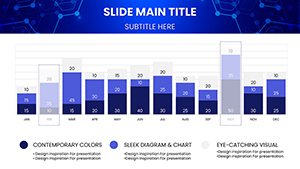
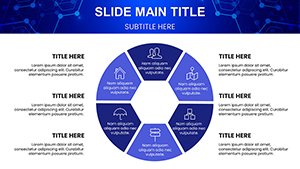
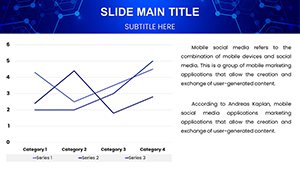
This template's strength lies in its aerial-themed elements, including high-altitude maps and trajectory graphs perfect for illustrating flight paths. Features like customizable infographics allow you to depict drone swarm coordination with cluster charts or battery efficiency with line graphs, all editable with a few clicks. Benefits include enhanced audience engagement; for example, a heatmap can show vegetation health from NDVI data captured by agricultural drones, improving yield predictions by 20% according to USDA reports. The user-friendly interface means no steep learning curve, letting you focus on insights rather than design hurdles.
In-Depth Slide Overview: Navigating from Ground to Sky
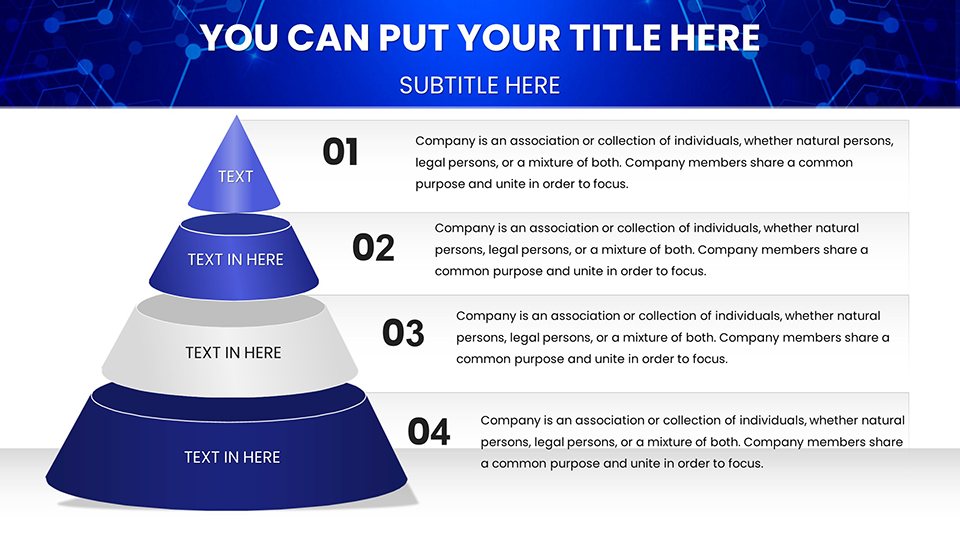
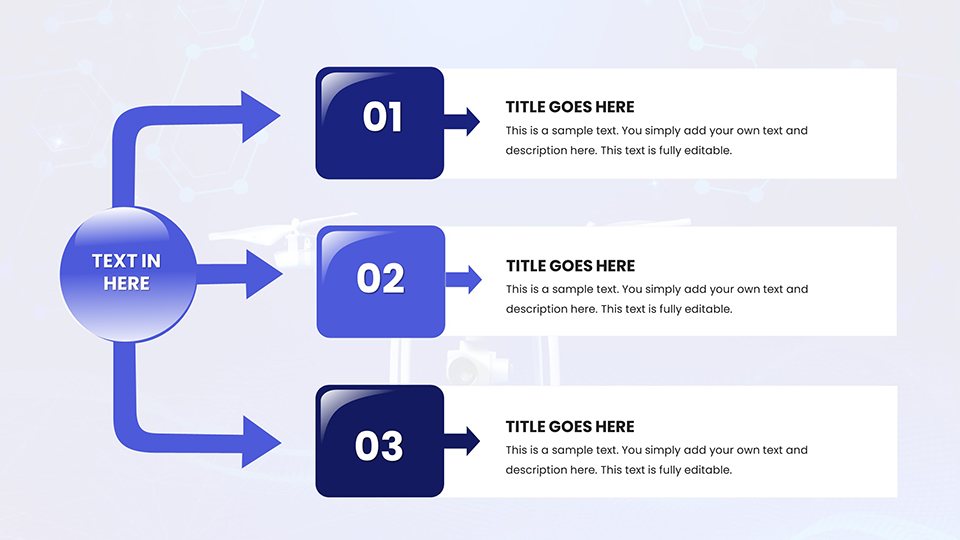
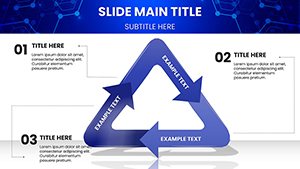
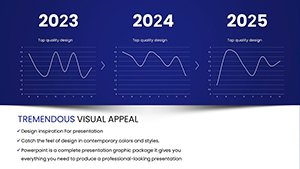
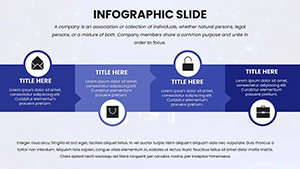
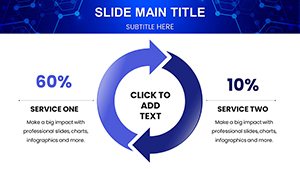
The 58 slides are structured to guide your story upward. Initial slides (1-15) set the scene with drone icons and timelines charting the history of unmanned aerial vehicles, from military origins to consumer models like DJI's Phantom series - ideal for inserting your own photos of field deployments. Core sections (16-40) delve into data visuals: pie charts for market segmentation in drone industries, bar graphs comparing sensor accuracies, and flowcharts for operational workflows in search-and-rescue missions. Each includes smart art for quick modifications, with alt texts suggesting "Aerial drone path visualization" for SEO-friendly images. Concluding slides (41-58) offer advanced tools like 3D models of flight simulations and radar charts assessing multi-drone collaborations, complete with animation transitions that simulate takeoff for dramatic effect.
Practical Use Cases: From Surveying to Education
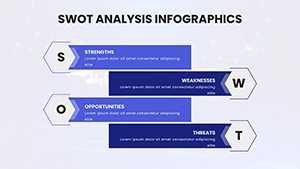
Apply this template in real-world contexts to solve specific challenges. A land surveyor might use it to present topographic data, with contour maps revealing elevation changes that inform construction projects, drawing from case studies like those by the American Society of Civil Engineers. Educators can adapt bubble charts to explain aerodynamics, referencing NASA's drone research for STEM classes. In business, marketing teams for drone manufacturers employ SWOT slides to strategize product launches, visualizing competitive edges in e-commerce deliveries where Amazon's Prime Air has set benchmarks. These applications not only display data but spark innovation, like in wildlife conservation where drones track endangered species, reducing poaching incidents as per WWF reports.
Pro Tips for Seamless Drone Data Presentations
Maximize impact by incorporating high-contrast colors for outdoor viewing, mimicking drone camera clarity. Link slides to external videos of drone flights via hyperlinks, a technique used in TED Talks on technology. Keep paragraphs short - aim for 5-7 lines per slide - to maintain pace, aligning with Edward Tufte's data-ink ratio principles. For collaboration, use Google Slides' real-time editing to gather team feedback on mission planning charts. Ensure compliance by adding disclaimers on FAA regulations in footer notes. Wrap up with an interactive Q&A slide featuring drone FAQs, encouraging audience participation.
Superiority Over Generic Presentation Tools
Unlike standard PowerPoint offerings, which lack thematic depth, this drone-focused template provides pre-designed elements like propeller icons and flight vector graphics, cutting setup time by half. It supports complex data sets better, with built-in formulas for calculations like flight duration estimates. Professionals note its edge in pitches, such as securing funding for drone startups, where vivid visuals have clinched deals in Shark Tank-style scenarios.
Ultimately, the Flying Drone PowerPoint Charts Presentation template propels your ideas to new heights, blending functionality with inspiration. Whether charting courses or educating minds, it's your co-pilot for success. Download and launch your next presentation adventure today.
Frequently Asked Questions
How do I edit the drone flight path charts?
Use the built-in tools to adjust points and colors directly in PowerPoint or Google Slides.
Is Google Slides compatibility full-featured?
Yes, all edits and animations transfer seamlessly between platforms.
Suitable for beginner drone users?
Definitely; intuitive design makes it accessible for all levels.
What about adding my drone photos?
Easily insert images into placeholders for personalized visuals.
Are there export options for PDF?
Yes, export directly for printing or sharing.
Can it handle large datasets?
Absolutely, with scalable charts for extensive aerial data.