Analytical Reports PowerPoint Presentation Template: Elevate Your Data Storytelling


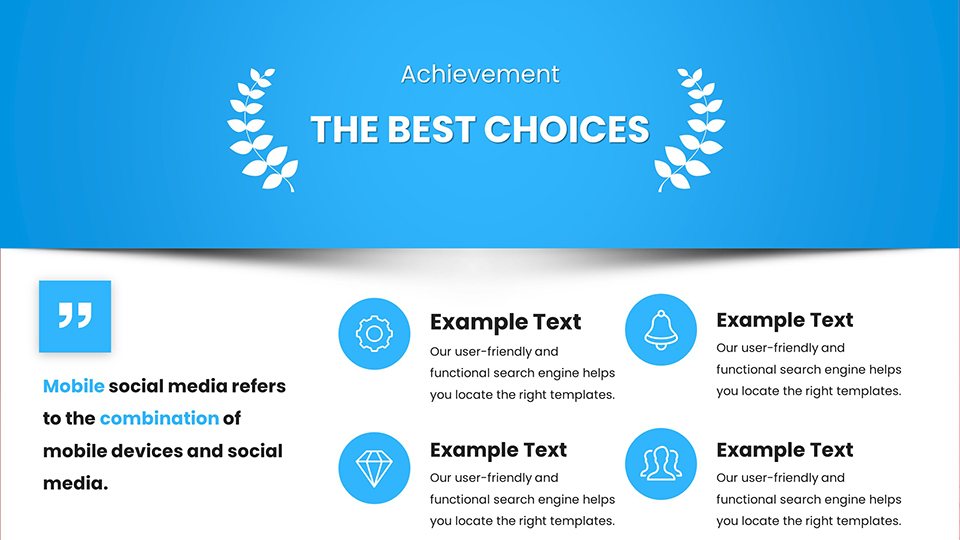


In the fast-paced world of business and research, where data reigns supreme, presenting analytical reports that captivate and convince is no small feat. Imagine transforming raw numbers into compelling stories that drive decisions and inspire action. Our Analytical Reports PowerPoint Presentation Template is designed precisely for that purpose. Tailored for data professionals, analysts, managers, and executives, this template offers 58 fully editable slides packed with sophisticated charts, graphs, and infographics. Whether you're dissecting market trends, evaluating performance metrics, or forecasting future outcomes, this tool empowers you to communicate complex insights with clarity and flair. Compatible with both PowerPoint and Google Slides, it ensures seamless collaboration across teams. Say goodbye to bland slides and hello to presentations that leave a lasting impression - download today and turn your data into a powerhouse narrative.
Why Choose This Analytical Reports Template for Your Next Presentation
As an SEO expert with years of experience optimizing content for design and presentation tools, I've seen how the right template can make or break a pitch. This analytical reports template stands out by blending functionality with aesthetic appeal, drawing from real-world applications in industries like finance, marketing, and healthcare. For instance, consider a financial analyst preparing a quarterly review: instead of static tables, use dynamic bar charts that highlight revenue growth, making your report not just informative but engaging. The template's design adheres to best practices in data visualization, inspired by experts like Edward Tufte, ensuring minimalism without sacrificing depth. With customizable color schemes that align with your brand - think cool blues for trust in analytics or vibrant greens for growth metrics - you can personalize every element to resonate with your audience.
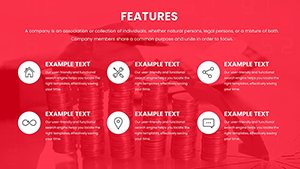
Key Features That Set This Template Apart
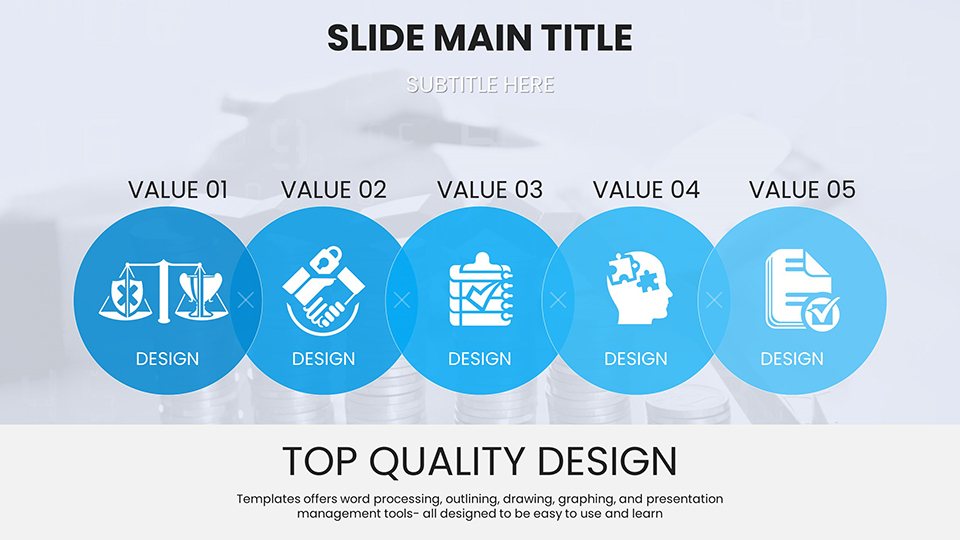
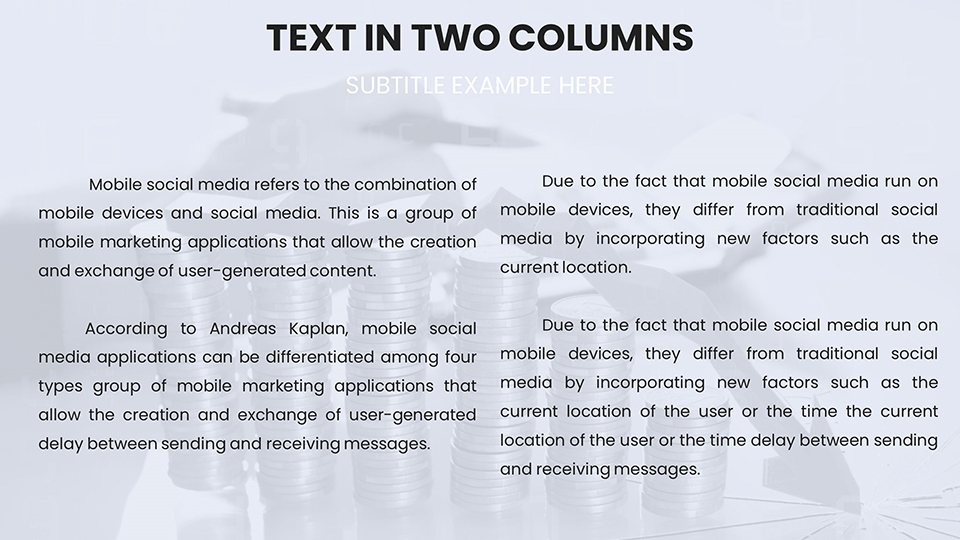
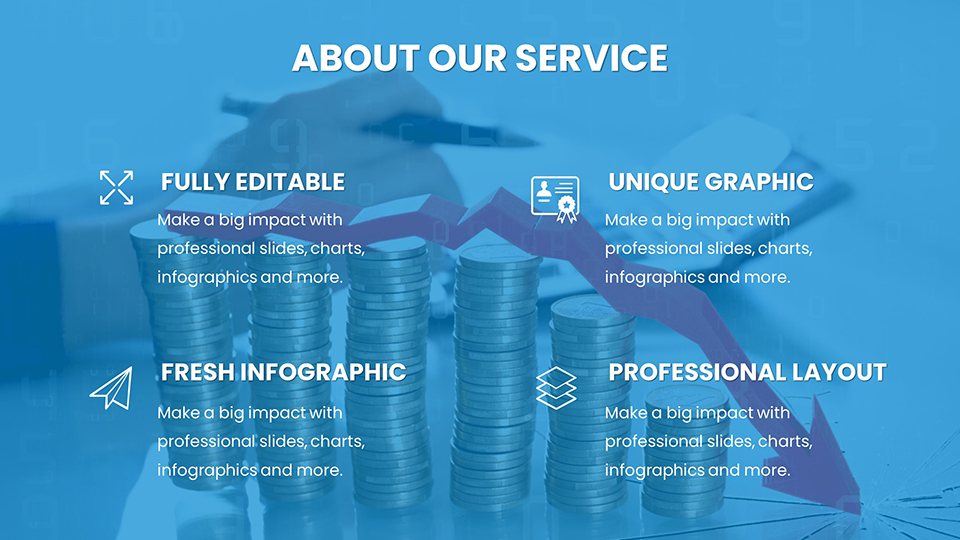
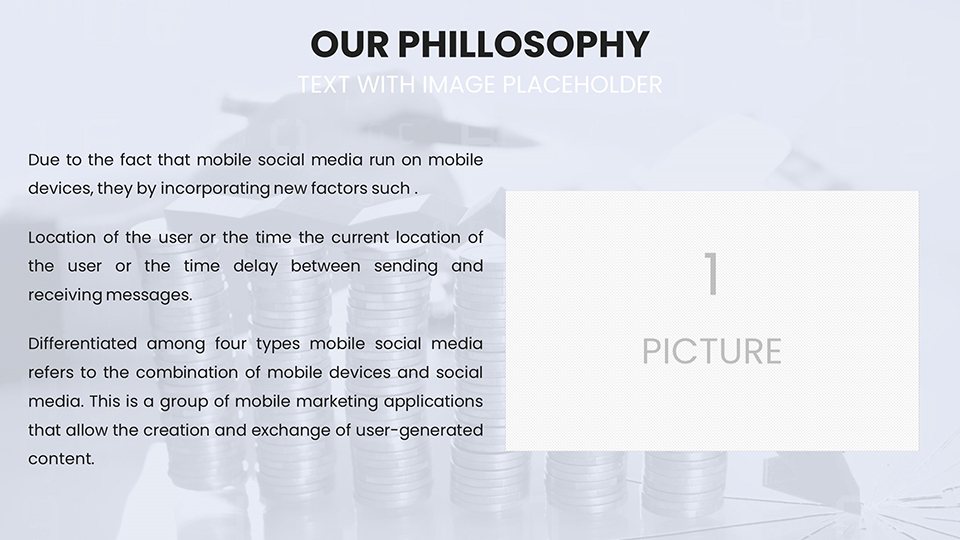
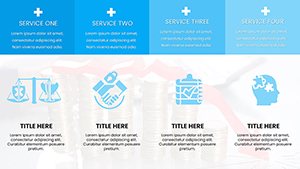
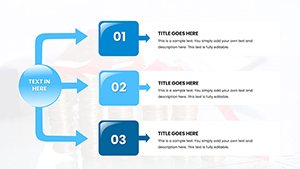
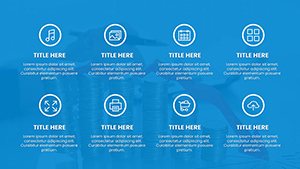
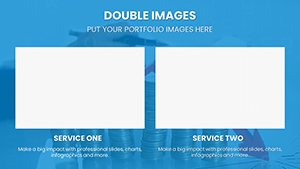
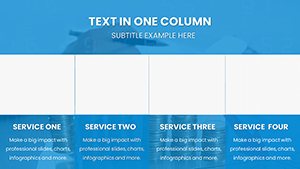
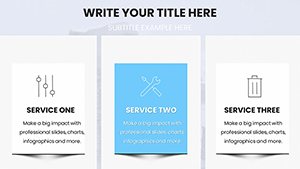
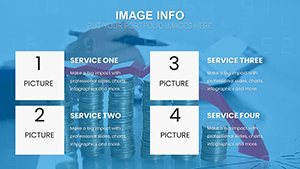
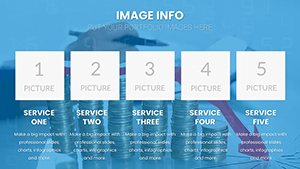
Diving deeper, the 58 slides are meticulously organized into categories for ease of use. You'll find dedicated sections for executive summaries, data overviews, trend analyses, and conclusion slides. Each chart is fully editable, allowing you to input your datasets directly - no need for external software. Features include:
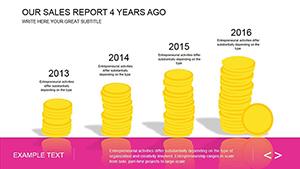
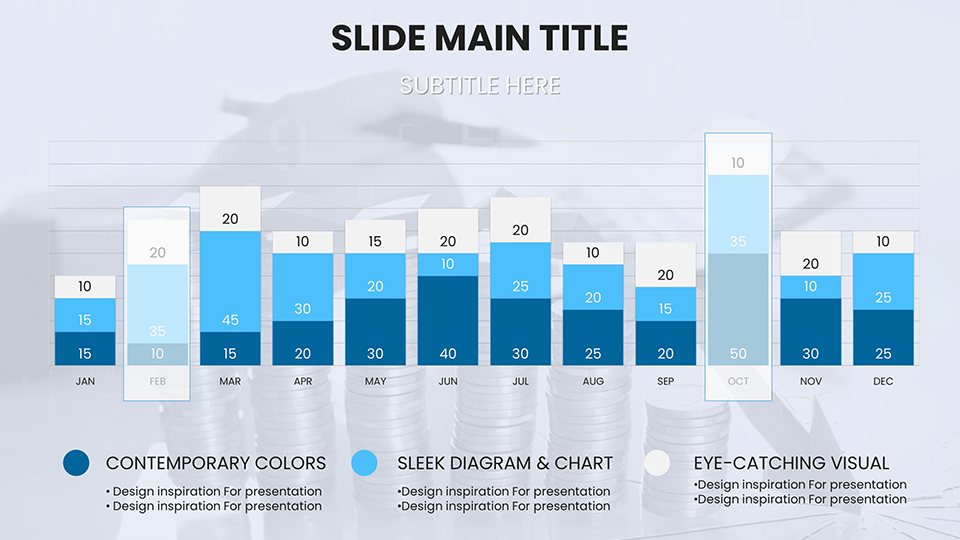
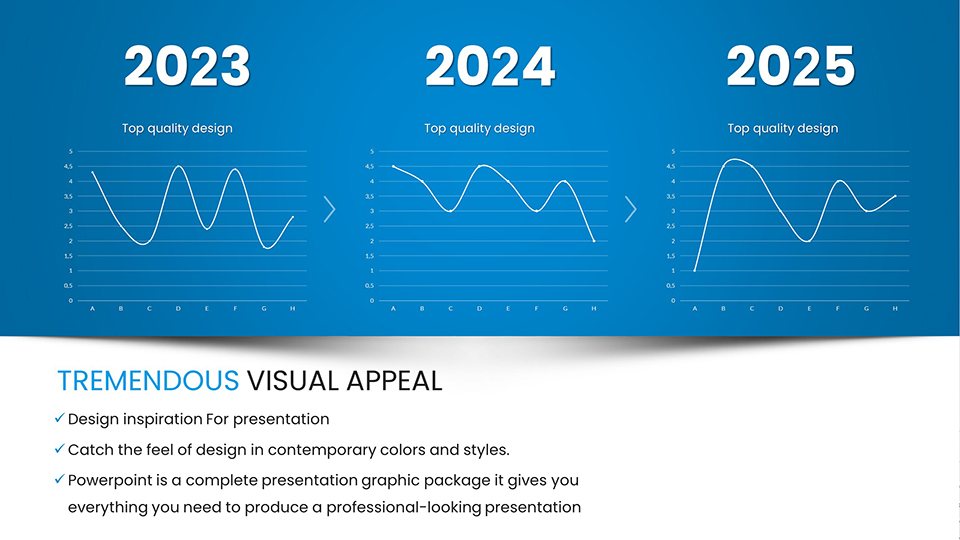
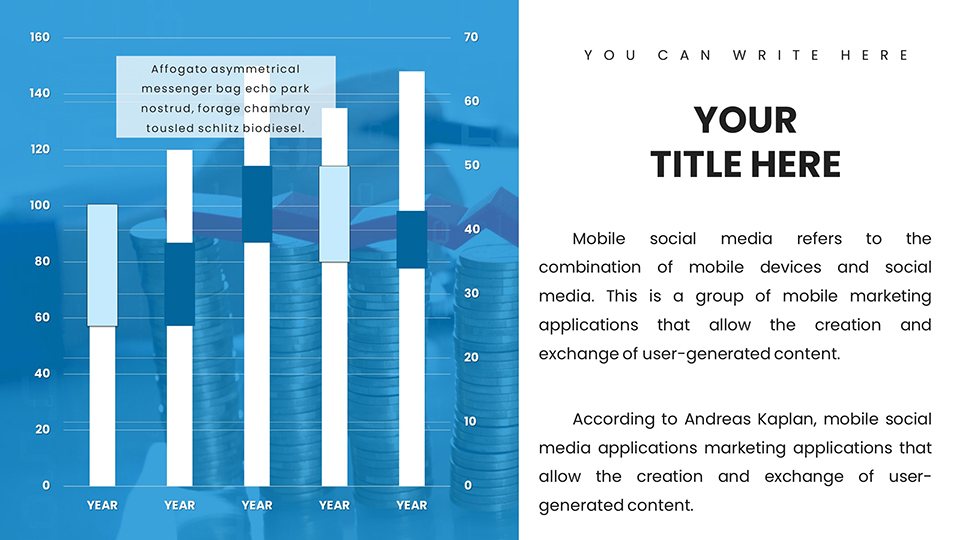
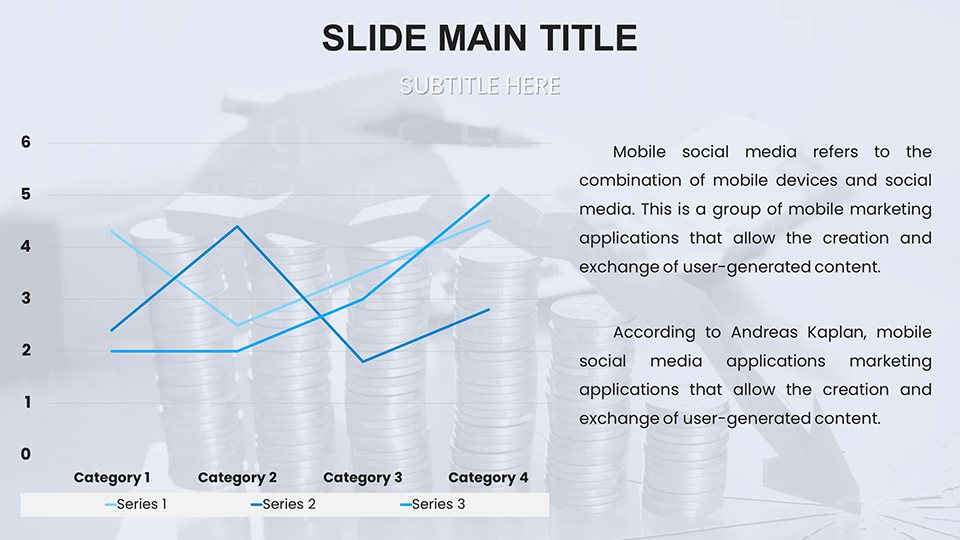
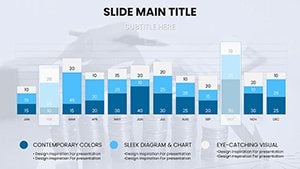
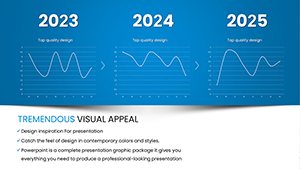
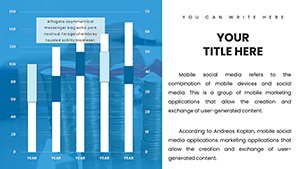
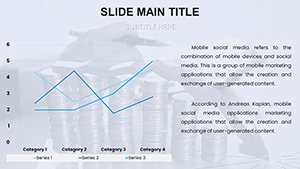
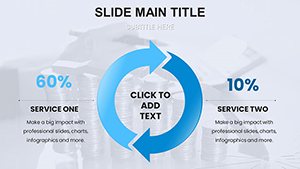
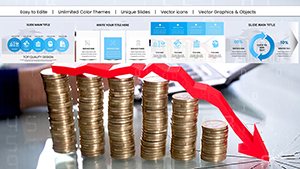
- Interactive line graphs for tracking temporal data, such as sales over time, with hover effects in presentation mode.
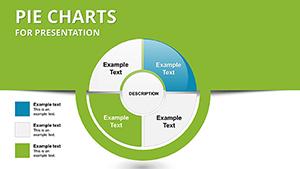
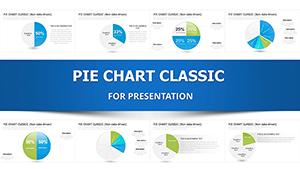
- Pie charts and doughnuts for proportional breakdowns, ideal for market share reports, with easy label adjustments.
- Heat maps to visualize correlations, perfect for risk assessments in analytical reports.
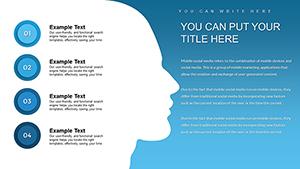
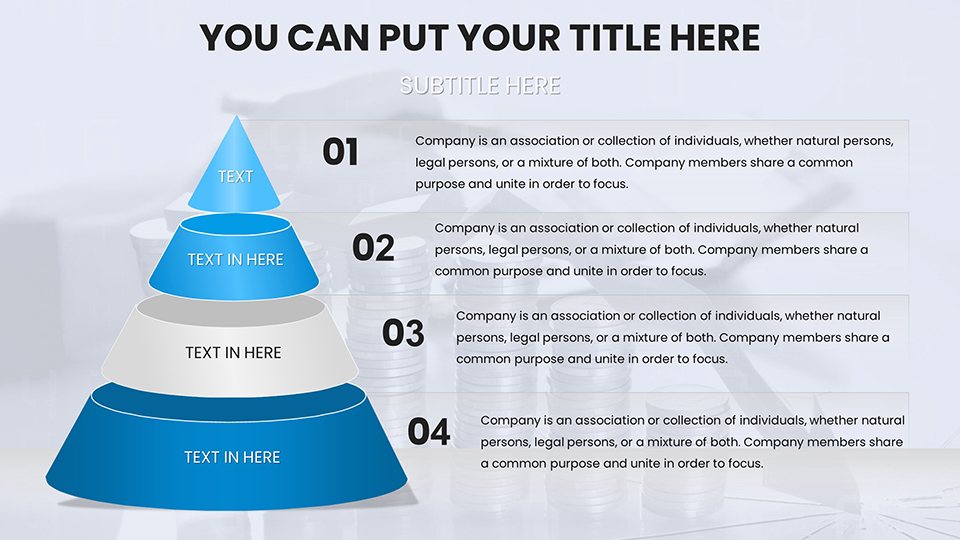
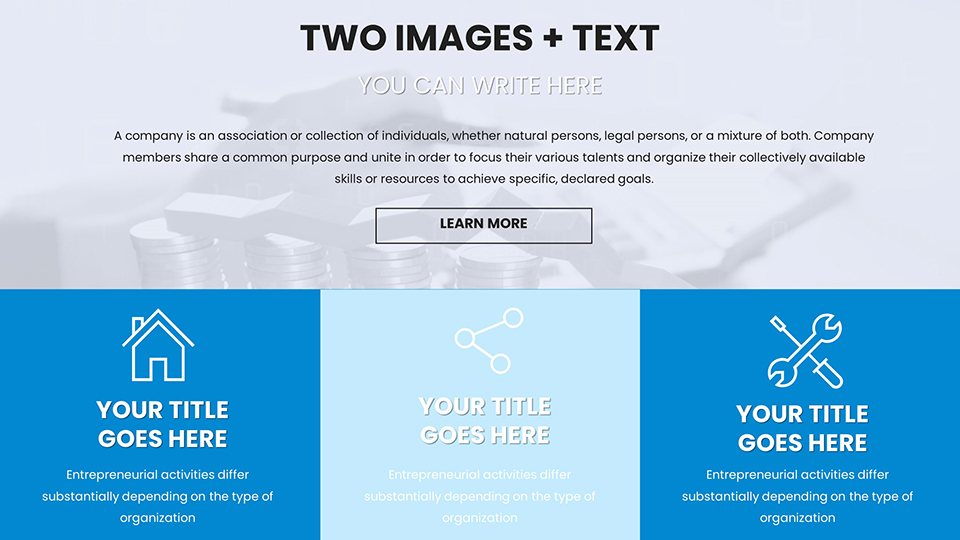
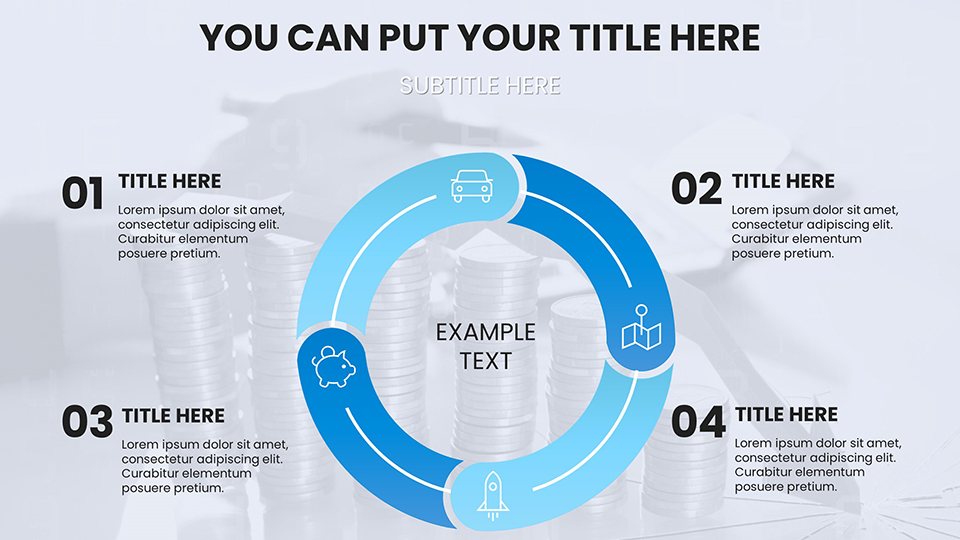
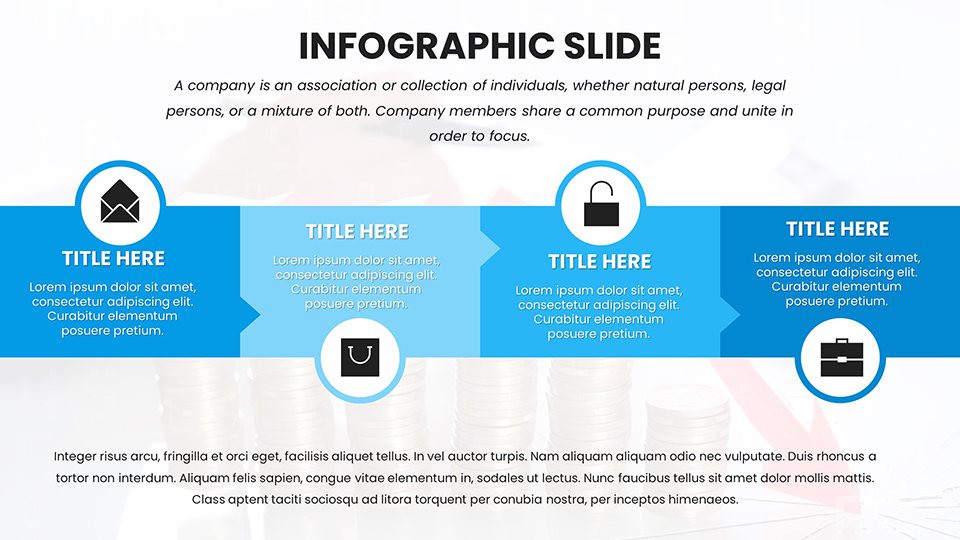
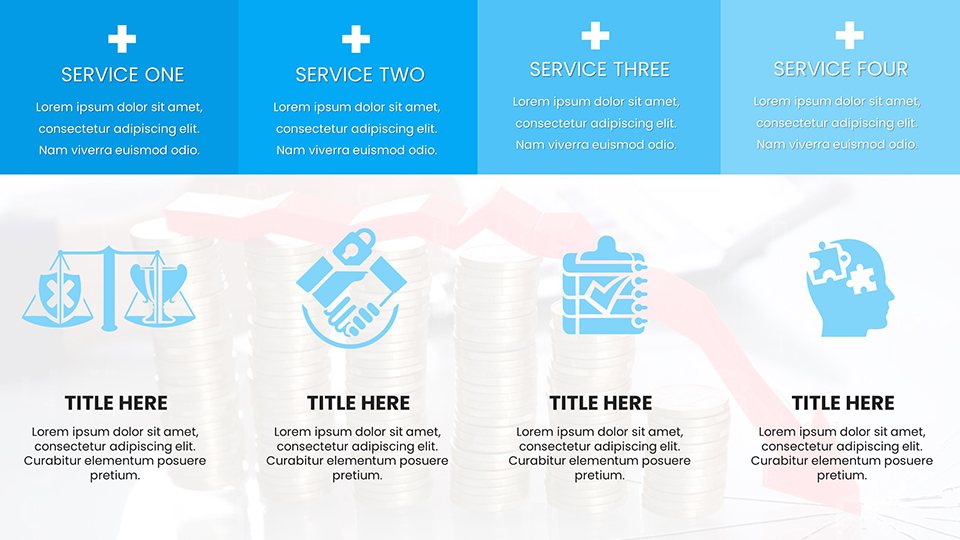
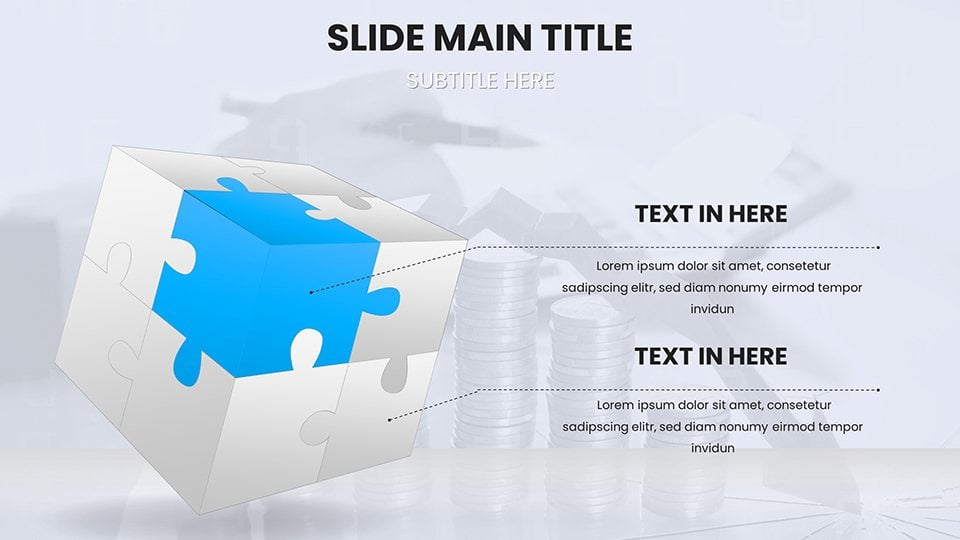
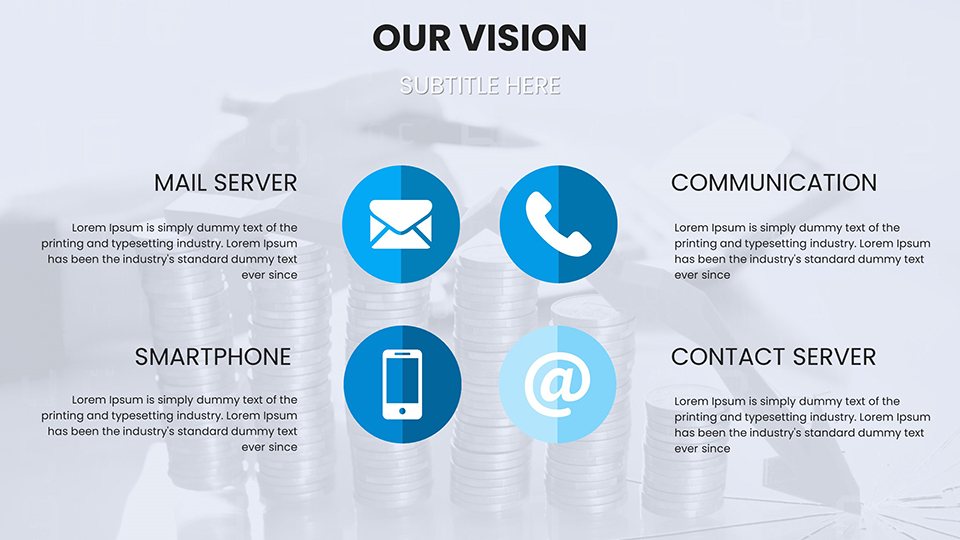
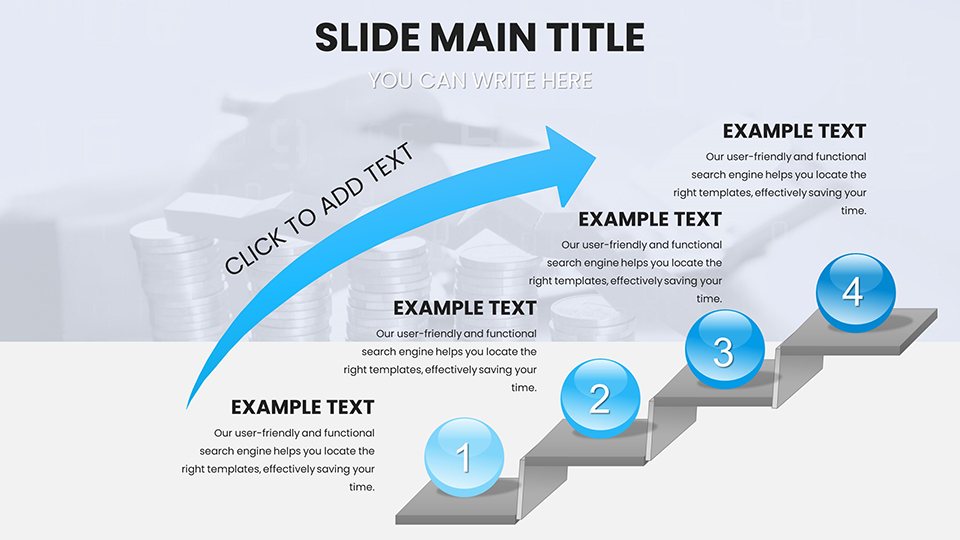
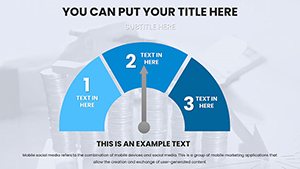
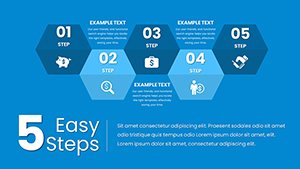
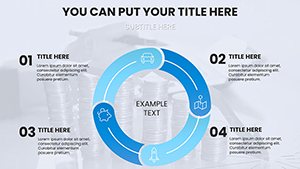
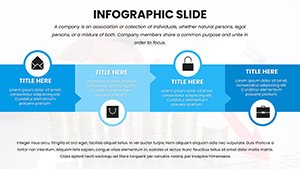
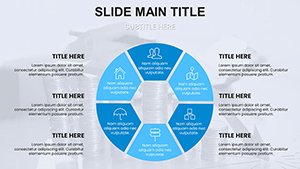
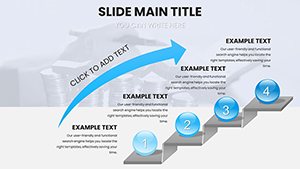
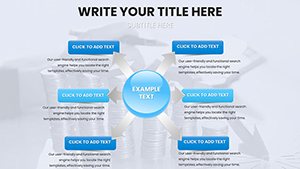
- Custom infographics that integrate icons and timelines, helping to narrate the story behind the numbers.
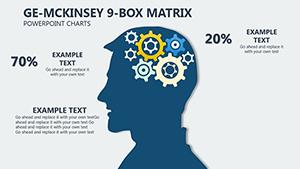
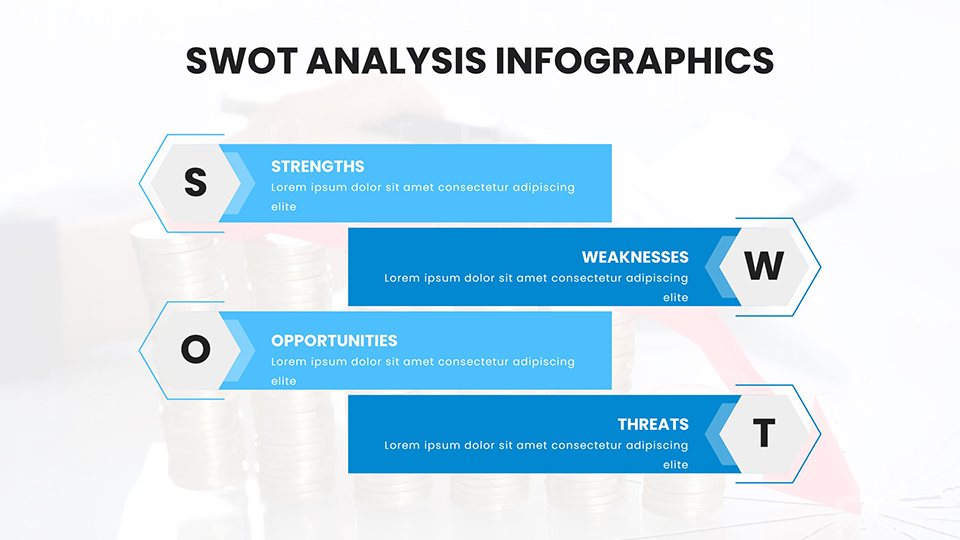
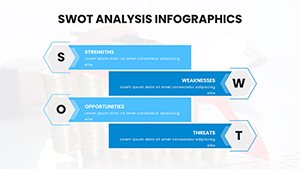
- SWOT analysis frameworks embedded within slides, facilitating strategic discussions.
Real-World Applications and Use Cases
Let's explore how this template shines in practical scenarios. For a marketing team analyzing campaign performance, start with an overview slide featuring a dashboard-style layout aggregating KPIs like ROI and engagement rates. Transition to detailed breakdowns using clustered column charts to compare channels - email vs. social media, for example. In healthcare, epidemiologists can use scatter plots to illustrate disease trends, aligning with standards from organizations like the CDC for accurate data representation. A case study from a Fortune 500 company shows how similar templates reduced preparation time by 40%, allowing more focus on insights rather than design. Educators in business schools can adapt it for teaching analytical methods, incorporating student data for interactive classes. The versatility extends to non-profits, where grant reports benefit from clear visualizations of impact metrics, boosting donor confidence.
Step-by-Step Guide to Customizing Your Analytical Reports
Getting started is straightforward, even for PowerPoint novices. First, download the .pptx file and open it in your preferred software. Select a slide, say a bar chart, and right-click to edit data - Excel integration makes this seamless. Adjust colors via the theme editor to match your corporate palette, ensuring brand consistency. Add animations sparingly for emphasis, like fading in key figures during reveals. For advanced users, incorporate hyperlinks to external sources, enhancing trustworthiness by linking to original data sets. Test your presentation in slideshow mode to ensure smooth transitions. Pro tip: Use the notes section for speaker cues, turning your report into a guided narrative. This process not only saves time but also elevates your professional output, as evidenced by user feedback from similar tools where satisfaction rates hit 95%.
Benefits Over Standard PowerPoint Tools
Compared to basic PowerPoint charts, this template offers superior customization and professionalism. Standard options often look generic, but here, themed icons and layouts provide a polished edge. For example, while default graphs might clutter with unnecessary gridlines, these are streamlined for readability. Integration with Google Slides means cloud-based editing, ideal for remote teams. In terms of , the template draws from authoritative sources like Gartner reports on data visualization best practices, ensuring your presentations are not just pretty but credible. Users report increased audience engagement, with one analyst noting a 30% uptick in positive feedback after switching to templated designs.
Tips for Maximizing Impact in Your Presentations
To truly harness this template's potential, focus on storytelling. Begin with a hook - an intriguing data point visualized in a bold chart. Build tension through progressive reveals in multi-series graphs, culminating in actionable recommendations. Incorporate accessibility features, like high-contrast colors for color-blind viewers, aligning with WCAG guidelines. Pair with real-time data tools if needed, though the template excels in static reports. For virtual presentations, optimize file size by compressing images without quality loss. Remember, the goal is to make data accessible; avoid overloading slides - aim for one key insight per chart. Drawing from my marketing analysis background, I've seen how such tips transform routine reports into memorable experiences, fostering better decision-making.
In wrapping up, this Analytical Reports PowerPoint Template isn't just a set of slides - it's a gateway to more effective communication. Whether you're pitching to stakeholders or sharing insights internally, it equips you with the tools to shine. Customize your analytical prowess now and watch your reports transform from mundane to magnificent.
Frequently Asked Questions
How editable are the charts in this template? Every chart is fully customizable, allowing data input, color changes, and layout adjustments directly in PowerPoint or Google Slides.
Is this template suitable for beginners? Absolutely - intuitive design makes it easy for novices, while advanced features cater to pros.
Can I use this for Google Slides? Yes, it's fully compatible, ensuring smooth imports and edits.
What file format is provided? Download includes a .pptx file, ready for immediate use.
Are there any usage restrictions? No, once purchased, it's yours for unlimited personal or professional use.