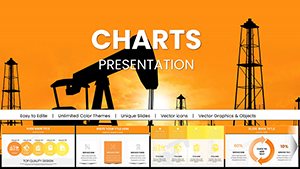
Oil and Gas Extraction PowerPoint Charts Template


Type: PowerPoint Charts template
Category: Illustrations
Sources Available: .pptx
Product ID: PC01007
Template incl.: 59 editable slides
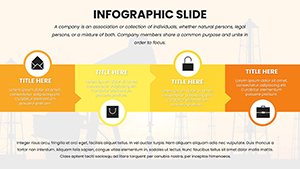
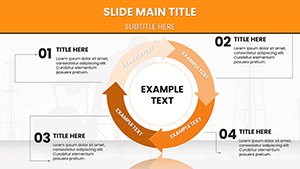
Navigate the dynamic landscape of energy extraction where data drives discovery, and let our Oil and Gas Extraction Companies PowerPoint Charts template fuel your presentations. With 59 editable slides, this toolkit is ideal for executives, engineers, and analysts in the petroleum industry to illustrate drilling efficiencies, reserve estimations, or market forecasts. Envision converting geological surveys into vivid visuals that spotlight opportunities, making your pitches as potent as a gushing well.
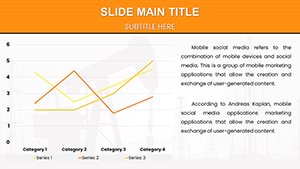
Anchored in guidelines from the American Petroleum Institute (API), the template employs industrial tones and rig-inspired graphics to project expertise. Use funnel charts for production pipelines or area graphs for commodity price fluctuations, weaving tales of innovation that captivate stakeholders in conference rooms or virtual summits.
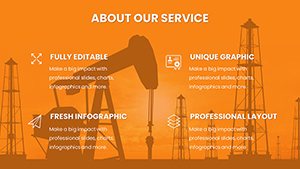
Vital Features for Energy Professionals
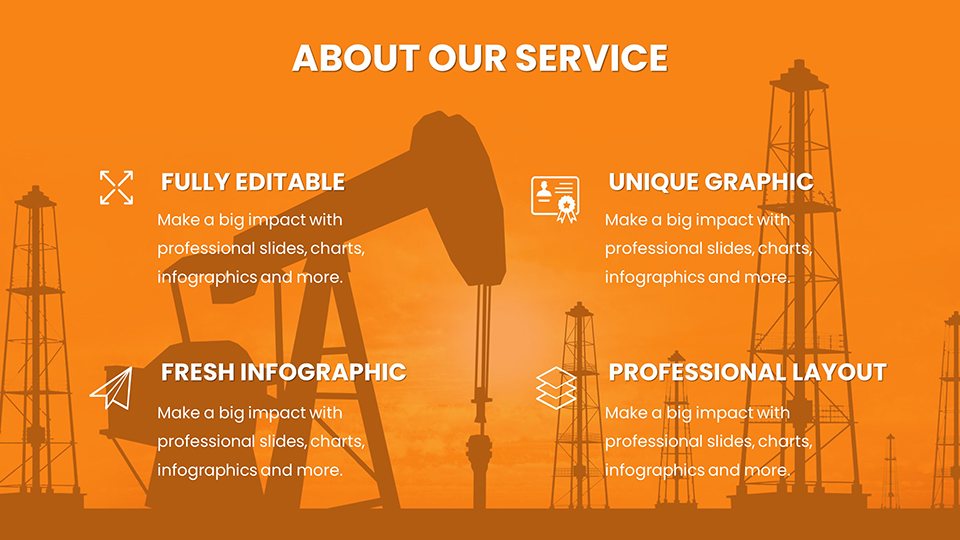
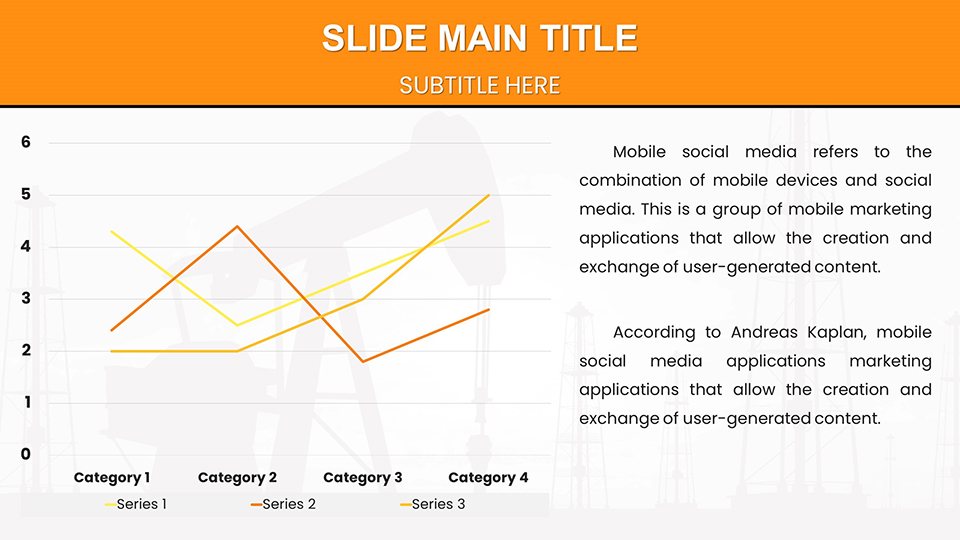
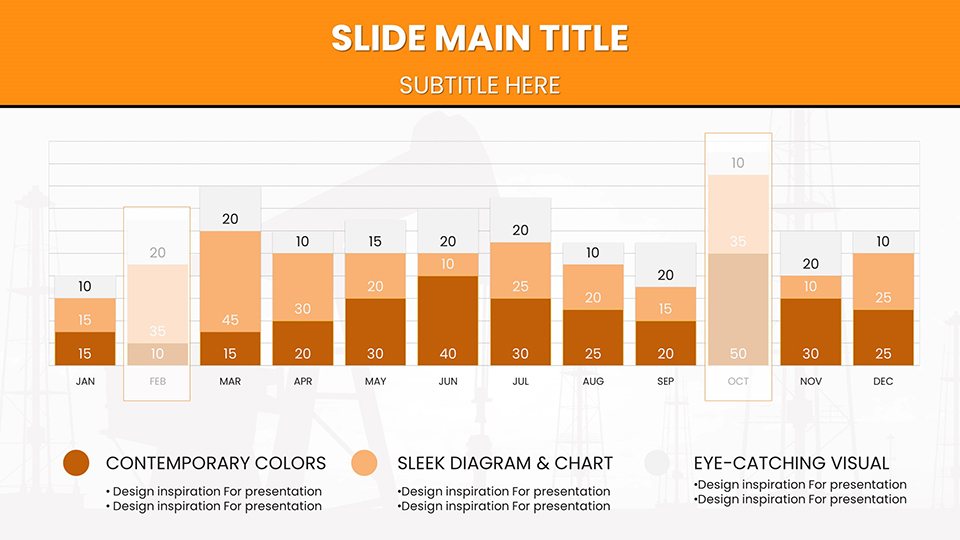
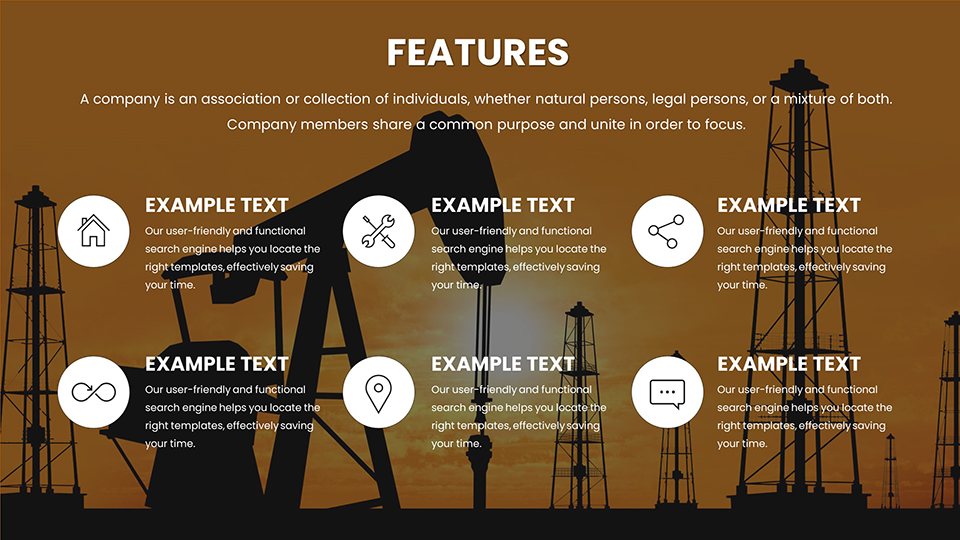
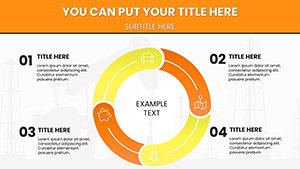
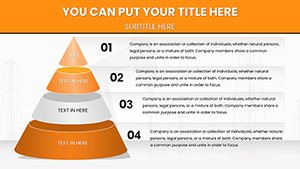
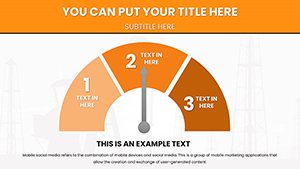
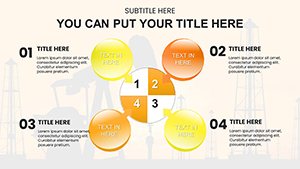
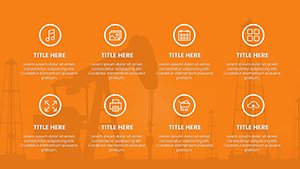
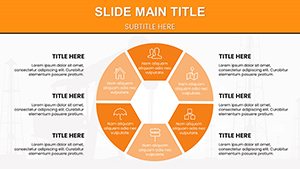
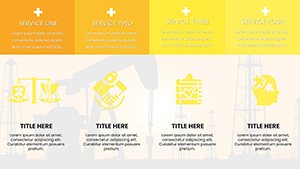
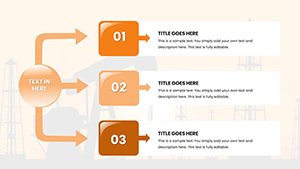
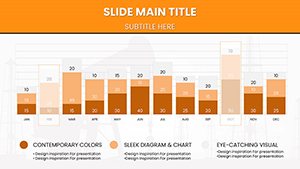
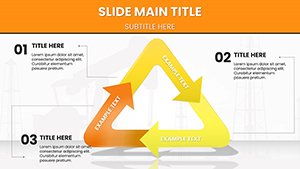
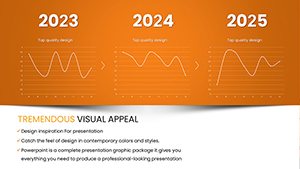
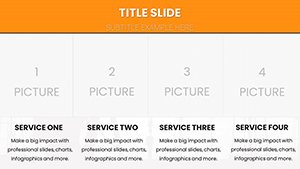
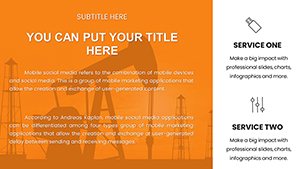
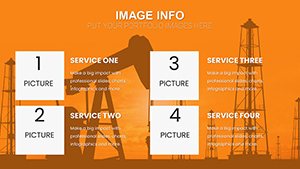
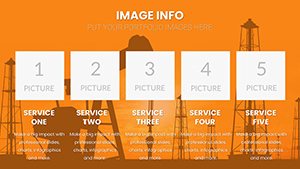
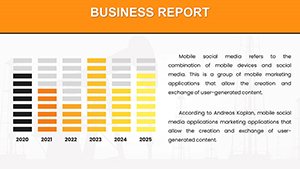
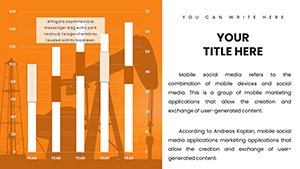
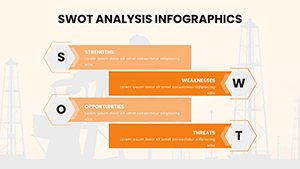
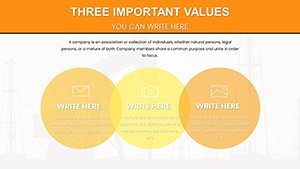
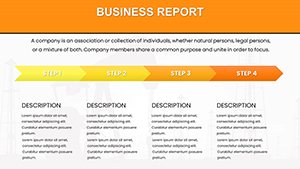
Key to this template are its industry-tuned features, including vector icons of derricks, pipelines, and refineries for realistic depictions. Tailor effortlessly: modify to reflect corporate identities or embed real-time data feeds. Charts range from stacked bars for resource allocation to line projections for future yields, adept at managing the sector's voluminous datasets.
PowerPoint and Google Slides compatibility supports hybrid workflows, from field reports to board meetings. Animations unfold progressively, like revealing stages of fracking processes, to sustain interest in lengthy technical discussions.
Targeted Applications in Extraction Operations
Inspired by an offshore company that optimized investments via visualized risk assessments, leading to a 20% efficiency gain, our template supports such triumphs. For project managers, deploy Gantt slides for exploration timelines; analysts can dissect financials with waterfall charts showing cost breakdowns.
At industry forums, present sustainability efforts with eco-metrics, citing International Energy Agency (IEA) data on carbon reductions. Picture a investor meeting where a customizable dashboard slide aggregates KPIs, accelerating funding decisions.
Amplifying Impact in the Energy Field
Distinguishing itself, the template includes thematic elements like gradient maps for reservoir simulations, enhancing understanding per energy journal findings by 45%. Slide notes offer guidance, such as aligning visuals with regulatory compliance for audits.
Seamlessly weave into operations - interface with GIS tools for spatial data or use for compliance training. This streamlines preparation, freeing resources for core extraction activities.
Expert Strategies for Powerful Delivery
- Data Integrity First: Validate sources in charts to uphold credibility.
- Visual Simplicity: Avoid clutter; focus on key insights per slide.
- Forecasting Tools: Leverage trend lines for predictive analytics.
- Adapt to Audiences: Simplify for executives, detail for technicians.
- Sustainable Updates: Incorporate green tech evolutions regularly.
These approaches, from petroleum experts, ensure presentations propel your projects forward.
Fuel Your Future Presentations
The Oil and Gas Extraction PowerPoint Charts template is your conduit to clearer communication. Access instantly to ignite discussions and drive progress. Strike oil in every slide - obtain this template and energize your endeavors.
Frequently Asked Questions
How detailed can charts get for technical data?Highly; support multi-axis and custom formulas for precision.
Ideal for virtual presentations?Yes, optimized for screen sharing with clear visuals.
Can it integrate external data?Sure, link to Excel for live updates.
Differences from standard templates?Industry-specific icons and layouts for energy focus.
Usage for training?Perfect, with step-by-step process slides.