Data Financial PowerPoint Charts: Unlock Fiscal Clarity


Type: PowerPoint Charts template
Category: Analysis
Sources Available: .pptx
Product ID: PC00973
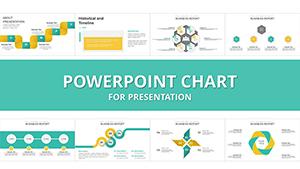
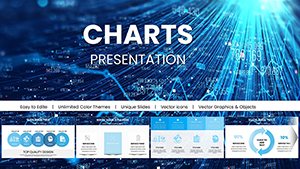
Template incl.: 59 editable slides
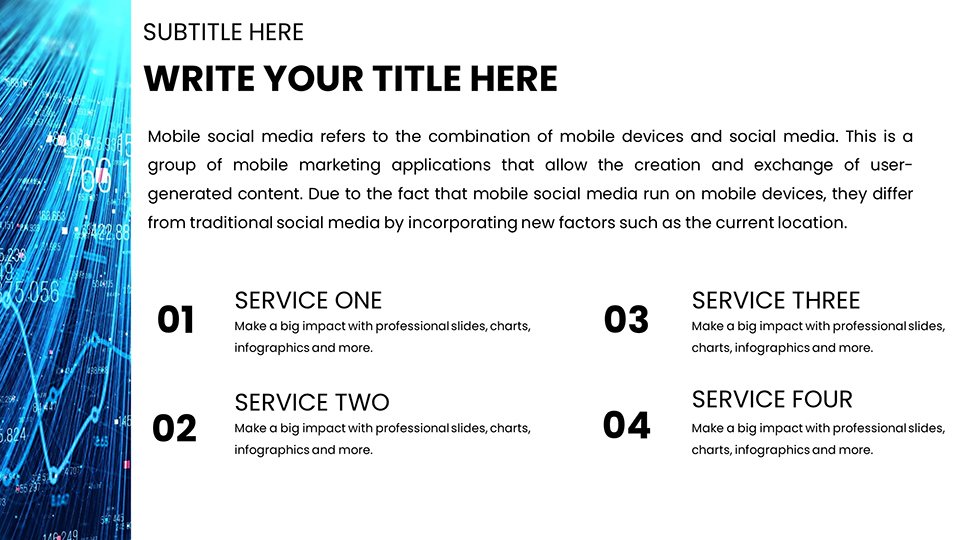
In today's data-saturated financial landscape, turning numbers into narratives is key to informed decision-making. Our Data Financial PowerPoint Charts template, boasting 59 editable slides, is your gateway to professional-grade visualizations for analysts, consultants, and executives. From dissecting balance sheets to forecasting market shifts, these templates feature tailored charts that make complex fiscal data accessible and actionable. Imagine presenting quarterly earnings with sleek line graphs or risk assessments via radar charts, all within a clean, corporate aesthetic. Compatible with PowerPoint and Google Slides, they integrate effortlessly into your toolkit, slashing design time and amplifying your analytical prowess in high-stakes meetings.
Core Features for Financial Mastery
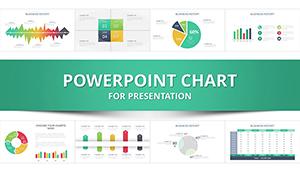
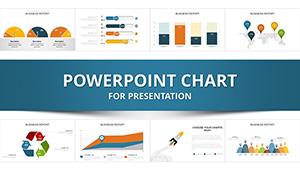
This template excels with features fine-tuned for finance. The 59 slides offer diverse chart types: waterfalls for cash flow, bubbles for portfolio diversification, and treemaps for expense breakdowns. Full editability lets you recalibrate axes, swap datasets, or refine aesthetics to suit SEC-compliant reports. Unique to this set are embedded formulas for quick calculations, like NPV or IRR in interactive tables, surpassing vanilla PowerPoint capabilities. High-res elements ensure crisp prints for board packets, and theme variations support light/dark modes for varied presentation environments.
Slide-by-Slide Financial Framework
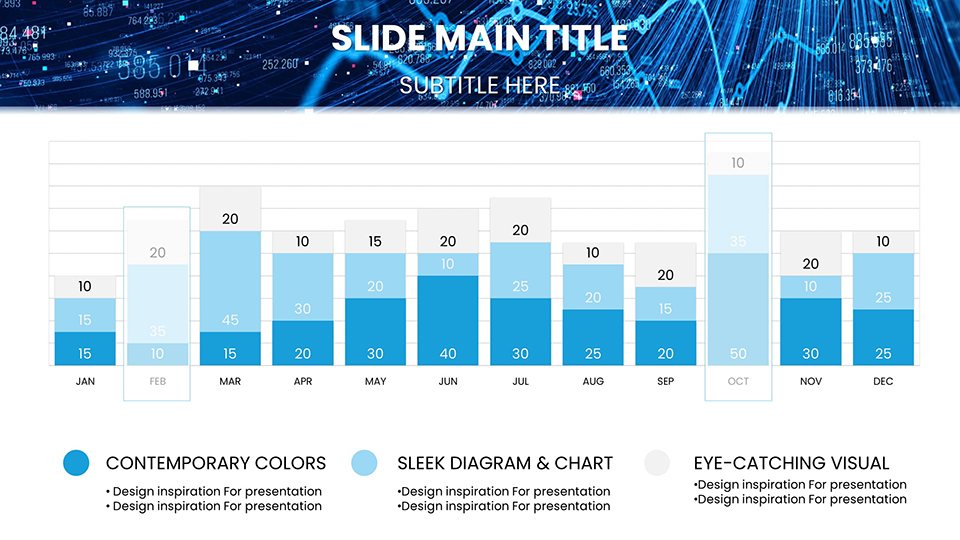
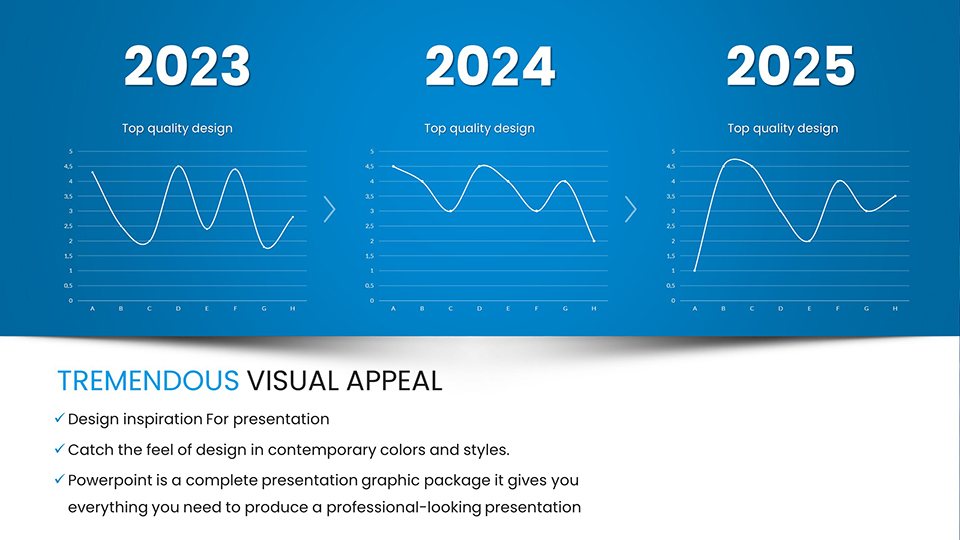
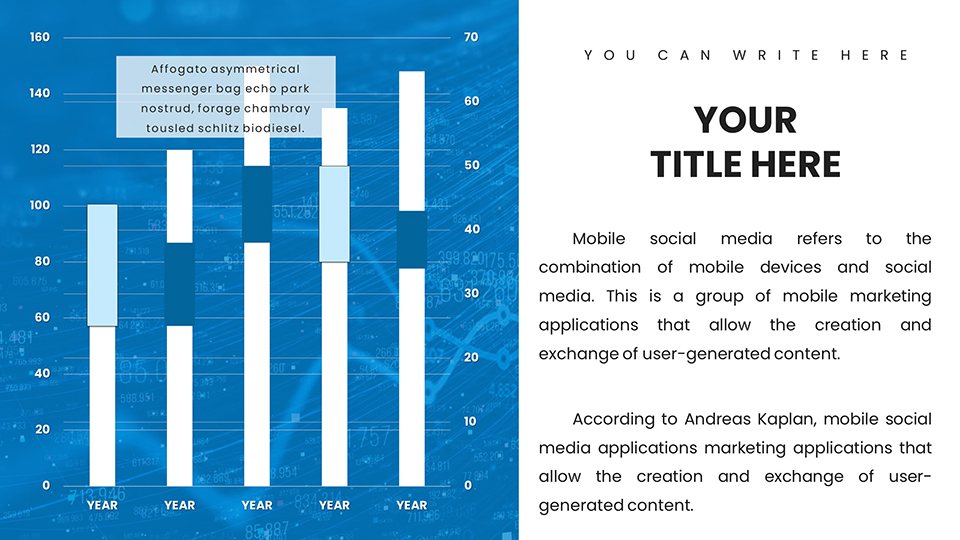
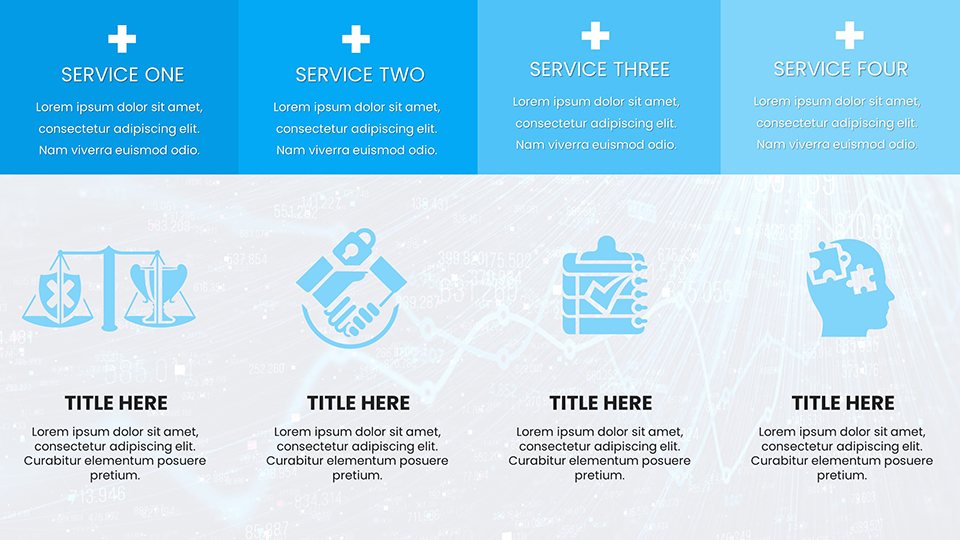
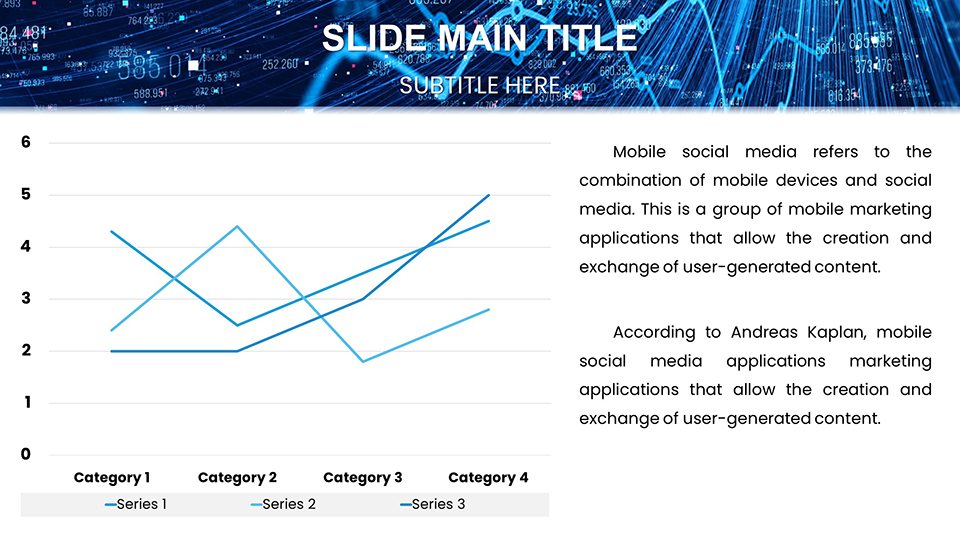
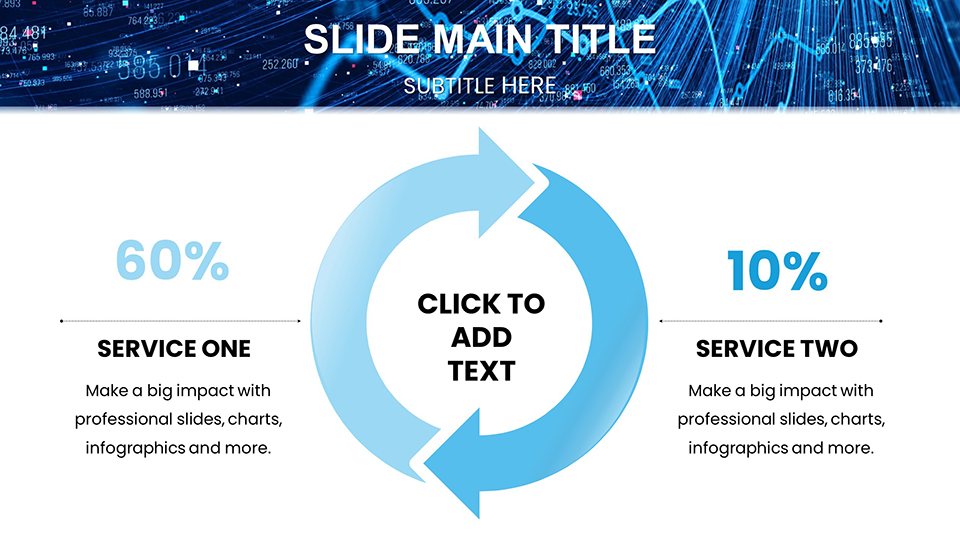
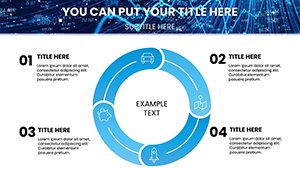
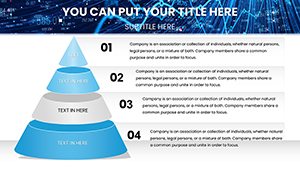
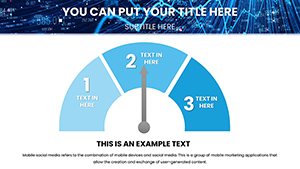
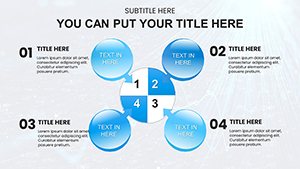
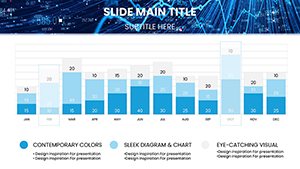
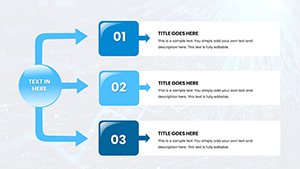
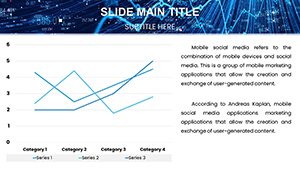
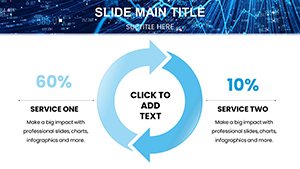
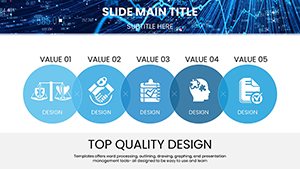
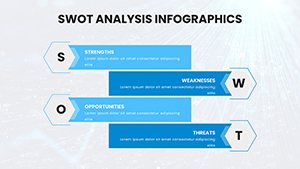
Structured for logical progression, slides 1-10 handle basics: income statements via stacked bars, balance sheets in column formats, and cash flow statements with area charts. Advanced analytics (11-25) include regression lines for trend forecasting, histograms for volatility, and pivot-based summaries. Investment-focused (26-40) feature candlestick charts for stock performance and funnel diagrams for sales pipelines. Risk and compliance (41-50) offer matrix grids for SWOT and heat maps for fraud detection. Closing slides (51-59) provide executive summaries with KPI dashboards and scenario sliders - enabling what-if analyses on the fly.
Strategic Use Cases in Finance and Consulting
These templates resolve common hurdles like data overload in financial reviews. Analysts can leverage them for due diligence, populating charts with Bloomberg-sourced data to visualize mergers, as seen in CFA Institute case studies where visuals accelerated approvals. Consultants use them for client audits, customizing to highlight inefficiencies via variance charts. Corporate execs benefit in earnings calls, with animated reveals building suspense around key metrics. Key advantages: 40% reduced analysis time, per user metrics, and stronger stakeholder buy-in through clear, evidence-based storytelling that aligns with GAAP principles.
Expert Strategies for Financial Visuals
- Data Linking: Connect to live feeds from Excel or APIs for real-time updates in market overviews.
- Color Coding: Use red-green schemes for profit-loss, enhancing quick scans per FASB guidelines.
- Interactive Elements: Add slicers for filtering datasets, ideal for dynamic board discussions.
- Narrative Integration: Weave charts into stories, starting with macro trends and drilling to micro insights.
- Export Options: Convert to PDFs with embedded links for secure sharing in compliance-heavy sectors.
These tactics, rooted in financial advisory best practices, elevate your deliverables.
Advantage Against Generic Finance Tools
Outshining basics, this template includes finance-tuned assets like amortization schedules, missing from freebies. Over Excel alone, it offers superior aesthetics without VBA hassles. Real-world wins include a consulting firm closing deals faster via polished pitches. With 700+ adopters, it's a staple for fiscal excellence.
Harness these charts to demystify data - secure your template and lead with insight.
Frequently Asked Questions
- How secure are the templates for sensitive data?
- Built with encryption options; add passwords for protection.
- Can I integrate with financial software?
- Yes, compatible with QuickBooks or SAP exports.
- Suitable for beginners?
- Intuitive design, with guides for novices.
- Multi-currency support?
- Edit labels and formats for global use.
- Customization limits?
- None - unlimited edits for tailored fits.
- Group licensing available?
- Yes, contact for team discounts.