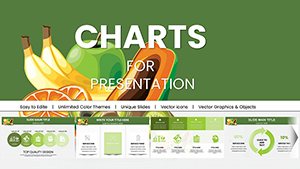
Fruits PowerPoint Charts Template: Infuse Freshness into Your Presentations


Type: PowerPoint Charts template
Category: Illustrations
Sources Available: .pptx
Product ID: PC00945
Template incl.: 59 editable slides
In a world where health messaging competes for attention, standing out with vivid, fruit-inspired visuals can make all the difference. Our Fruits PowerPoint Charts Template delivers exactly that, with 59 editable slides bursting with color and clarity to spotlight nutritional benefits and beyond. Perfect for educators teaching vitamin-rich diets, marketers promoting produce lines, or students defending theses on agriculture, this template turns facts into flavorful stories. Fully compatible with PowerPoint PPTX and Google Slides, it simplifies design, letting you harvest the fruits of your labor quickly. Rooted in reliable sources like the FAO's food security data, it ensures your presentations are nutritious in content and appealing in form, driving home messages that stick.
Cultivate Engaging Content with Fruitful Designs
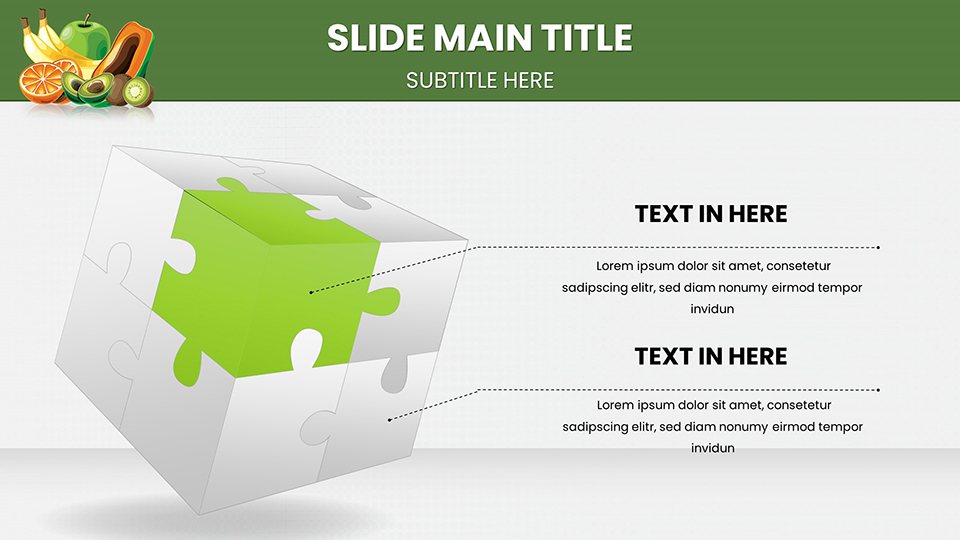
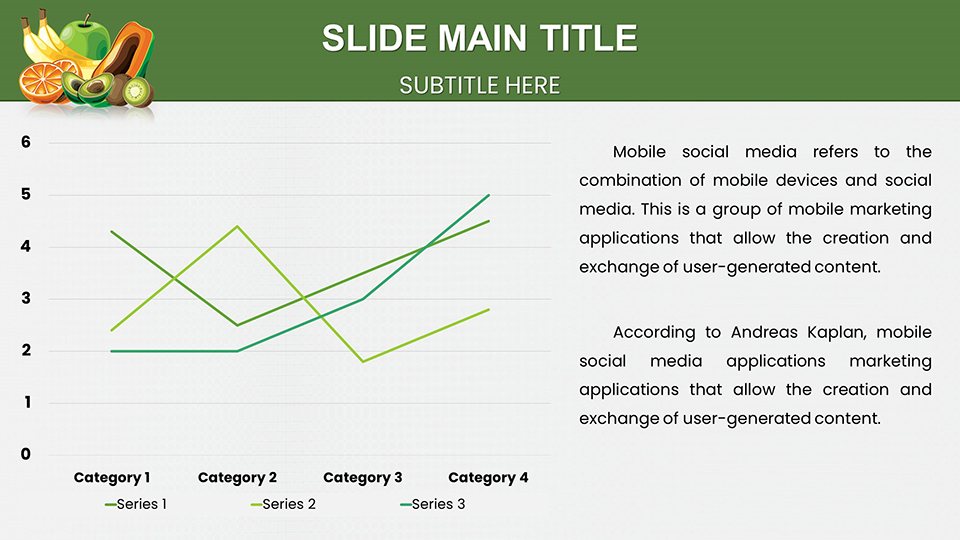
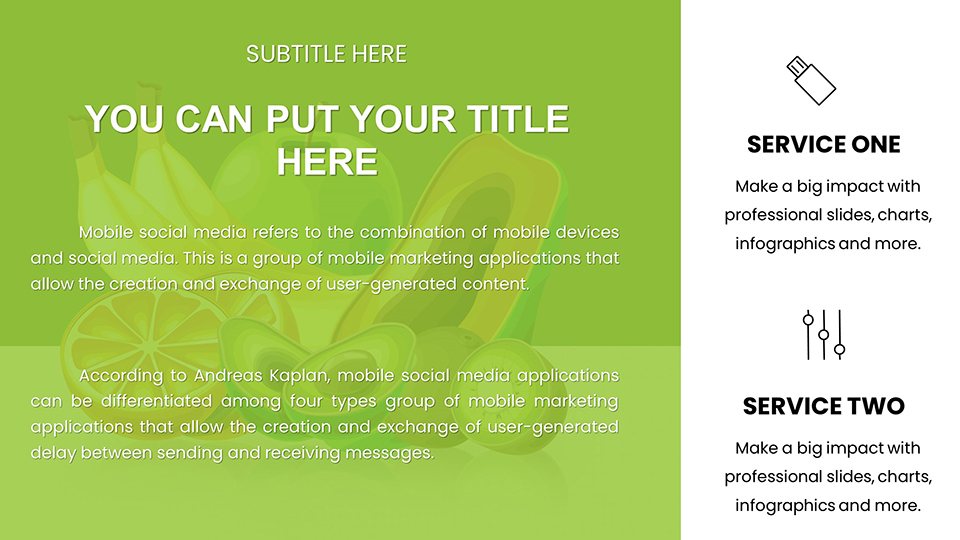
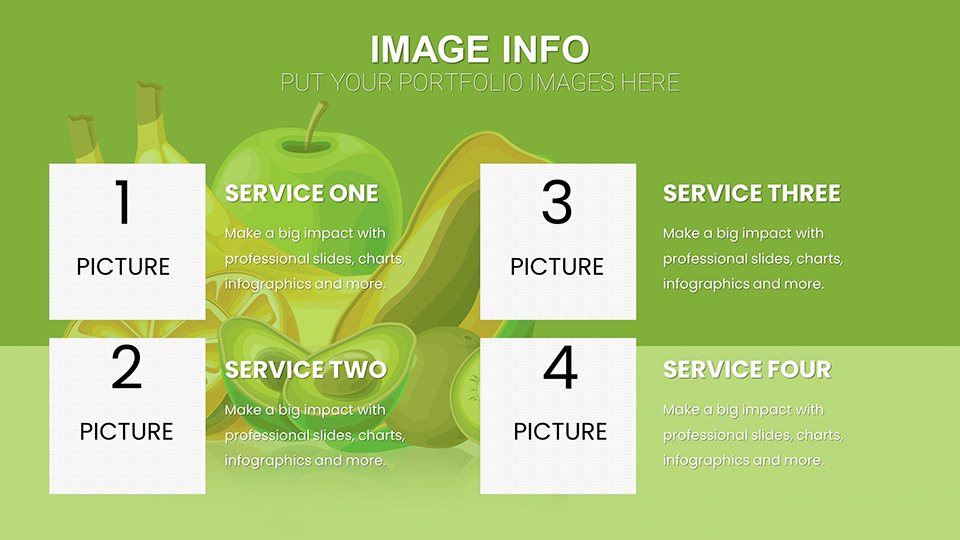
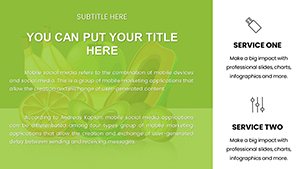
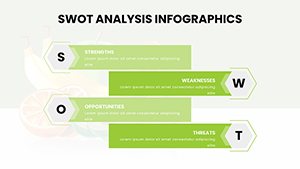
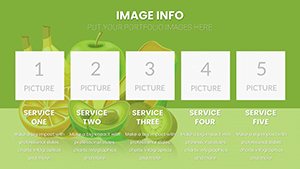
This template's essence is its lively illustrations of apples, berries, and citrus, paired with charts that make data pop like fresh produce. Visualize a scatter plot mapping antioxidant levels across fruits, pulled from databases like Phenol-Explorer, to engage audiences in antioxidant discussions. Such integrations promote understanding, as visual learning theories suggest, enhancing recall in educational or sales contexts. For business users, adapt to show market trends in fruit exports, referencing USDA reports for credibility. The designs evoke vitality, ideal for health campaigns or classroom sessions, where fruity motifs can lighten heavy topics like obesity prevention.
Core Features Harvested for Success
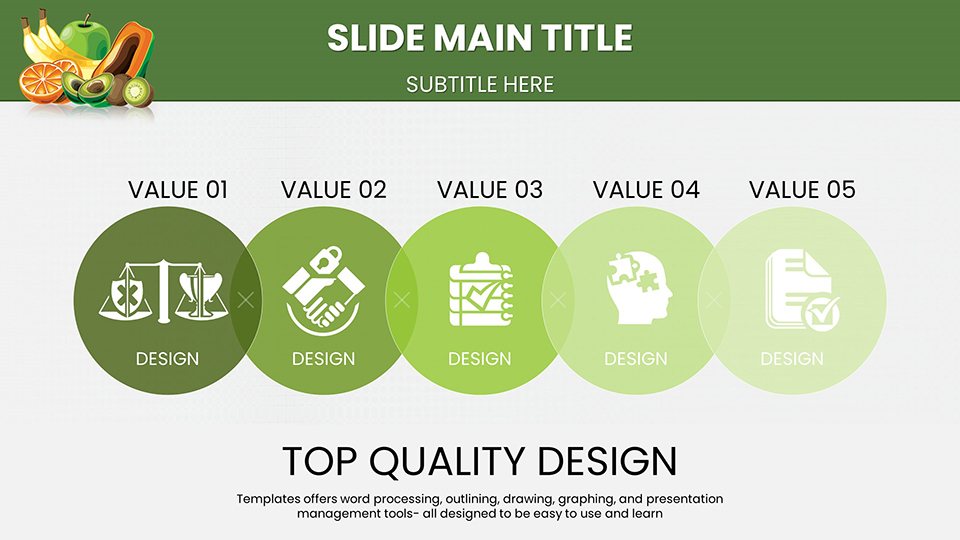
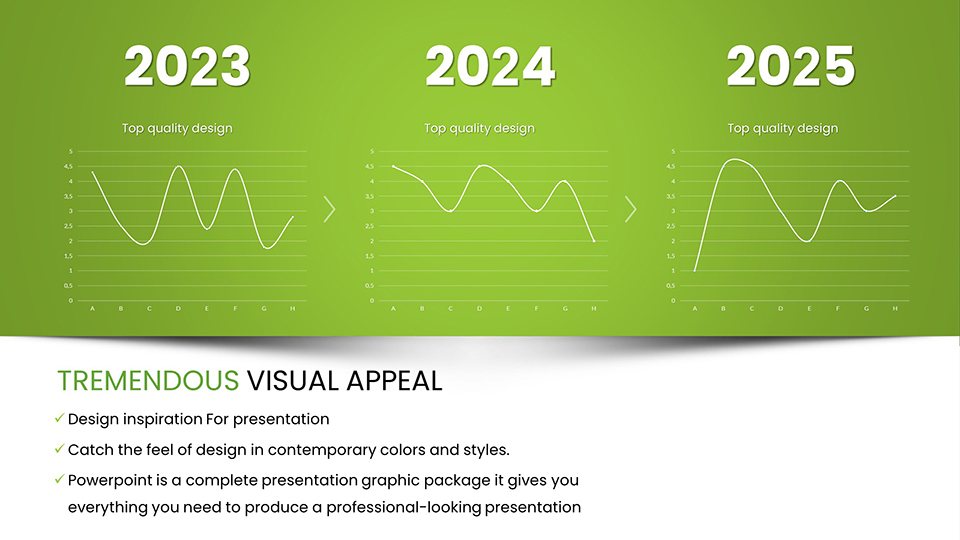
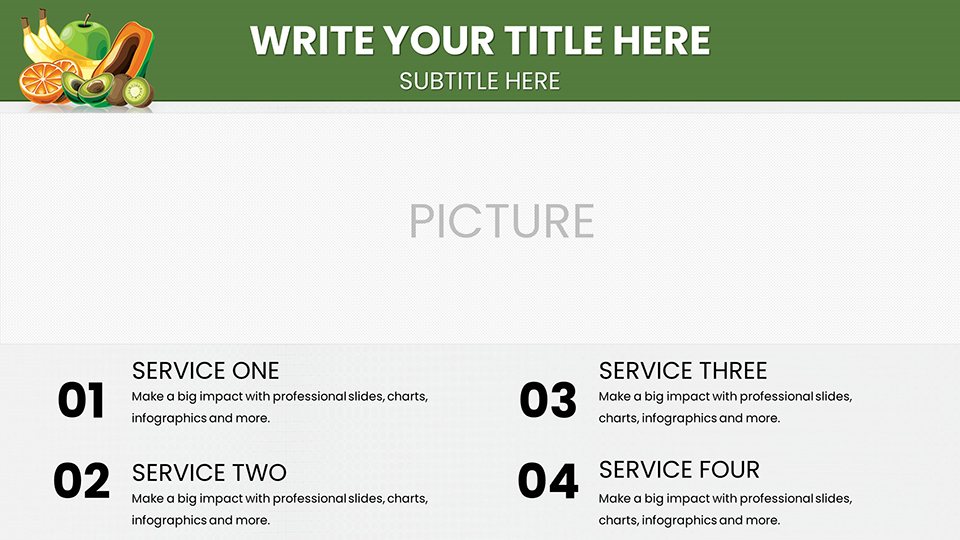
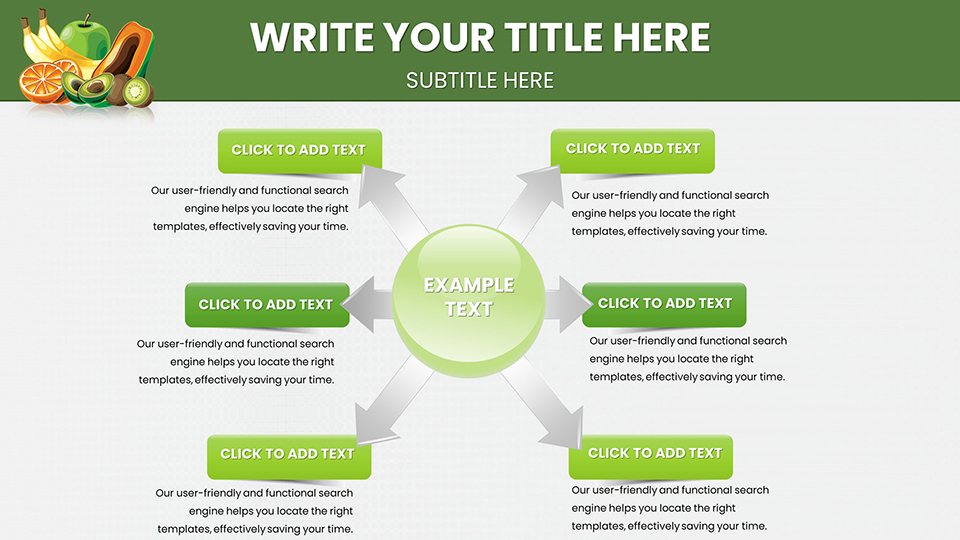
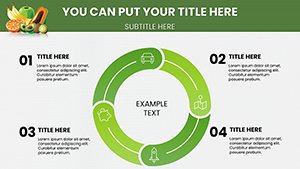
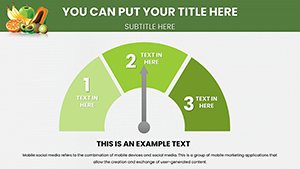
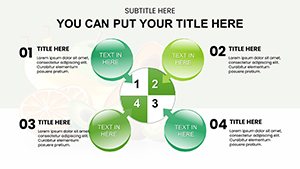
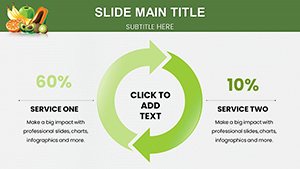
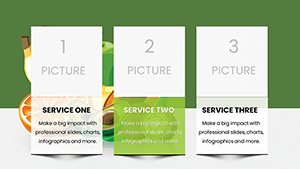
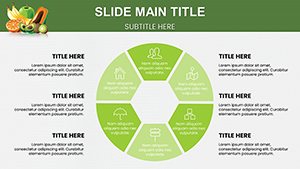
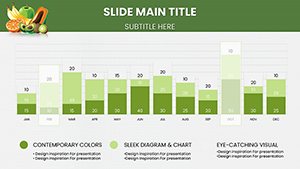
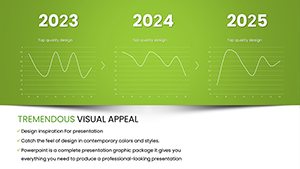
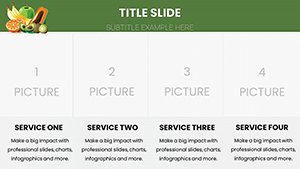
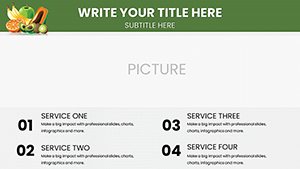
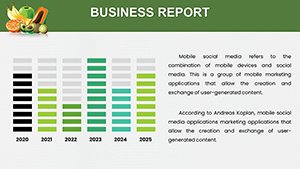
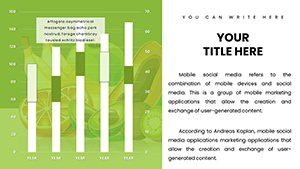
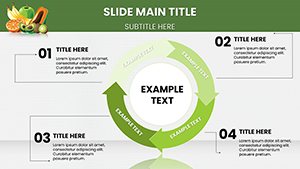
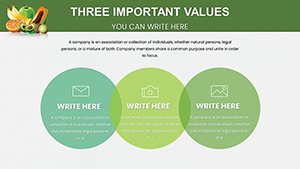
From editable graphs to thematic icons, features abound: customize line charts for seasonal availability, pie charts for nutritional compositions, or bar graphs for consumption stats. Adjust palettes to seasonal vibes - oranges for fall, greens for spring - and fonts for emphasis. The 59 slides cover intros to conclusions, all scalable and professional. Aligned with standards from the Produce for Better Health Foundation, these elements lend authority, supporting in your work. Add your twist with data from global studies, making each presentation uniquely yours.
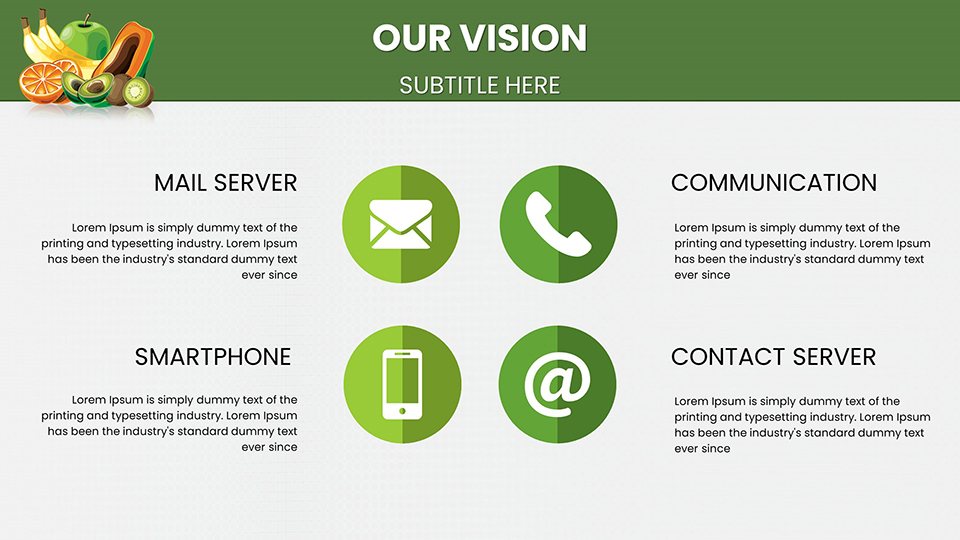
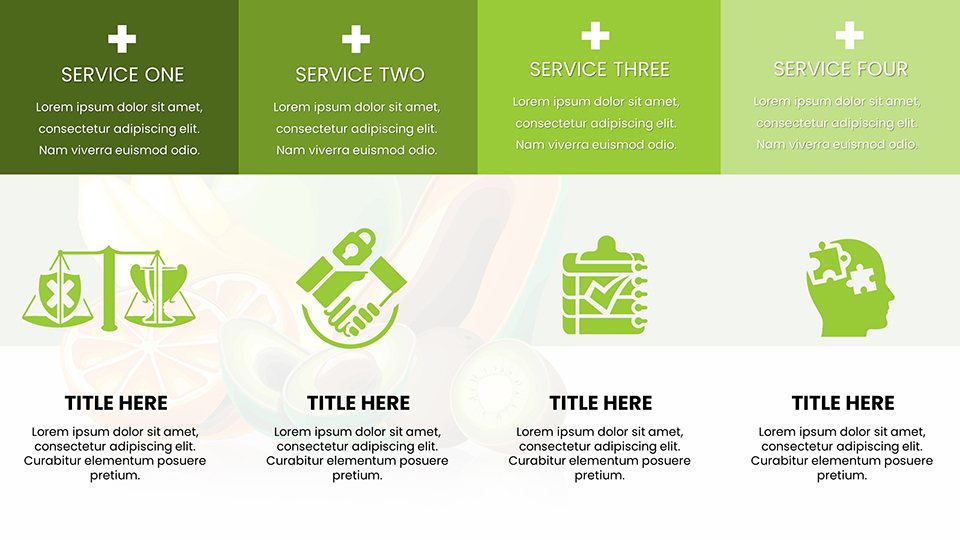
- Icon Library: Fruit-specific vectors for thematic reinforcement.
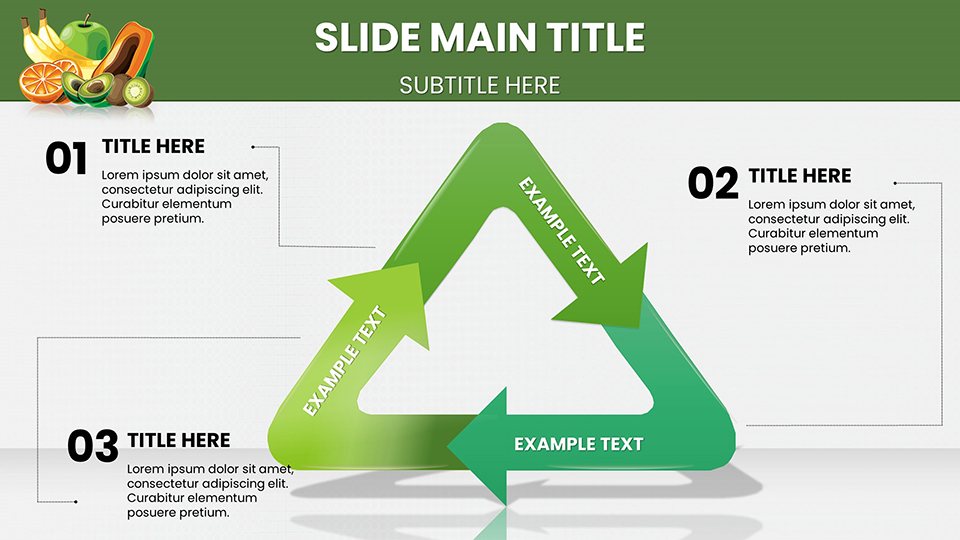
- Transition Effects: Smooth animations mimicking growth for dynamic reveals.
- Export Options: Versatile formats for sharing or printing.
Harvest Results in Varied Fields
Think of a teacher using charts to illustrate fruit-based experiments, boosting student interest per STEM education research. Or a marketer pitching smoothie innovations with growth projections, securing deals as in Nielsen consumer insights. Students might employ for projects on sustainable farming, citing UN sustainability goals. This adaptability overcomes blandness in standard tools, offering fruit-focused finesse that captivates and convinces, from boardrooms to classrooms.
Planting Seeds: Usage Roadmap
- Select and open the template, exploring fruit-themed options.
- Feed in data, aligning with your core message.
- Prune designs for audience fit - fun for kids, formal for execs.
- Enrich with examples or links.
- Reap the rewards in polished presentations.
Eclipsing generic options, it provides specialized appeal for memorable impacts.
Tips to Ripen Your Presentation Skills
Leverage expert advice: Use color psychology - reds for energy in berry slides - per design gurus. Keep narratives concise, following storytelling arcs from Joseph Campbell adaptations in business. Incorporate real fruit benefits, like vitamin C's immune boost from Mayo Clinic sources. These honed techniques ensure fruitful outcomes, cultivating audience growth and loyalty.
Pluck this Fruits PowerPoint Charts Template today and let your ideas bear fruit in every slide.
Frequently Asked Questions
Are the icons customizable?
Yes, all fruit icons can be resized, recolored, or replaced as needed.
Works with Google Slides offline?
Yes, with offline mode enabled, though online syncs enhancements.
Ideal for non-health topics?
Sure, adapt for marketing or education beyond fruits.
How to add custom data?
Simply paste into placeholders; charts update automatically.
Group licensing available?
Yes, contact us for team or institutional options.