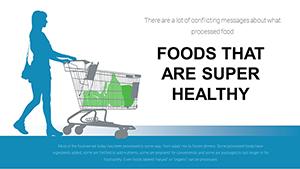
Food Products PowerPoint Charts: Templates for Nutrition and Industry Insights


Type: PowerPoint Charts template
Category: Illustrations
Sources Available: .pptx
Product ID: PC00943
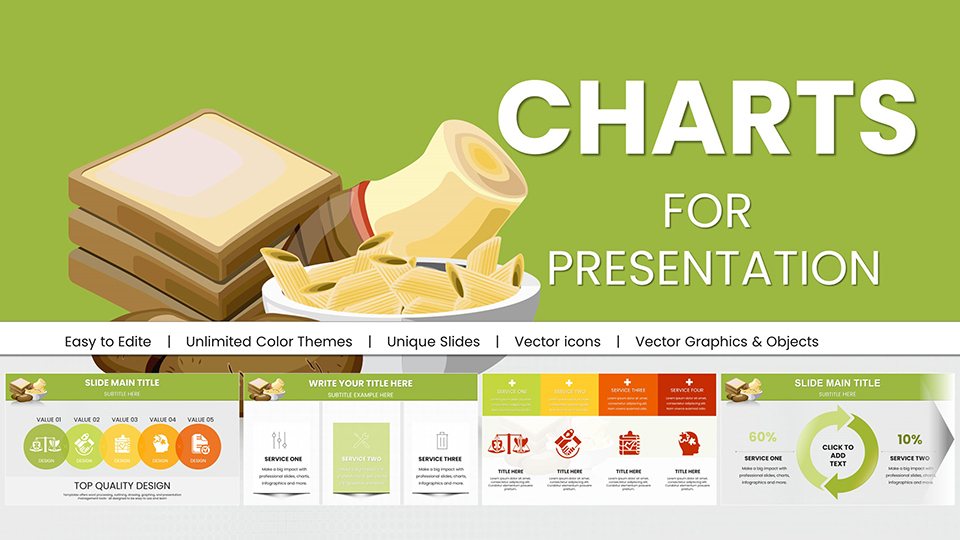
Template incl.: 59 editable slides
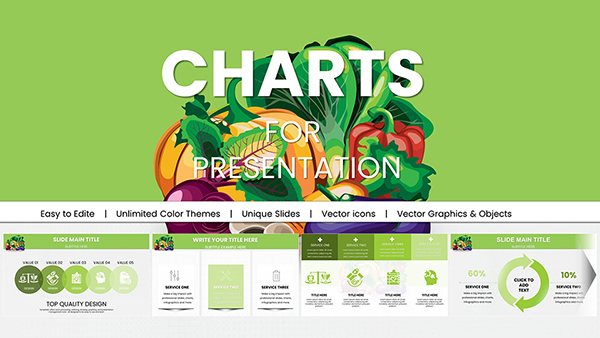
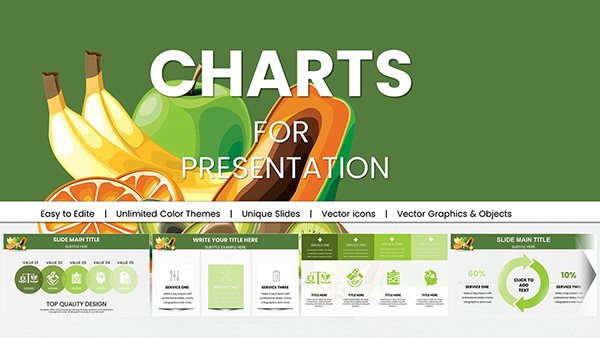
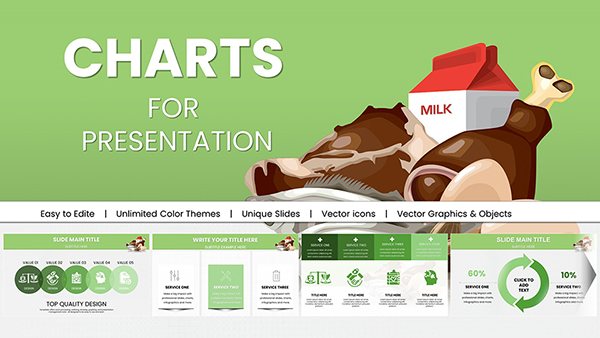
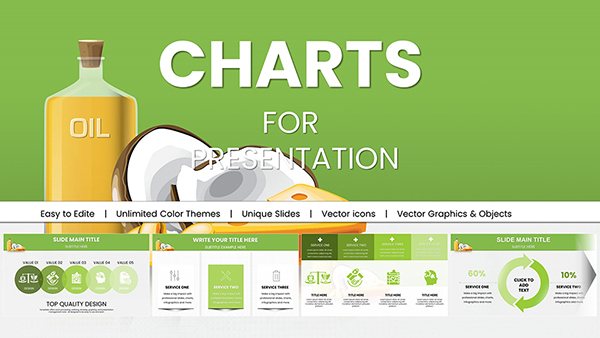
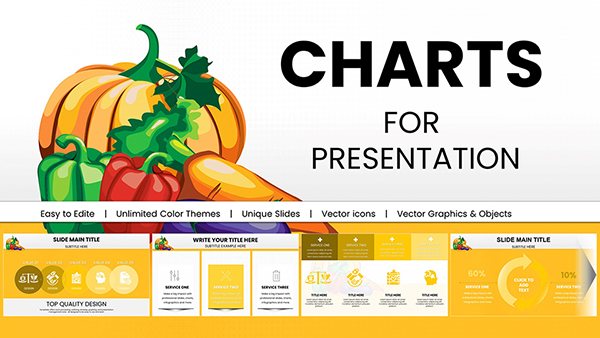
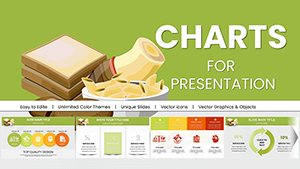
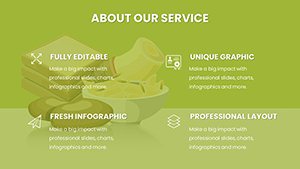
Dive into the flavorful world of food presentation with our specialized Food Products PowerPoint Charts template. Boasting 59 editable slides, this resource is a game-changer for nutritionists, chefs, and food marketers aiming to showcase product features, dietary benefits, or market dynamics. Forget bland slides; these are infused with thematic elements like ingredient icons and appetizing color schemes, making your data as enticing as the topics you cover.
Aligned with standards from organizations like the Academy of Nutrition and Dietetics, this template helps bridge the gap between complex nutritional data and audience understanding. Whether analyzing calorie breakdowns or trending superfoods, you'll craft presentations that not only inform but inspire action, such as adopting healthier eating habits or launching new product lines.
Exploring the Rich Features of Food-Focused Charts
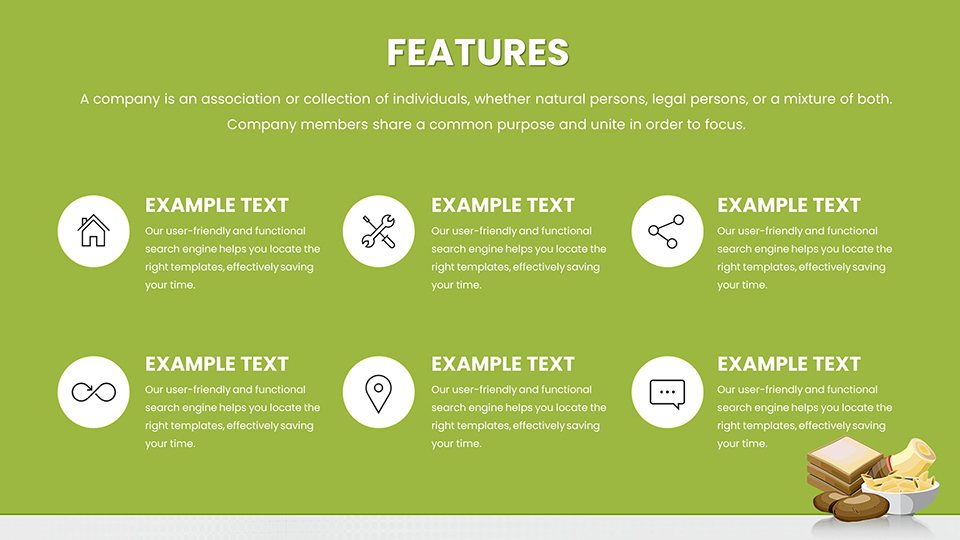
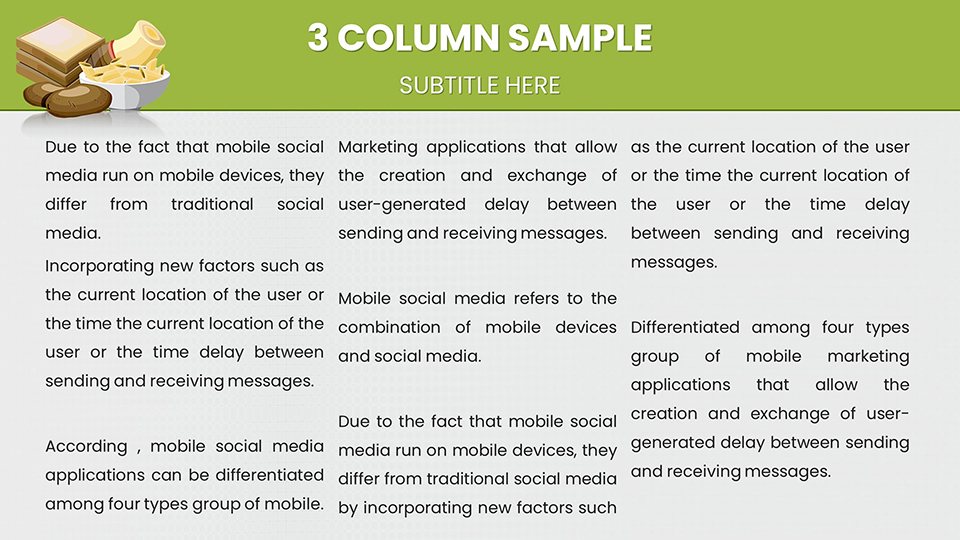
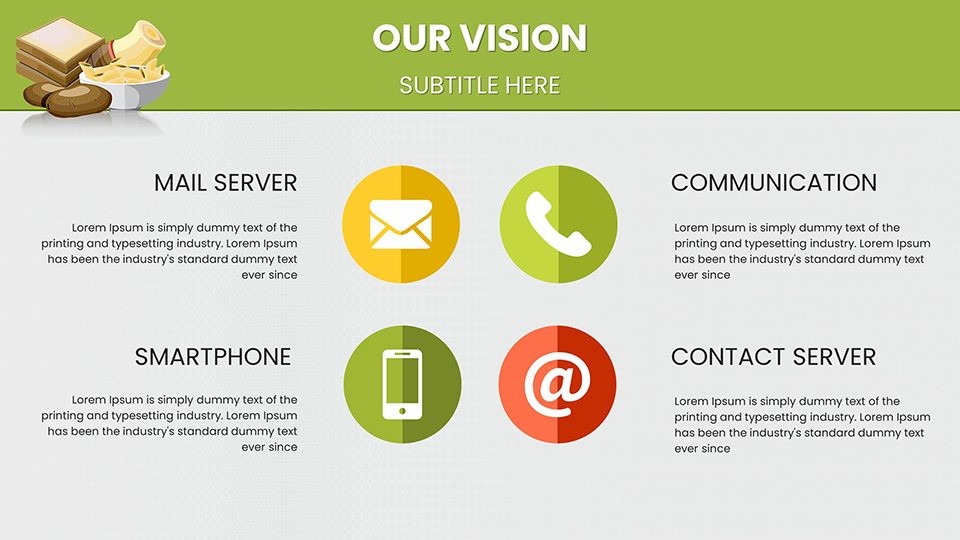
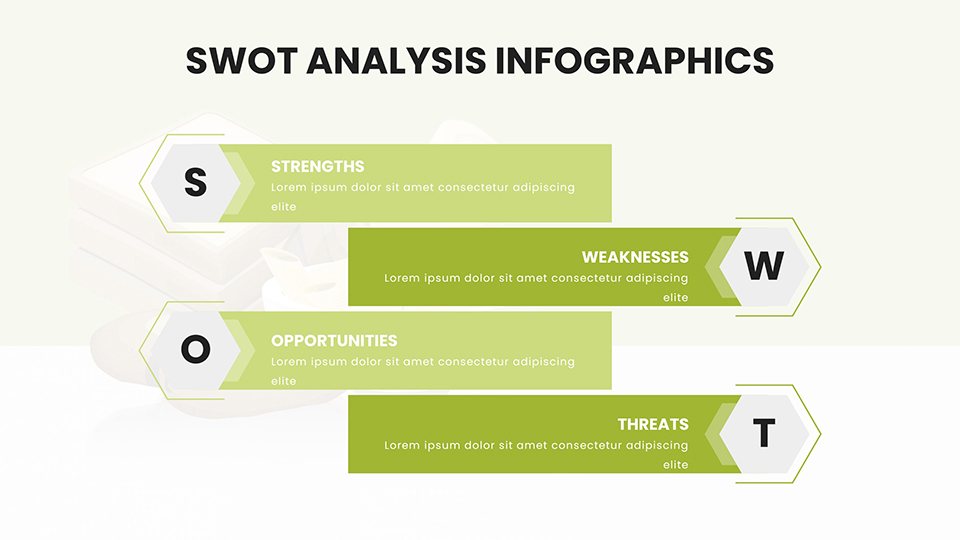
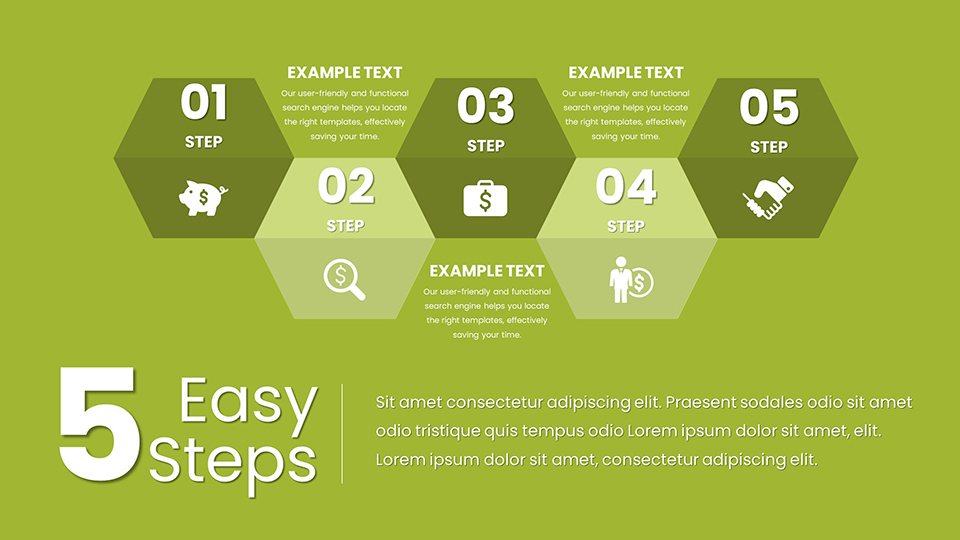
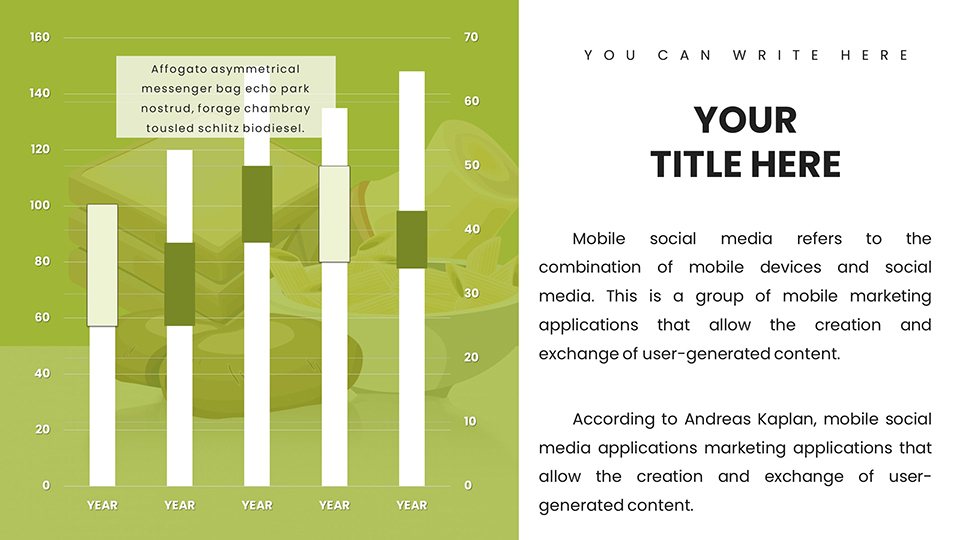
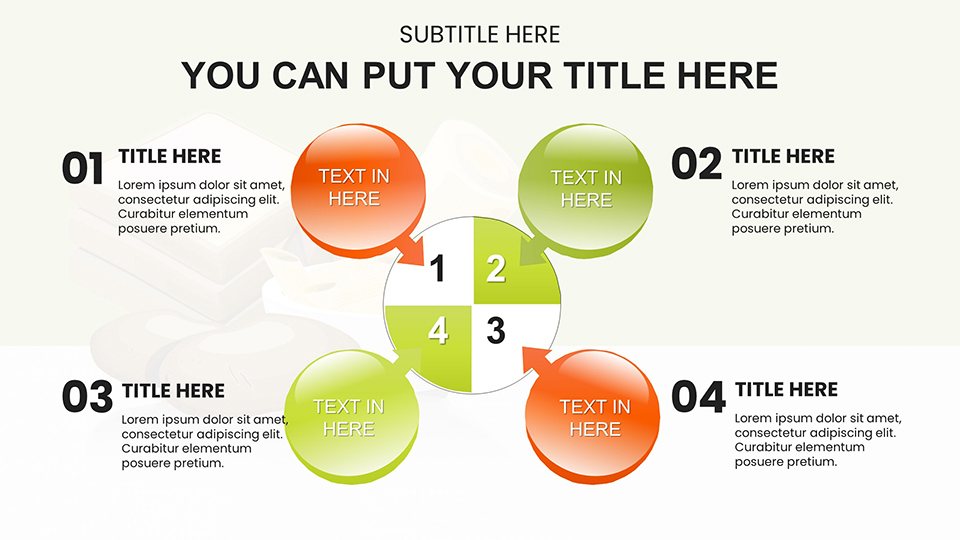
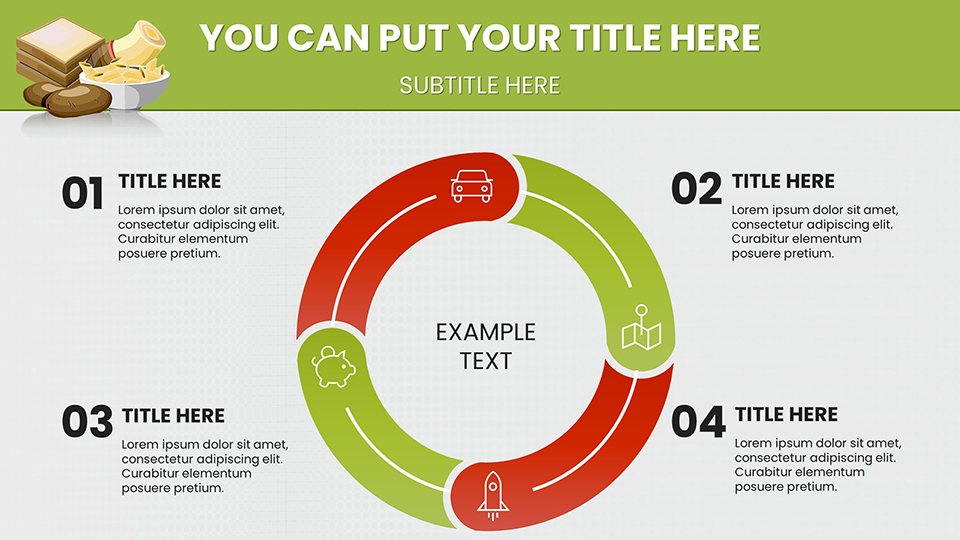
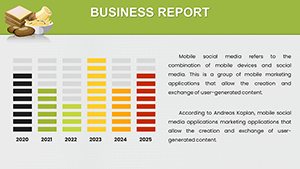
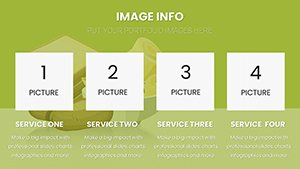
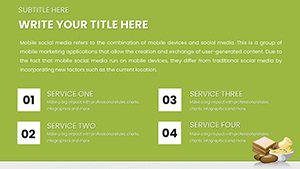
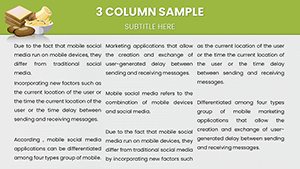
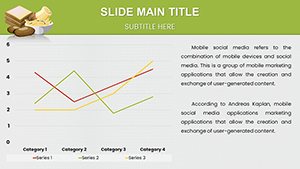
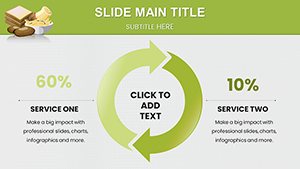
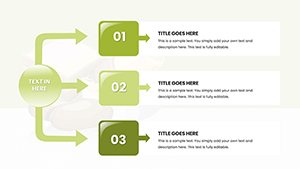
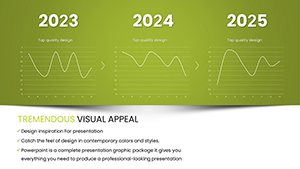
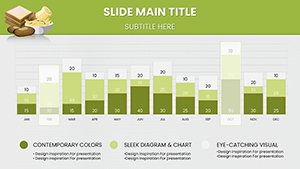
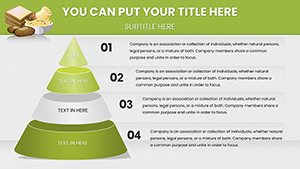
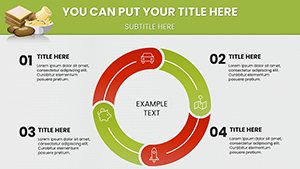
At the heart of effective food presentations lies visual appeal. Our template delivers with a suite of charts tailored for the industry, from column graphs depicting sales growth in snack categories to donut charts illustrating macronutrient distributions in meals.
Standout Template Components
- Diverse Chart Types: Including scatter plots for correlation between ingredients and health outcomes, and radar charts for comparing flavor profiles.
- Customization Freedom: Modify every aspect - shapes, texts, and data - to align with your narrative.
- Multi-Format Support: Seamless use in PowerPoint and Google Slides, ensuring accessibility for teams.
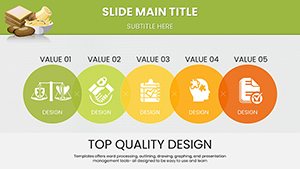
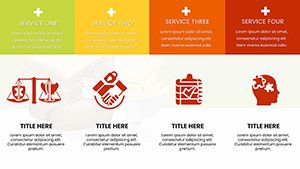
- Industry-Specific Graphics: Icons of fruits, grains, and proteins to enhance thematic consistency.
- Comprehensive Guide: Tips on best practices for data visualization in food contexts.
These elements draw from expert insights, like those in food science journals, to ensure your slides are both accurate and aesthetically pleasing.
Tailored Use Cases in the Food Sector
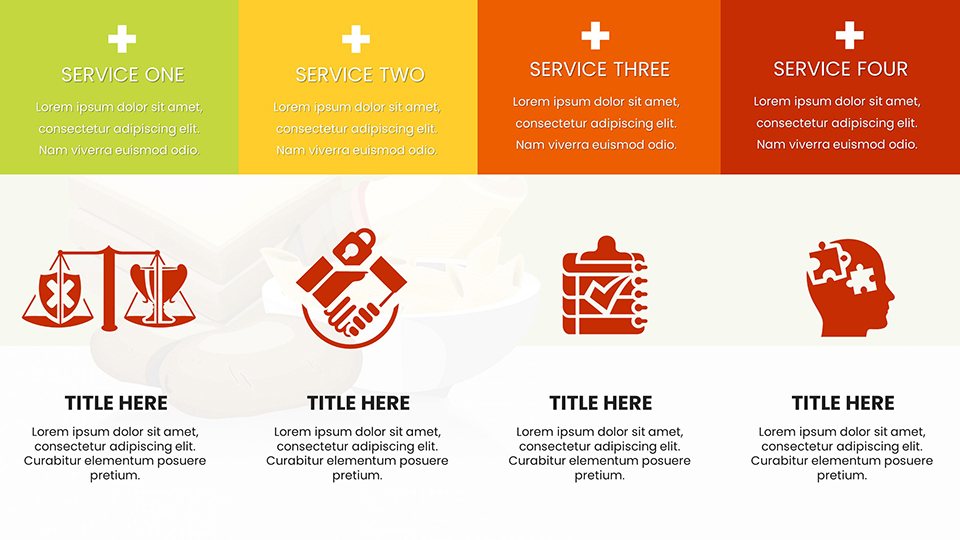
For a nutrition consultant, employ bubble charts to visualize portion sizes versus nutritional value, aiding client consultations. Food marketers might use stacked bars to layer product benefits, from taste to sustainability, in pitches to retailers.
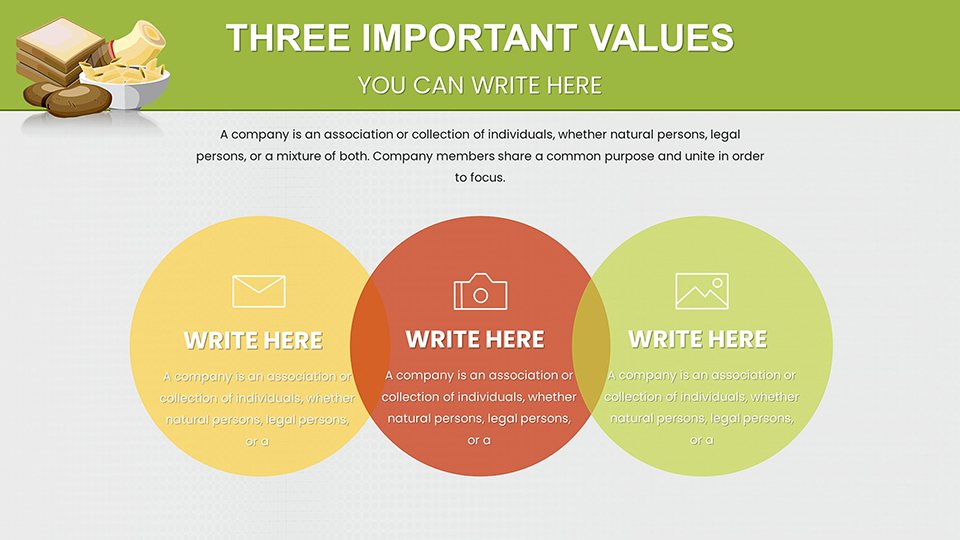
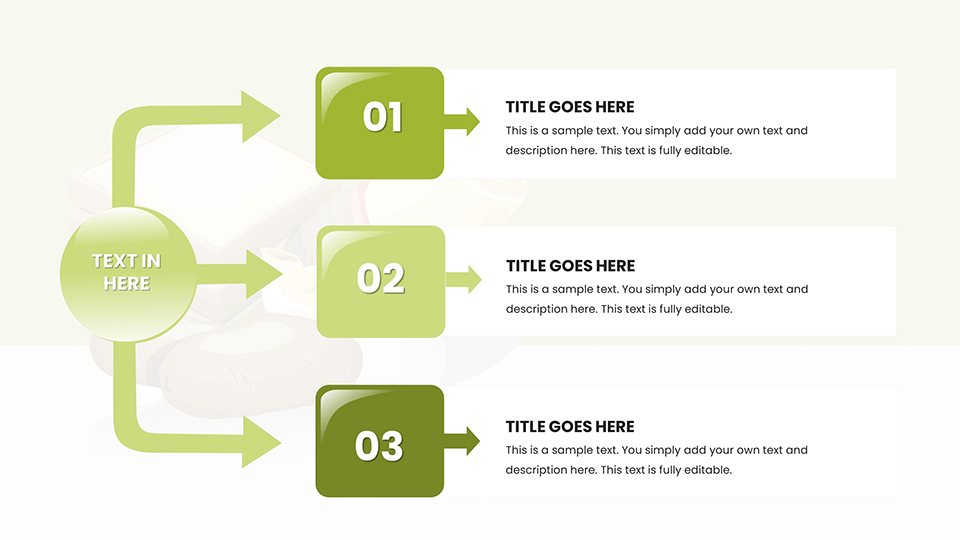
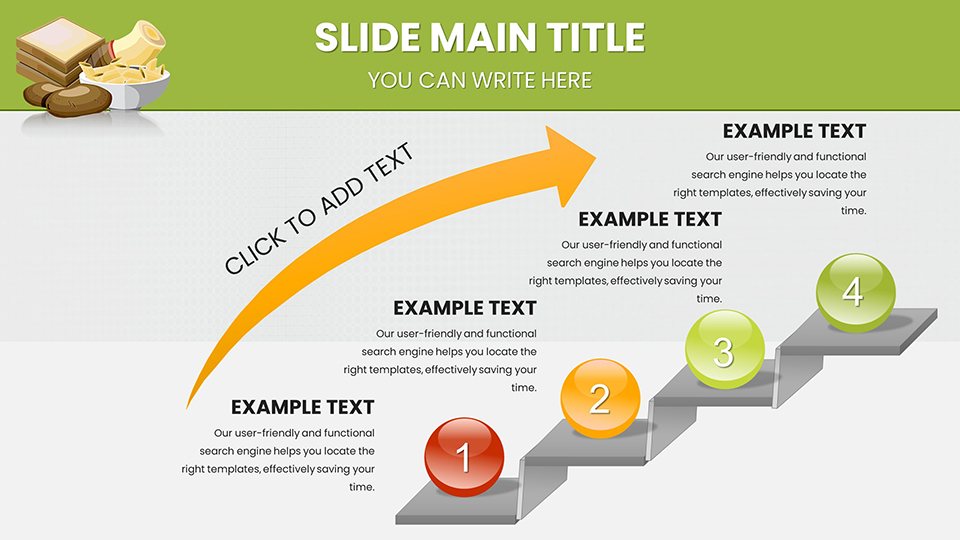
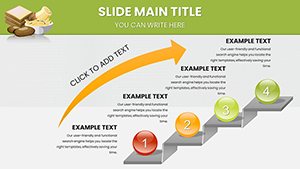
In academia, students present research on food allergies with Venn diagrams overlapping common allergens, fostering deeper discussions. Chefs can map menu development timelines, highlighting seasonal ingredient integrations for restaurant stakeholders.
Guided Workflow: Crafting a Nutrition Strategy Deck
- Begin with overview slides: Set the stage with themed titles like "Unlocking Food Nutrition Secrets."
- Input data into charts: Use pie slices for dietary breakdowns, customizing labels for clarity.
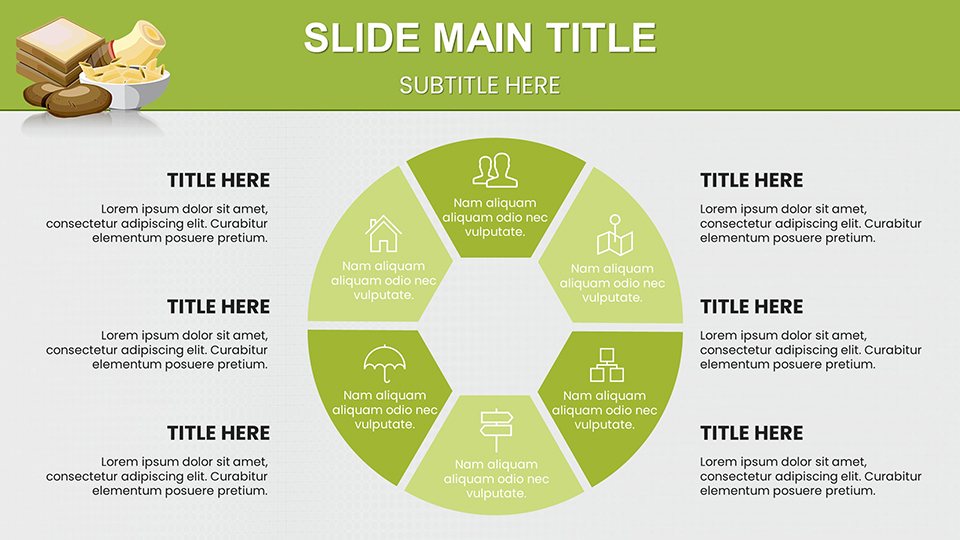
- Enhance with visuals: Add icons to represent food groups, making abstract concepts concrete.
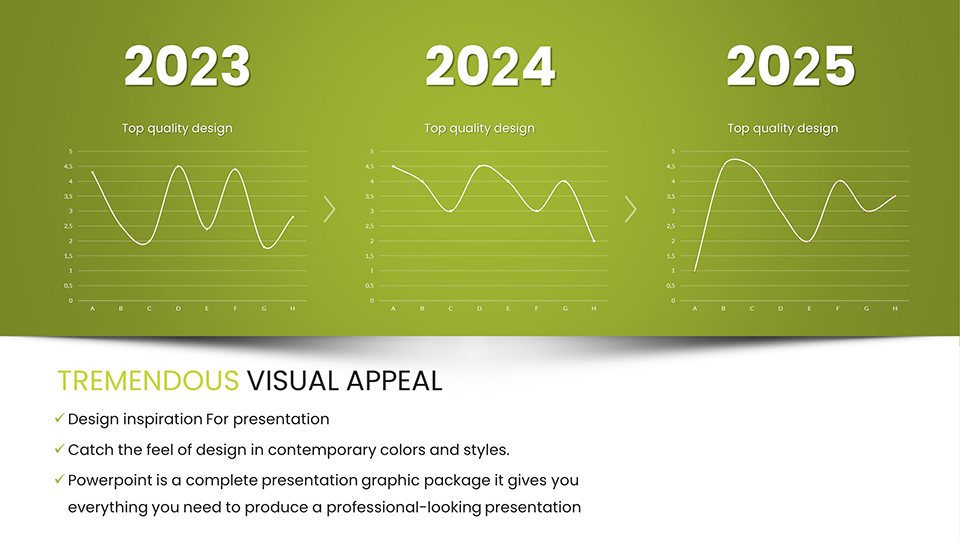
- Layer analyses: Incorporate line graphs for trend tracking, such as rising plant-based demands.
- Conclude strongly: Summarize insights and prompt next steps, like "Adopt these trends now."
This method mirrors successful campaigns from brands like Kellogg's, emphasizing data-driven storytelling.
Pro Tips to Flavor Your Presentations
Incorporate sensory language in your narratives - describe charts as "bursting with insights" to engage senses. For better UX, use animations sparingly to reveal data, avoiding overload. Versus standard PowerPoint, our template offers pre-harmonized designs, cutting creation time while boosting professionalism.
Integrate with tools like Excel for live data links, keeping your content fresh. For trustworthiness, cite sources within slides, aligning with principles.
The Superior Value of Specialized Food Charts
What sets this apart? Its niche focus ensures relevance, leading to higher engagement rates. Save effort on design, focus on content - ideal for busy pros. With versatile applications, it's an investment in your communication arsenal.
Ready to tantalize your audience? Secure your template and start creating mouthwatering presentations.
Frequently Asked Questions
- How flexible is the customization?
- Every chart and element can be edited to fit your specific needs, no restrictions.
- Does it work on Google Slides?
- Yes, fully compatible for collaborative editing.
- Suitable for educational use?
- Perfect for students and educators in food-related fields.
- Any support for beginners?
- Included guide covers basics to advanced tips.
- Free trial available?
- Download a demo to explore features firsthand.
- Can I add my own images?
- Absolutely, integrate personal photos or graphics easily.