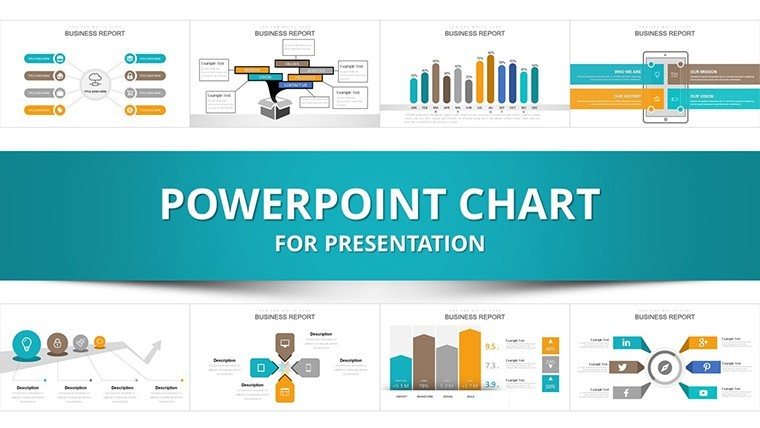
Productivity PowerPoint Chart Template: Enhance Finance Efficiency


Type: PowerPoint Charts template
Category: Analysis
Sources Available: .pptx
Product ID: PC00933
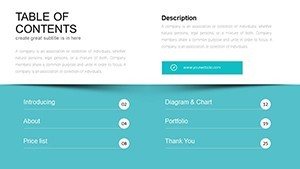
Template incl.: 30 editable slides
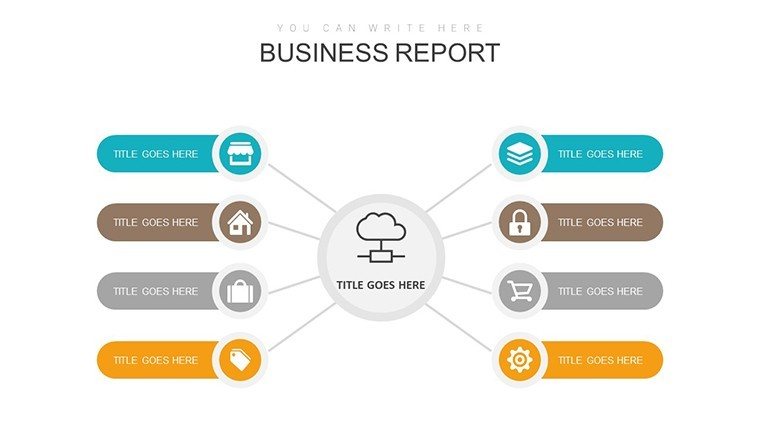
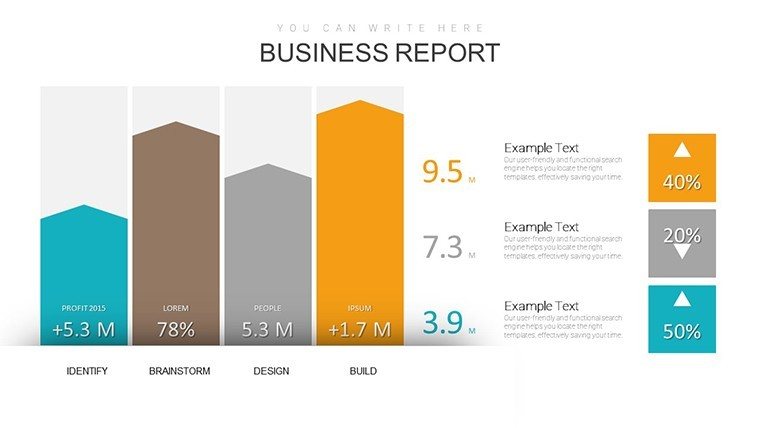
In finance, productivity isn't just about speed - it's about smart analysis and influence. Our Productivity PowerPoint Chart Template, with 30 editable slides, is tailored for finance professionals exploring relationships like dollar and gold dynamics. It helps prioritize systems, assess tools, and apply performance skills through visual charts. Whether studying market factors or presenting to teams, this template turns data into influential narratives, drawing from Finance Alliance's graph examples for best results.
Features Driving Financial Productivity
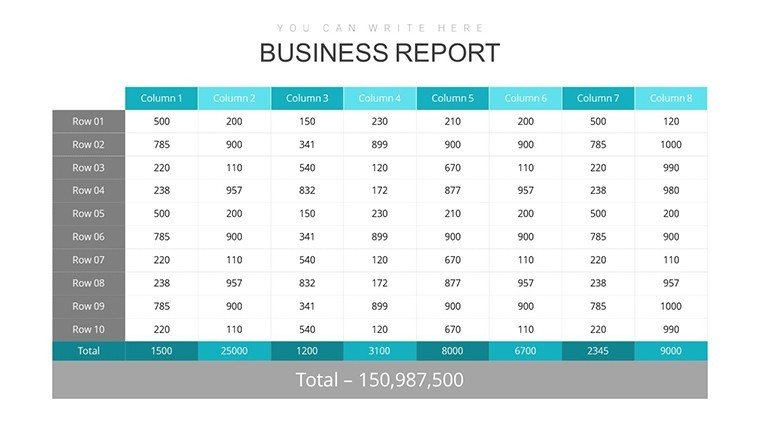
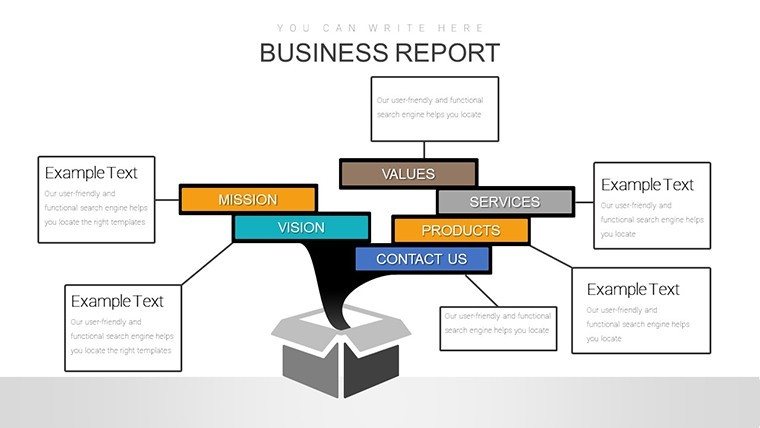
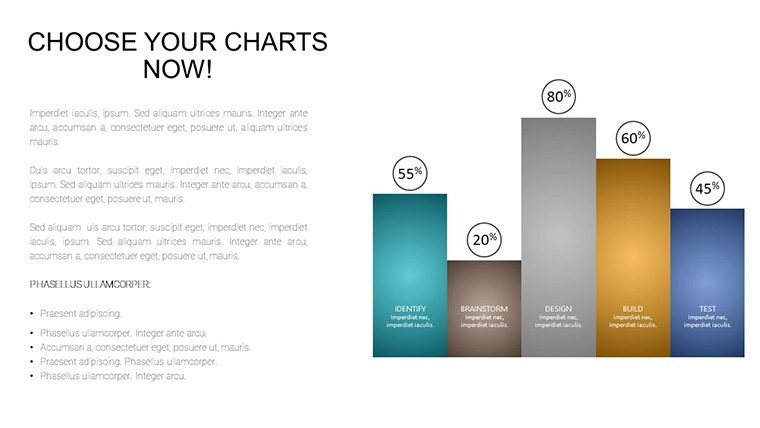
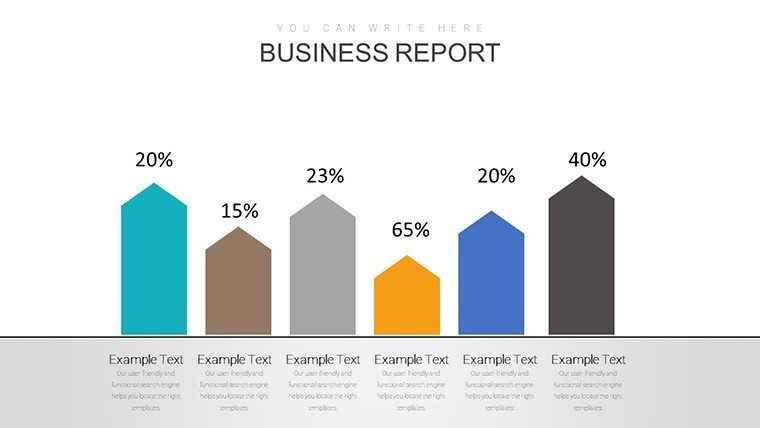
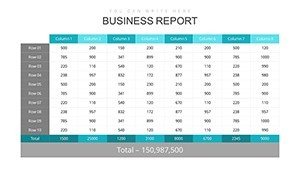
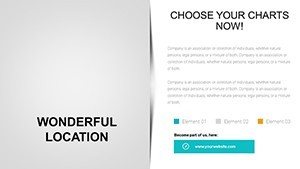
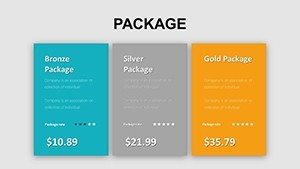
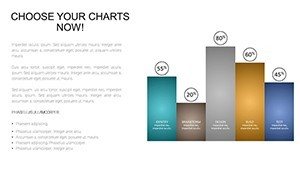
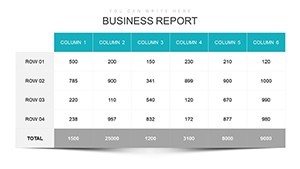
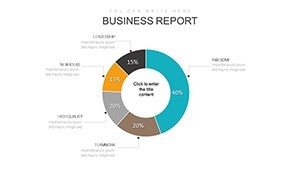
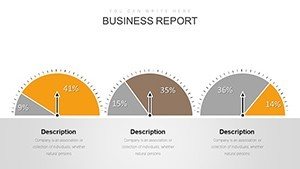
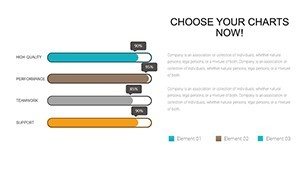
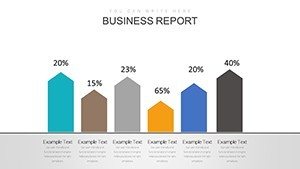
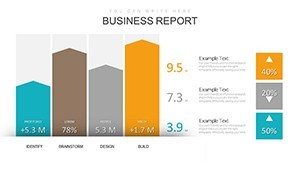
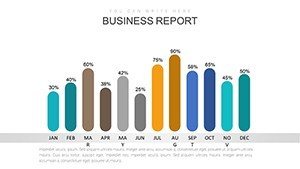
Core to this template are charts for productivity metrics, such as line graphs for trend analysis and bars for comparison. Customize colors, data, and layouts to fit your analysis, ensuring alignment with GAAP for credible outputs.
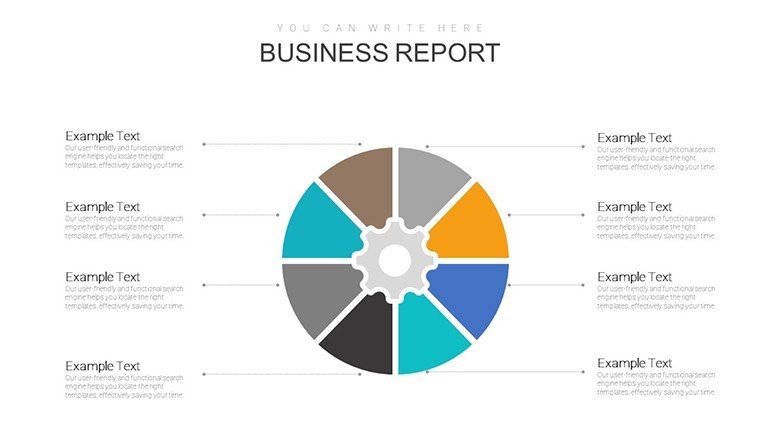
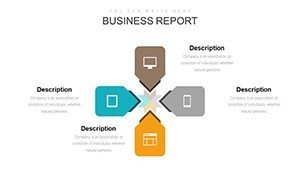
- Relationship Charts: Scatter plots for dollar-gold correlations.
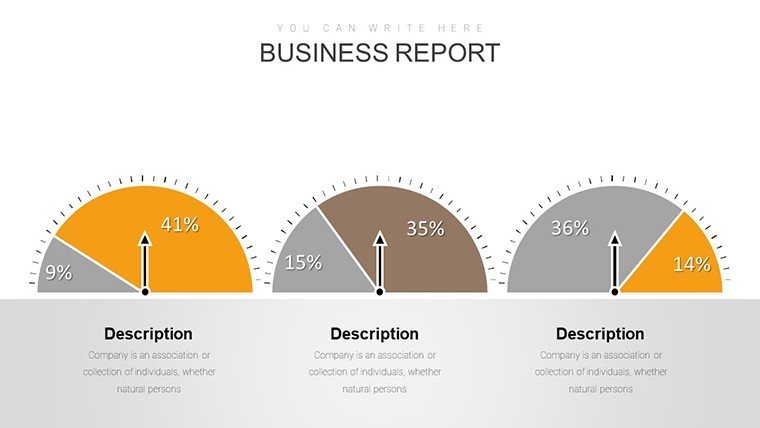
- Performance Metrics: Gauges tracking efficiency KPIs.
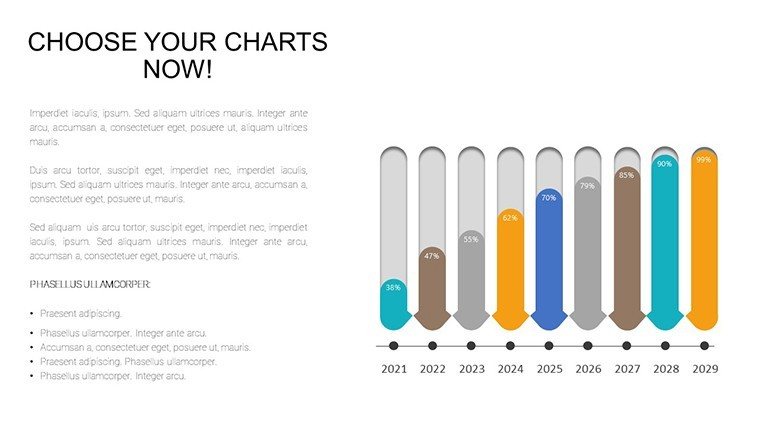
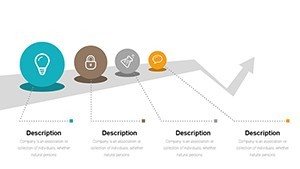
- Trend Visuals: Areas showing productivity over time.
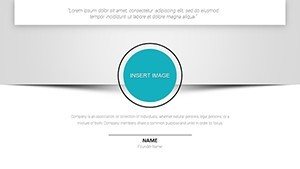
- Customization Tools: Easy edits for personalized insights.
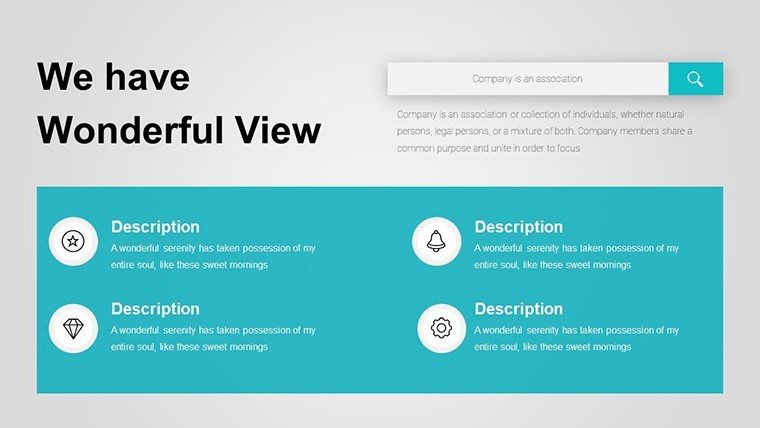
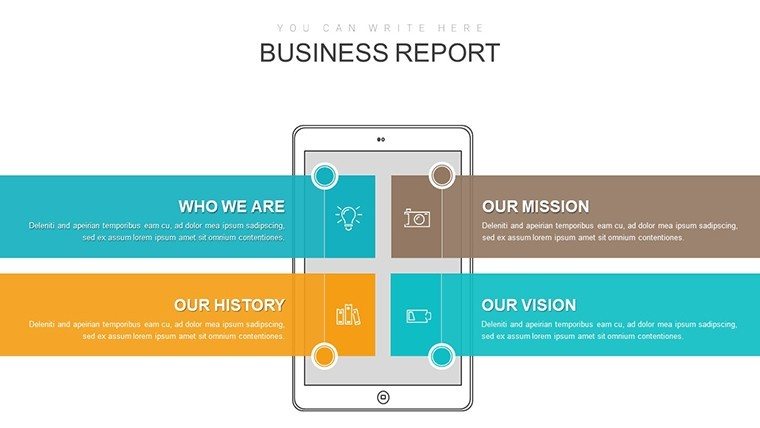
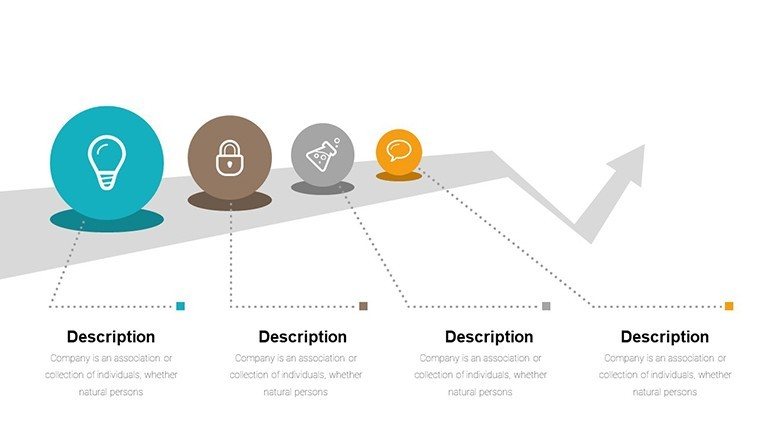
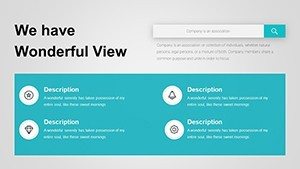
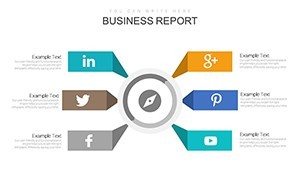
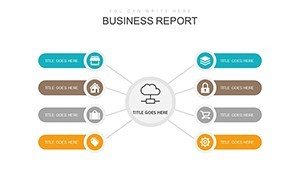
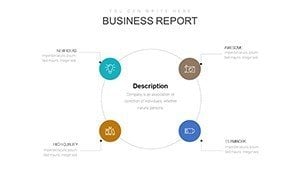
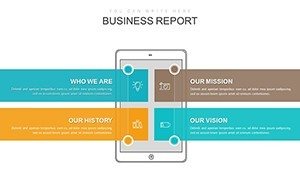
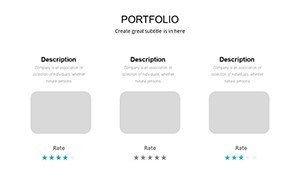
- Infographic Elements: Icons enhancing financial stories.
Use Cases in Finance and Beyond
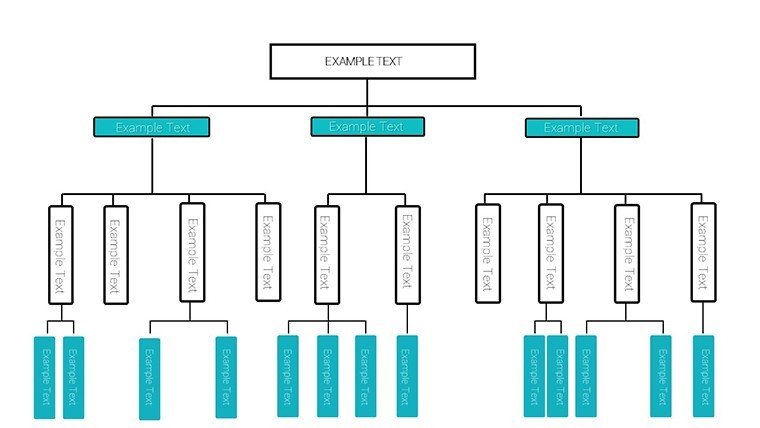
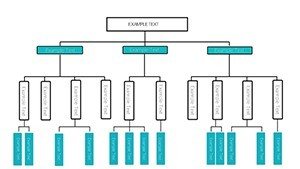
Finance pros use it to dissect market influences, like a case where charts revealed hedging strategies. For teams, it prioritizes tasks with Gantt-like slides.
Customization for Peak Performance
Input data, adjust visuals, add animations - integrate with tools for dynamic updates.
- Open and plan your productivity focus.
- Enter metrics into charts.
- Tailor designs to your needs.
- Collaborate and refine.
- Present with confidence.
Benefits for Superior Outcomes
Outperforms basics with pro visuals, as per SlideTeam's templates. Example: Improved team efficiency via clear charts.
Tackle overload with focused designs, boosting influence.
Expert Productivity Tips
Prioritize high-impact data, use consistent visuals. From Deck Sherpa, narrate for engagement.
Elevate your finance game with this template.
Frequently Asked Questions
What charts suit financial relationships?Scatter and line for correlations like dollar-gold.
Editable for productivity tracking?Yes, fully for custom metrics.
GAAP integration?Supports compliant data presentation.
For team collaborations?Ideal, with shareable formats.
Animation options?Included for dynamic reveals.
Compatible with Google Slides?Yes, for versatile use.
Optimize your productivity - download now and influence more.