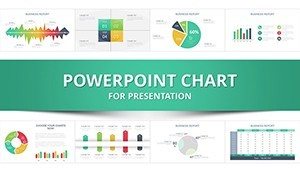
Financial Position PowerPoint Chart Template: Visualize Your Company's Health


Type: PowerPoint Charts template
Category: Analysis
Sources Available: .pptx
Product ID: PC00931
Template incl.: 32 editable slides
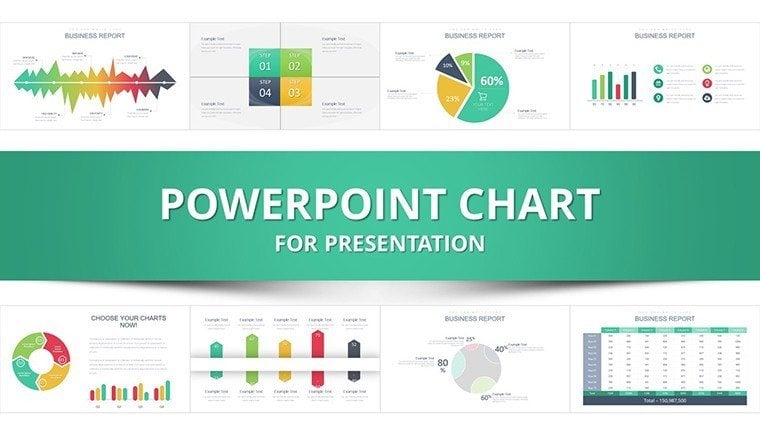
Understanding and communicating a company's financial position is crucial in today's competitive landscape. Our Financial Position PowerPoint Chart Template provides a robust solution with 32 editable slides dedicated to showcasing assets, liabilities, revenues, and more. Tailored for financial analysts, business owners, and executives, this template simplifies complex data into engaging visuals. Whether you're preparing for a board meeting or an investor update, it helps you highlight historical trends, benchmark comparisons, and performance metrics with precision. By incorporating GAAP standards, as referenced in PwC's comprehensive guides, you ensure accuracy and credibility in every slide.
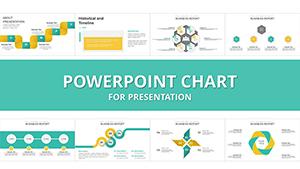
Essential Features for In-Depth Financial Analysis
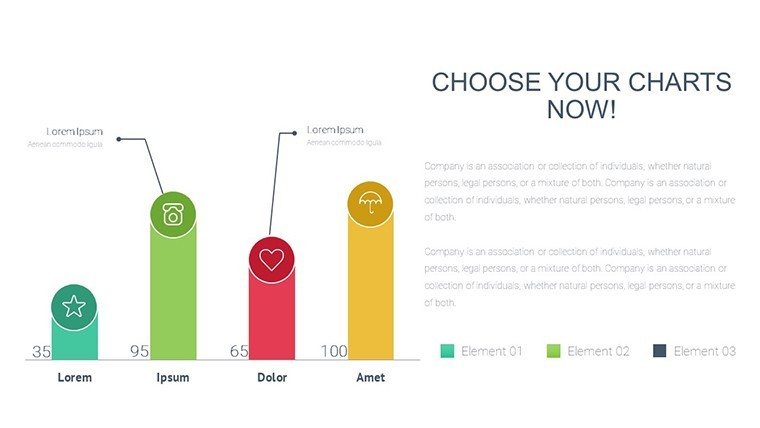
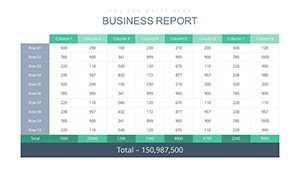
This template excels in turning raw financial data into actionable insights. Balance sheet charts clearly delineate assets and liabilities, while income statement visuals break down profits and costs. Financial flow charts track cash movements, and ratio charts evaluate liquidity and solvency. Customization is key - alter colors to align with corporate branding, edit data for real-time updates, and add slides for specific narratives. Unlike generic tools, this design follows best practices from KPMG's financial presentation handbook, prioritizing readability and impact.
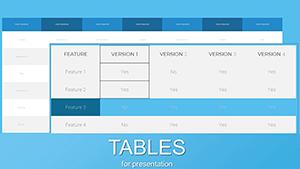
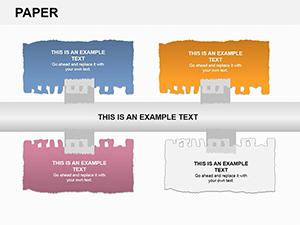
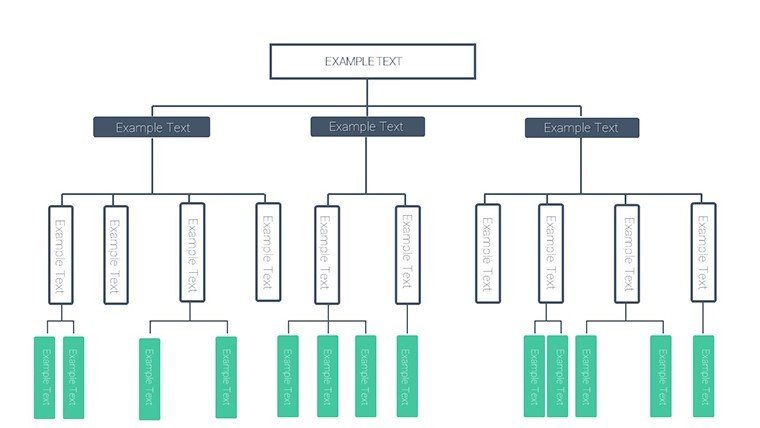
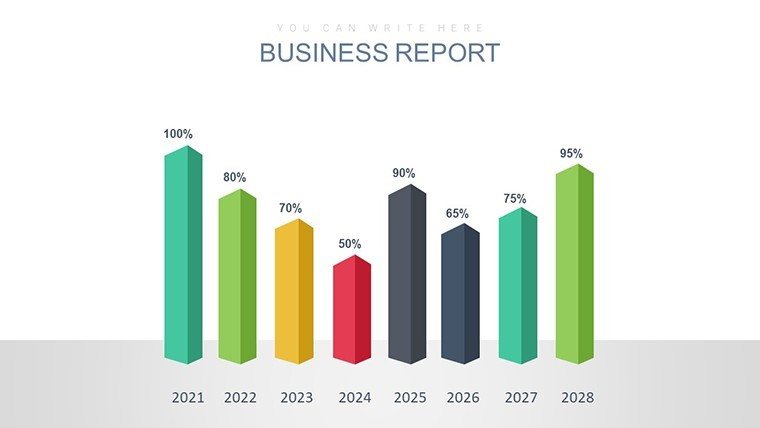
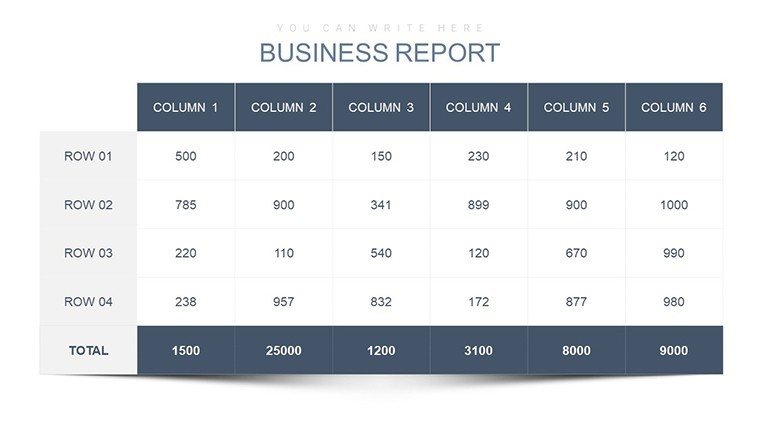
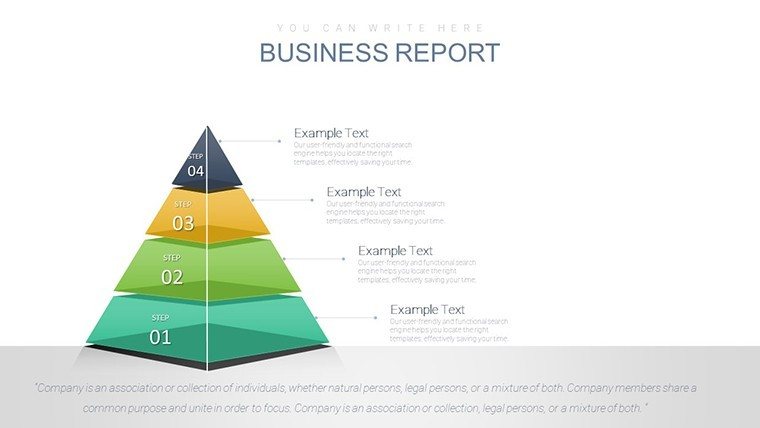
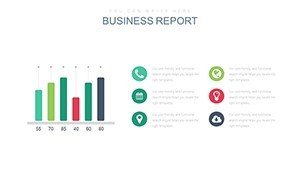
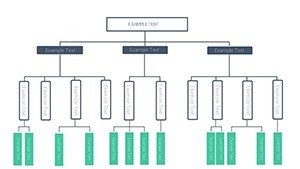
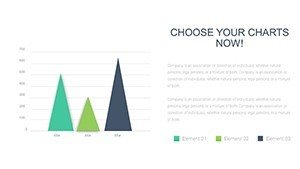
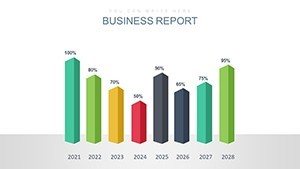
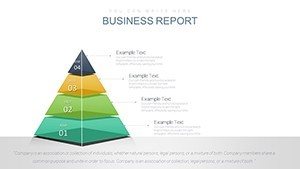
- Balance Sheet Charts: Illustrate equity structures with stacked bars, making it easy to spot financial stability.
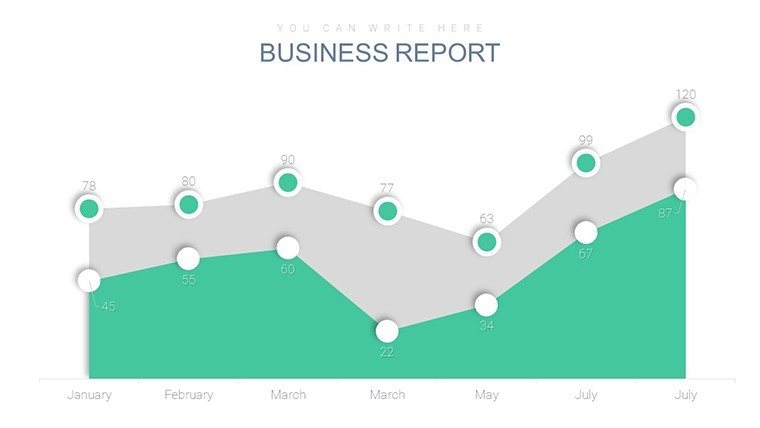
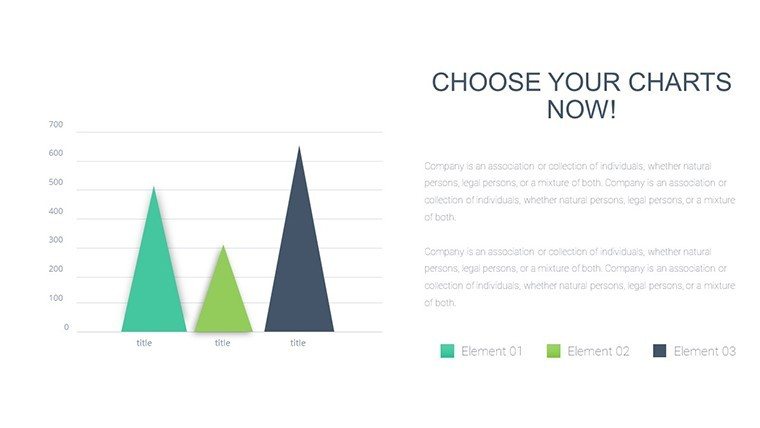
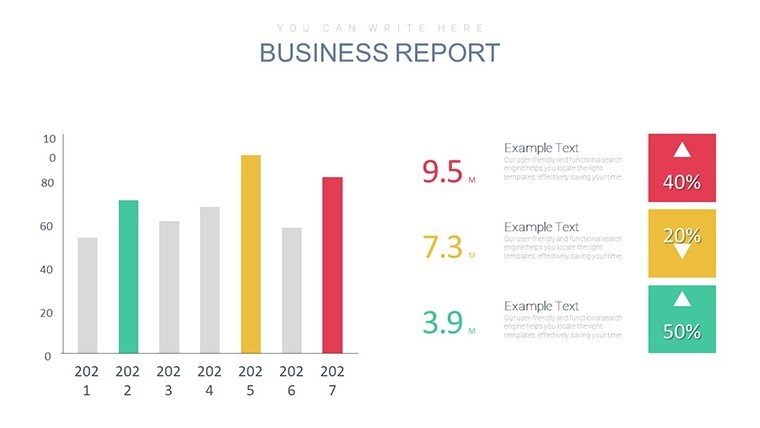
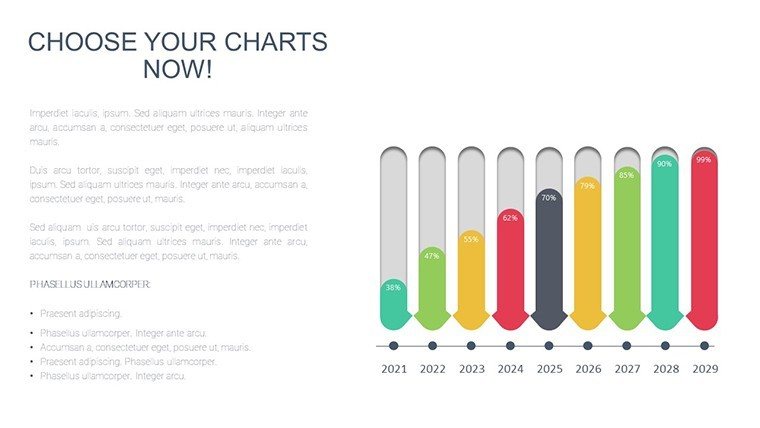
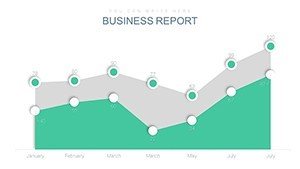
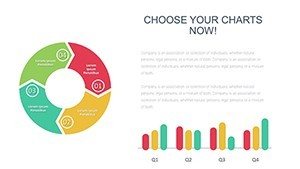
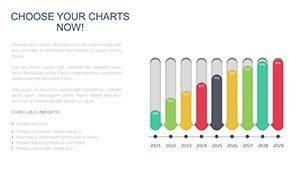
- Income Statement Charts: Use line graphs to show revenue trends, aiding in profitability discussions.
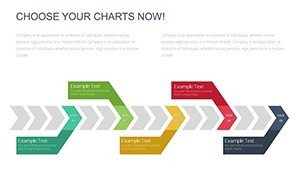
- Financial Flow Charts: Waterfall diagrams reveal cash inflows and outflows for transparent reporting.
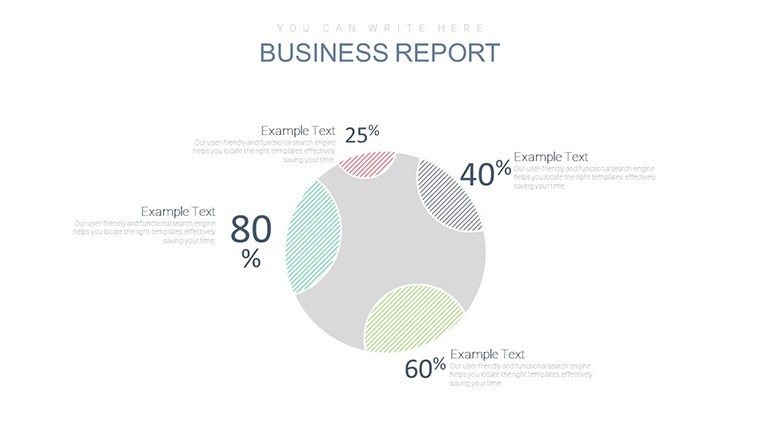
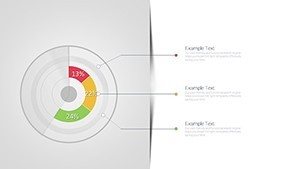
- Ratio Charts: Gauge metrics like debt-to-equity with gauges or radars, supporting strategic decisions.
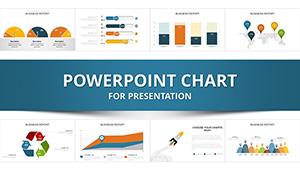
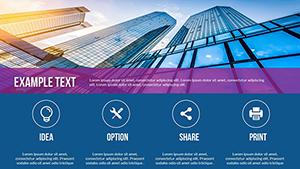
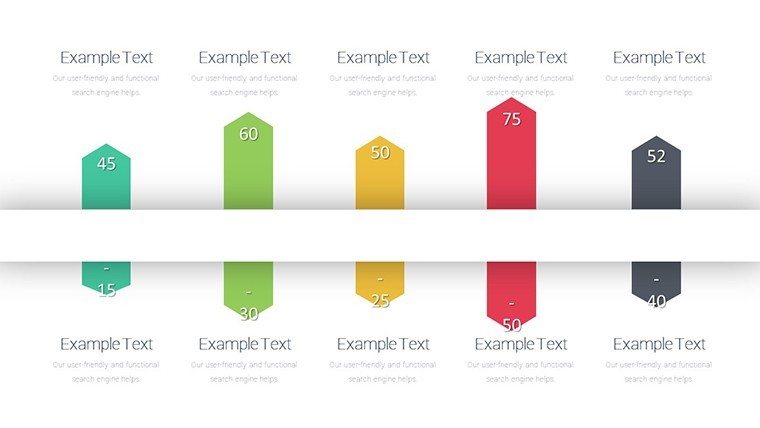
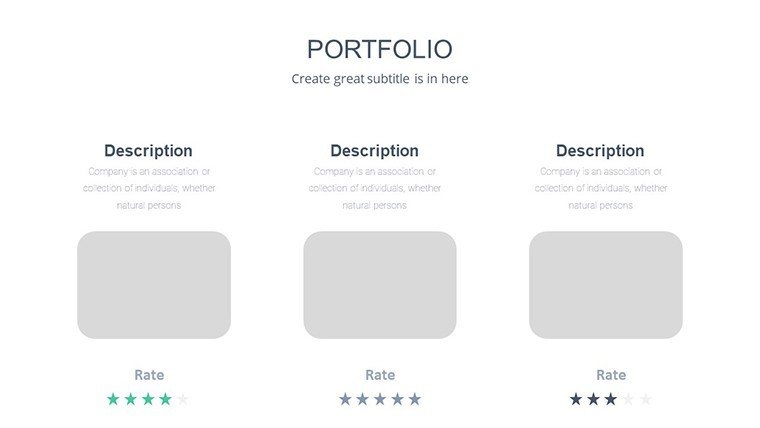
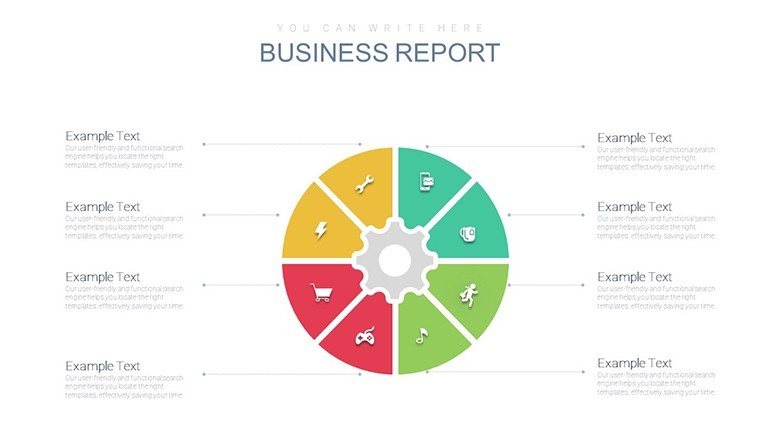
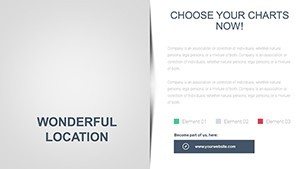
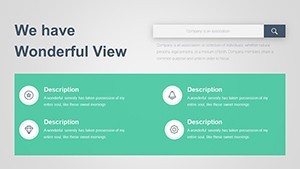
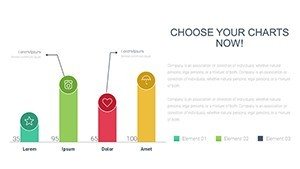
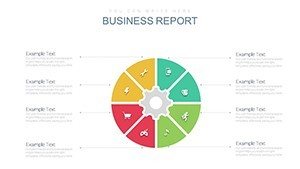
- High-Quality Infographics: Professional visuals that enhance comprehension without overwhelming details.
Practical Use Cases in Financial Reporting
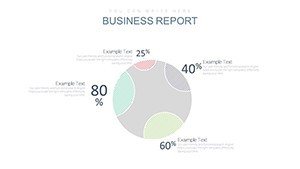
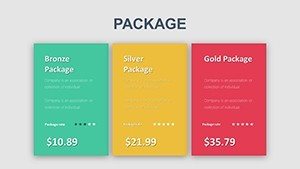
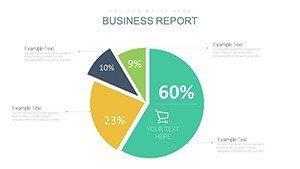
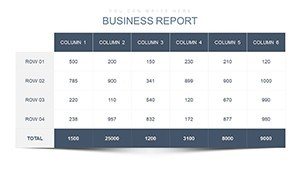
For financial analysts, this template is invaluable in quarterly reviews. Start with an overview slide summarizing key positions, then dive into comparative analysis charts showing year-over-year changes. A case study from a mid-sized firm, as seen in financial statement presentation resources, demonstrates how such visuals clarified merger viability, leading to informed board approvals. Business owners can use it for investor pitches, employing pie charts to allocate resources effectively. In educational settings, it serves as a teaching aid, breaking down GAAP-compliant statements for students.
Customizing for Your Unique Financial Narrative
Begin by importing your data from Excel into the placeholders - watch as charts update automatically. Adjust fonts for a formal tone or add animations to emphasize shifts in financial positions. For deeper dives, include trend analysis slides with area charts projecting future solvency. This method not only saves time but aligns with standards from Vintti's guide on financial structures, ensuring compliance and clarity.
- Download and open the template in PowerPoint.
- Enter your financial data into designated charts.
- Modify visuals to fit your branding and audience.
- Incorporate additional elements like notes or icons.
- Review for accuracy and rehearse delivery.
Integrate this into your workflow by linking to live data sources, enabling dynamic updates during presentations. Collaborate via shared platforms, refining charts based on team input for cohesive reports.
Advantages Over Standard PowerPoint Tools
Standard slides often fall flat with cluttered data, but our template's polished designs elevate your message. Benefits include time savings - pre-built charts mean no starting from scratch - and enhanced audience retention through visual storytelling. Drawing from Deck Sherpa's best practices, we incorporate strong data visualizations like heat maps for risk assessment. A real-world example: A startup used these charts to present financial positions, securing funding by clearly showing growth potential.
Further, the template addresses solvency concerns with dedicated slides for ratio breakdowns, helping users spot issues early. Short, focused paragraphs ensure quick scans, while bold elements highlight critical figures. For productivity, batch edit multiple charts, streamlining preparation for high-stakes meetings.
Pro Tips for Compelling Financial Presentations
Focus on your story: Use charts to support, not dominate, your narrative. Employ consistent scales across comparisons to avoid misleading interpretations. From Visme's guide, add emotional hooks like success projections to engage investors. Limit text to essentials, letting visuals speak. Practice syncing explanations with slide transitions for fluid delivery.
With this template, your financial positions become powerful tools for decision-making, fostering trust and driving action.
Frequently Asked Questions
What types of charts are included?Balance sheets, income statements, cash flows, and ratios, all fully editable.
Does it support GAAP compliance?Yes, designs align with GAAP for accurate financial representation.
Can I add my own data easily?Absolutely, placeholders make data entry straightforward and updates instant.
Is it suitable for investor pitches?Perfect for pitches, with visuals that clearly communicate financial health.
How many slides can I customize?All 32 slides are editable, with options to add or remove as needed.
Compatible with other software?Works seamlessly in PowerPoint and can be imported to Google Slides.
Transform your financial insights today - download and start presenting with confidence.