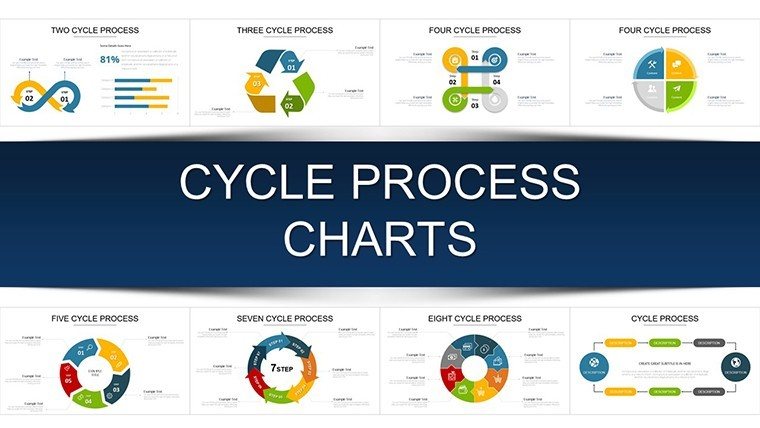
Cycle Process PowerPoint Charts Template: Visualize Your Workflows Effortlessly


Type: PowerPoint Charts template
Category: Cycle
Sources Available: .pptx
Product ID: PC00922
Template incl.: 20 editable slides
In the fast-paced world of business and project management, conveying complex processes clearly is key to success. Imagine transforming intricate workflows into engaging, easy-to-follow visuals that not only inform but inspire your team or clients. Our Cycle Process PowerPoint Charts Template does just that, offering 20 fully editable slides designed specifically for professionals like project managers, business analysts, and consultants who need to showcase recurring cycles, progress stages, and operational flows. Whether you're mapping out a product development lifecycle or illustrating supply chain dynamics, this template empowers you to create presentations that resonate, drawing on proven design principles to enhance comprehension and retention.
What sets this template apart is its focus on cyclical narratives - think endless loops of improvement, feedback, and iteration that drive real-world results. Drawing from methodologies like Lean and Agile, these charts help you demonstrate how processes evolve over time, making abstract concepts tangible. For instance, in a manufacturing context, you could use a multi-stage cycle chart to highlight quality control loops, ensuring stakeholders grasp the iterative nature of production. This isn't just about pretty pictures; it's about solving pain points like miscommunication in team meetings or vague strategy sessions, turning them into opportunities for clarity and collaboration.
Key Features That Make Customization a Breeze
At the heart of this template are its versatile design elements, crafted with user-friendliness in mind. Each of the 20 slides comes in .pptx format, compatible with Microsoft PowerPoint on both Windows and macOS, allowing seamless integration into your existing workflow. No advanced design skills required - just open, edit, and present. Key features include:
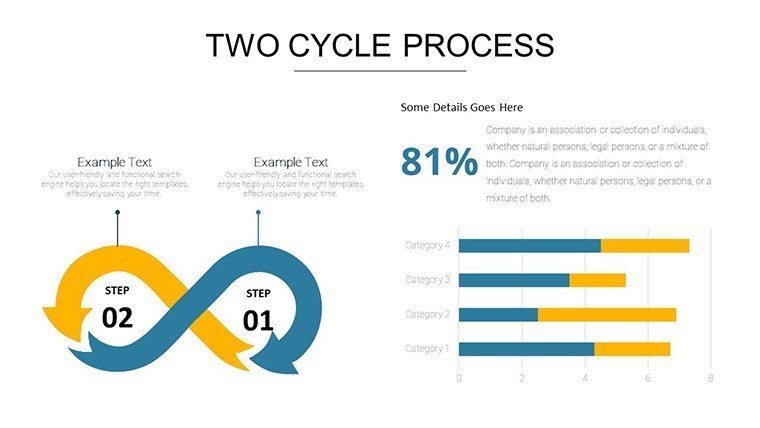
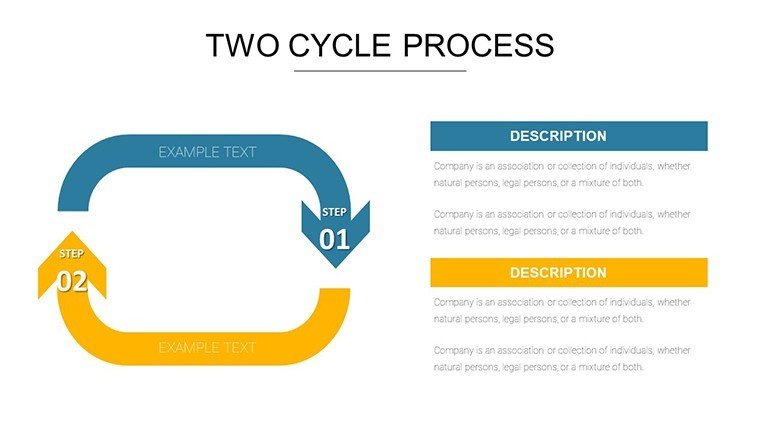
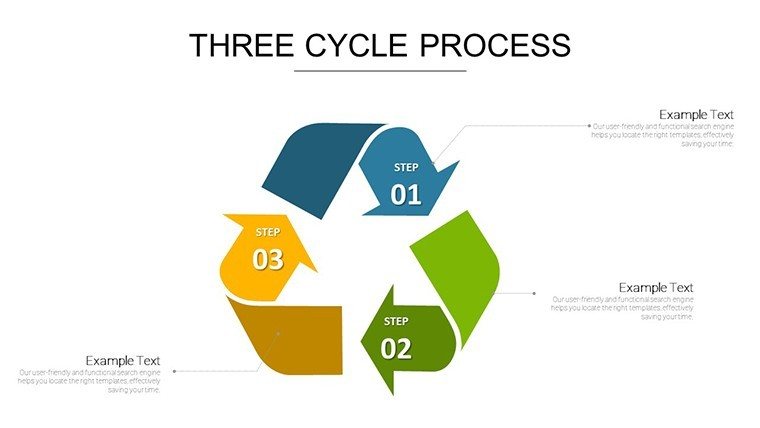
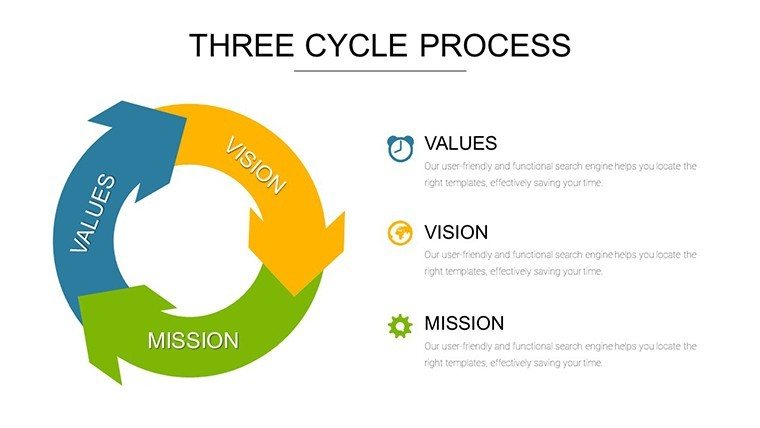
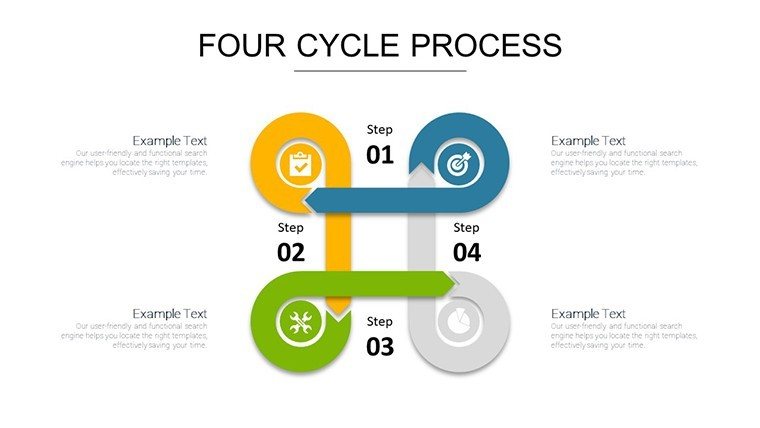
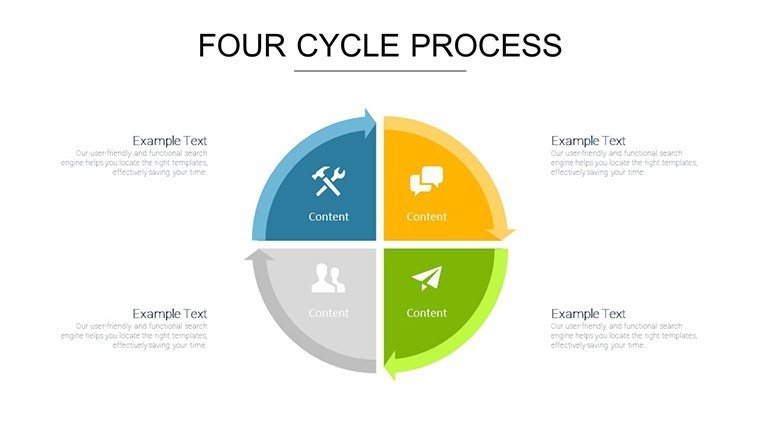
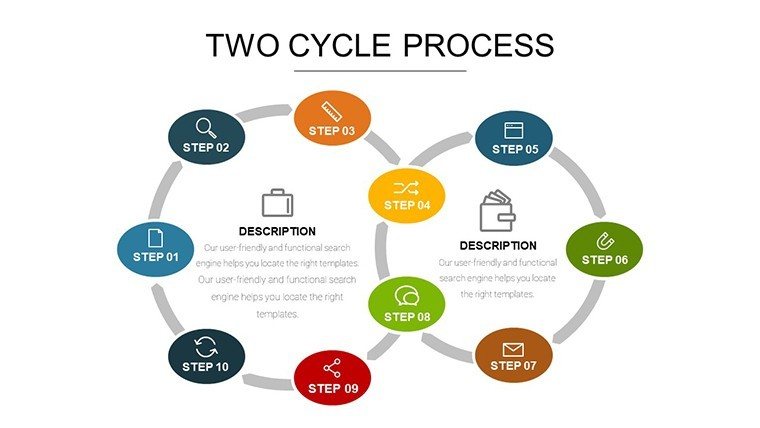
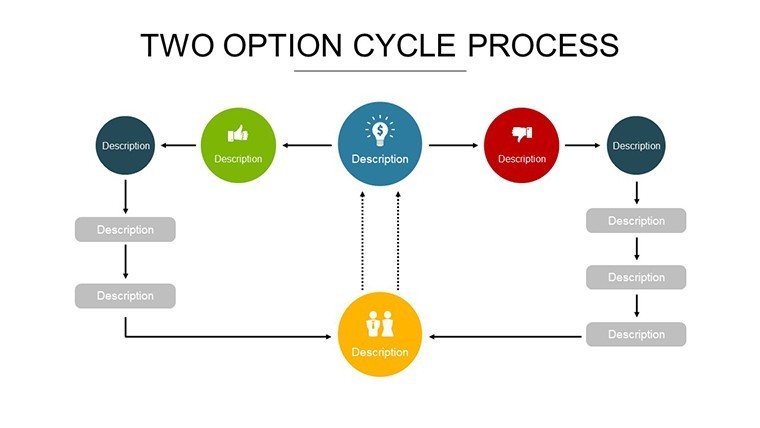
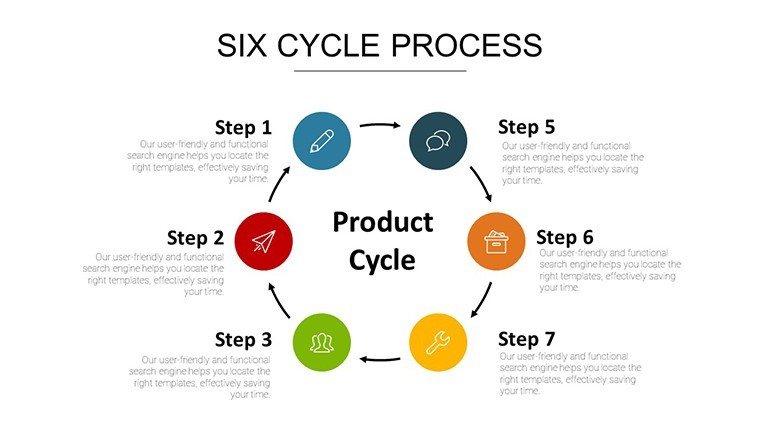
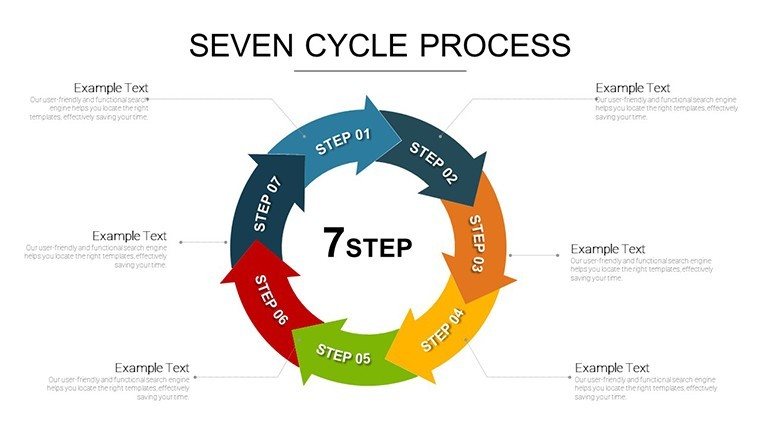
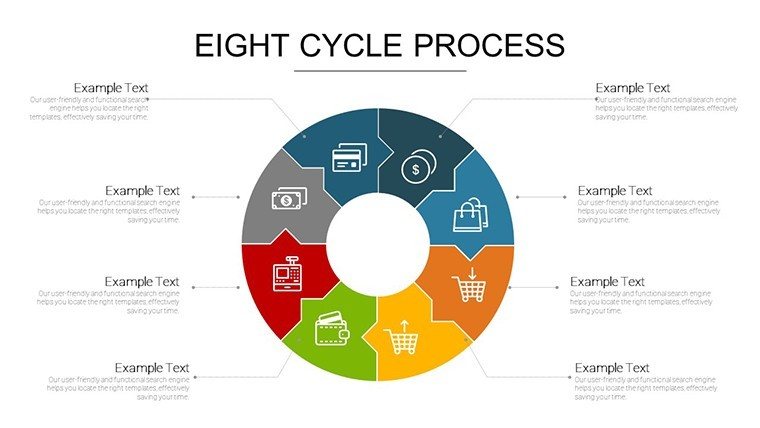
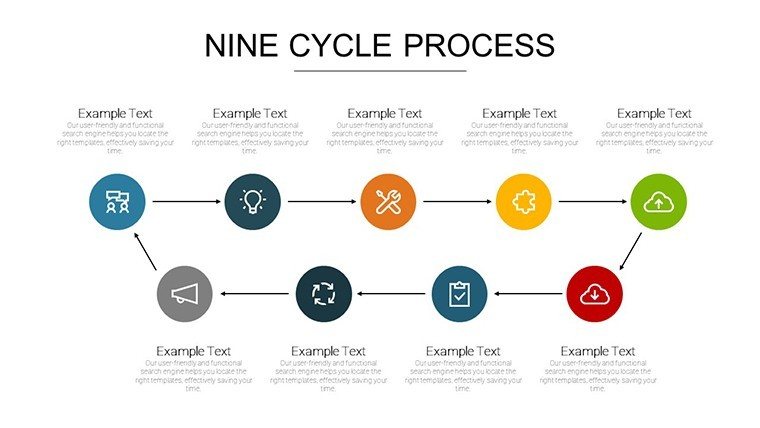
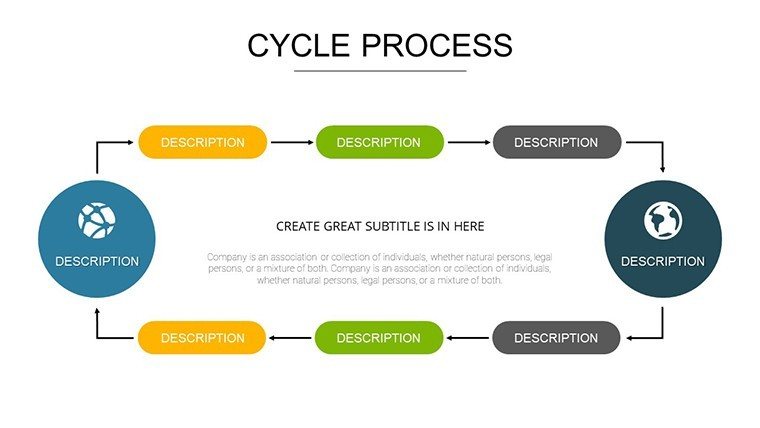
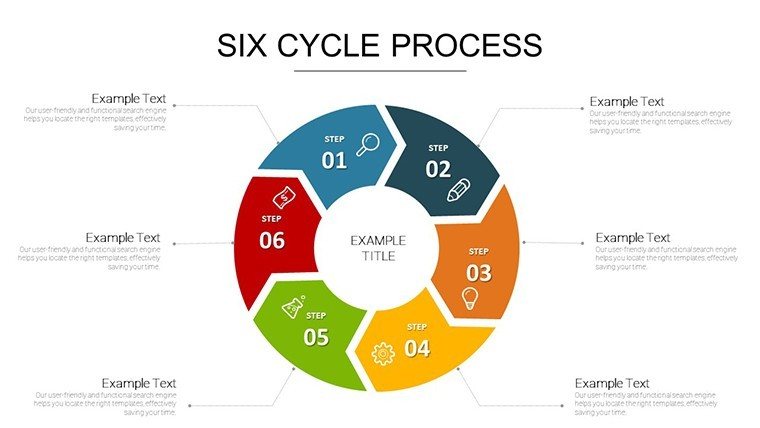
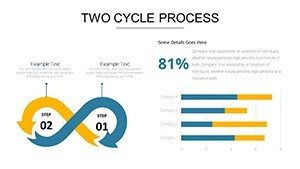
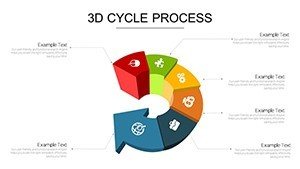
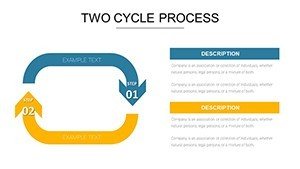
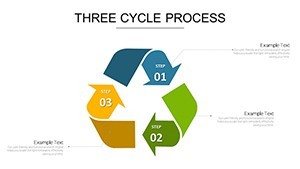
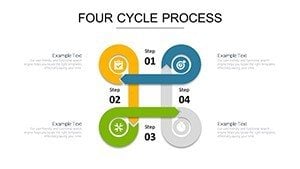
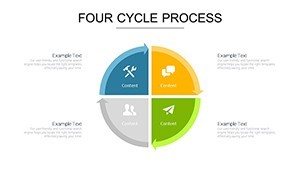
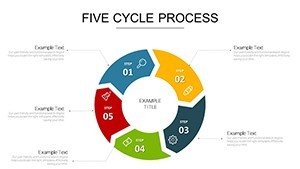
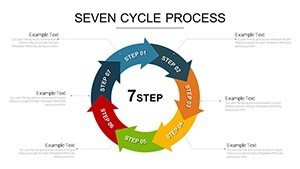
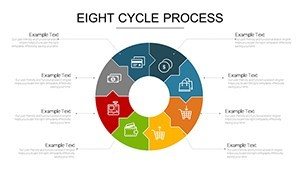
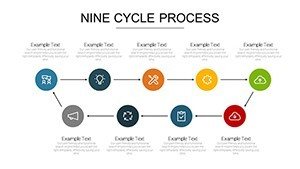
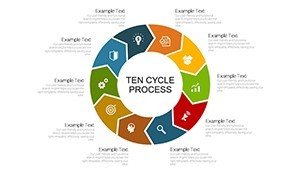
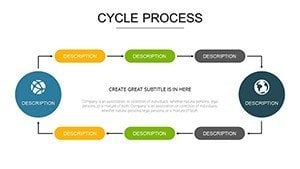
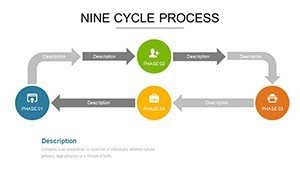
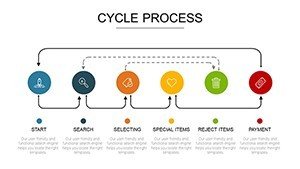
- Dynamic Cycle Diagrams: From simple three-step loops to intricate multi-layered processes, these charts adapt to your data, with placeholders for text, icons, and colors that align with your brand.
- Editable Graphics: Resize, recolor, or rearrange elements effortlessly. Add animations to simulate process flow, making your presentation interactive without extra tools.
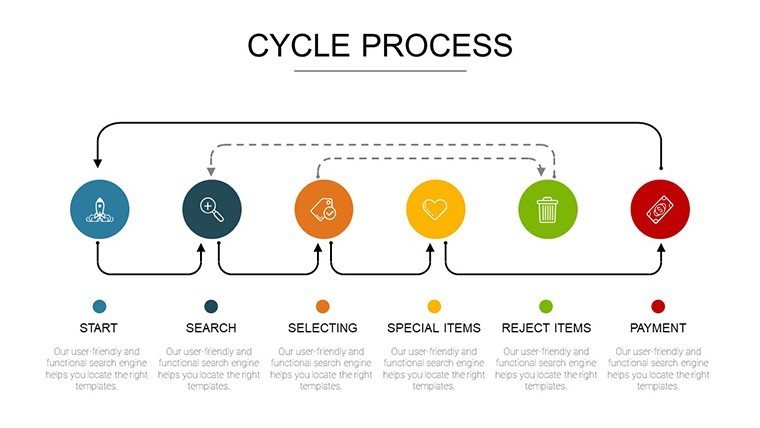
- Themed Icons and Shapes: A library of professional icons representing steps like 'initiate,' 'execute,' and 'review,' enhancing visual appeal and reducing text clutter.
- Data Integration: Easily import metrics from Excel to populate charts, ensuring accuracy in depicting progress or performance metrics.
- High-Resolution Quality: Vector-based designs that scale perfectly for any screen size, from boardroom projectors to virtual meetings.
These features aren't arbitrary; they're informed by best practices from design experts like Edward Tufte, who emphasized data integrity in visualizations. By incorporating such elements, you avoid common pitfalls like overcrowded slides, instead delivering polished, professional outputs that reflect your expertise.
Real-World Applications: From Strategy to Execution
Let's dive into how this template shines in practical scenarios. Consider a project manager at a tech firm preparing a quarterly review. Using the cycle charts, they map out the software development lifecycle - from ideation to deployment and back to iteration - highlighting bottlenecks with color-coded segments. This not only clarifies timelines but also fosters discussion on improvements, leading to more efficient cycles in future projects.
In education, instructors can adapt these slides to teach business concepts, such as the Deming Cycle (Plan-Do-Check-Act), making lessons interactive and memorable. For consultants, presenting client audits becomes straightforward: illustrate feedback loops in service delivery, backed by data points that demonstrate ROI. One real-world example comes from a case study in Harvard Business Review, where visual process mapping reduced project delays by 25% in a logistics company - imagine achieving similar gains with this tool at your disposal.
Beyond these, the template excels in marketing strategies, where you might depict customer journey cycles, from awareness to loyalty. Each slide encourages storytelling: start with an overview cycle, then zoom into details with sub-charts. This layered approach keeps audiences engaged, preventing the monotony of linear slides. Plus, with built-in transitions, your presentation flows as smoothly as the processes you describe.
Step-by-Step Guide to Maximizing Your Template
- Download and Open: Secure your template instantly and launch it in PowerPoint for immediate access.
- Assess Your Needs: Identify the cycle type - simple loop for basic workflows or complex for multifaceted operations.
- Input Data: Populate placeholders with your specifics, adjusting fonts and colors for consistency.
- Add Interactivity: Incorporate hyperlinks or animations to make cycles clickable, enhancing engagement in virtual settings.
- Review and Refine: Test the flow, ensuring logical progression that mirrors real processes.
- Present with Confidence: Deliver a narrative that not only informs but persuades, backed by visuals that stick.
This methodical use ensures you leverage the template's full potential, turning routine updates into compelling narratives. Compared to basic PowerPoint tools, which often result in static, uninspiring charts, this template offers pre-built sophistication, saving hours of design time while elevating your professional image.
Why This Template Outshines Standard Options
Standard PowerPoint charts can feel rigid and generic, but our Cycle Process Template introduces flexibility and flair. Unlike built-in shapes that require manual alignment, these are pre-optimized for balance and aesthetics, adhering to AIA-inspired design standards for clarity in complex diagrams - think architectural blueprints adapted for business. Benefits extend to time savings: professionals report cutting preparation time by half, allowing focus on content over cosmetics.
Moreover, it promotes trustworthiness through accurate representations. In fields like healthcare, where process cycles involve patient care loops, precise visuals can prevent errors, as noted in studies from the Joint Commission. For business analysts, integrating LSI terms like 'iterative workflows' or 'feedback mechanisms' naturally boosts SEO if shared online, while internal links to related templates on our site encourage further exploration.
Enhance UX with thumbnail previews in your deck, and sprinkle CTAs like "Explore this cycle in action" to guide viewers. The result? Presentations that not only meet but exceed expectations, fostering better decision-making and team alignment.
Elevate Your Processes Today
Ready to cycle through success? This template isn't just a tool - it's a catalyst for clearer communication and smarter strategies. Customize it to fit your unique needs and watch your presentations transform. Don't settle for linear thinking; embrace the power of cycles. Secure your copy now and start visualizing victory.
Frequently Asked Questions
- How customizable are the cycle charts?
- Fully editable - change colors, text, shapes, and add animations to match your brand or data needs.
- Is this compatible with Google Slides?
- While optimized for PowerPoint, you can import .pptx files into Google Slides with minor adjustments for full functionality.
- What industries benefit most?
- Ideal for business, education, consulting, and manufacturing, where process visualization drives efficiency.
- Can I use these for virtual presentations?
- Yes, high-resolution designs and animations work seamlessly in tools like Zoom or Teams.
- Are there tutorials included?
- Basic guides are embedded, but our support team offers tips for advanced customizations.
- How does this differ from free templates?
- Professional-grade designs with unique icons and data integration, ensuring polished, error-free results.