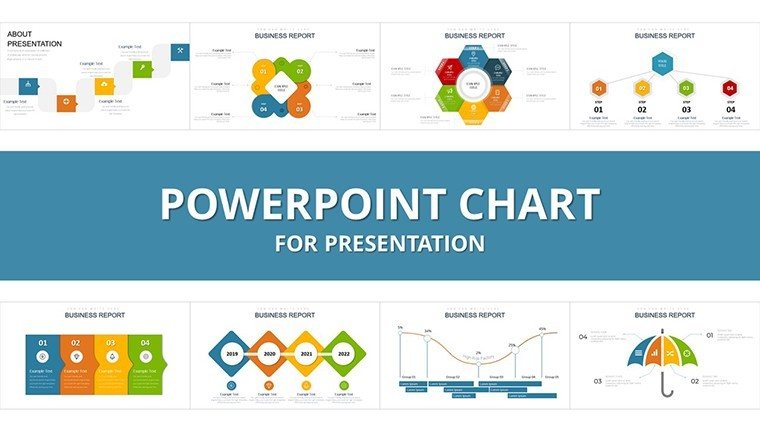
Propel Finance PowerPoint Charts Template: Drive Financial Insights Forward


Type: PowerPoint Charts template
Category: Analysis
Sources Available: .pptx
Product ID: PC00920
Template incl.: 34 editable slides
In the dynamic world of finance, presenting data that propels decisions is key. The Propel Finance PowerPoint Charts Template steps in as your accelerator, offering 34 editable slides dedicated to showcasing financial performance with flair. From revenue trajectories to investment portfolios, this tool turns numbers into narratives that engage stakeholders. Envision a board meeting where graphs illuminate profitability trends, sparking strategic dialogues. Designed for analysts, investors, and executives, it tackles the challenge of dense financial info by providing intuitive diagrams and charts. Rooted in economic principles, it helps highlight risks and opportunities, like fluctuating interest rates impacting debt. With .pptx compatibility, customization is a breeze - tweak to fit your firm's aesthetic. This isn't just a template; it's a catalyst for clearer communication, backed by visuals that adhere to standards from bodies like the CFA Institute. Uncover its potential to elevate your financial presentations and foster informed actions.
Standout Features for Financial Excellence
This template's strength lies in its robust, user-centric design, informed by financial modeling best practices.
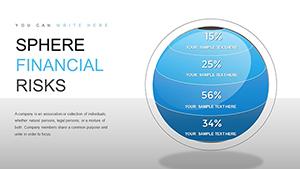
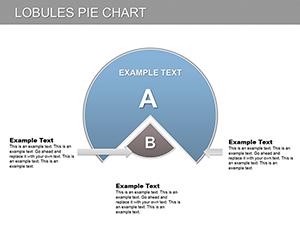
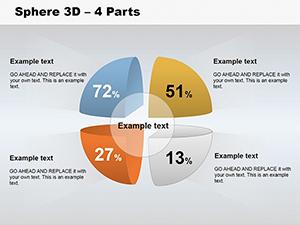
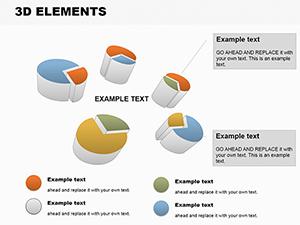
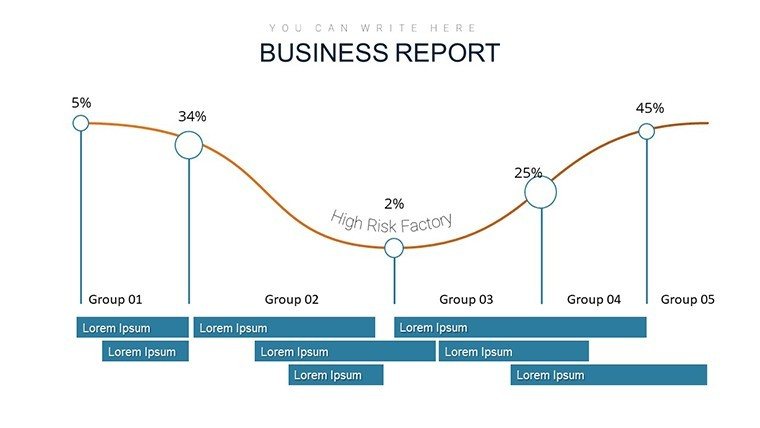
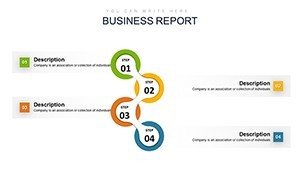
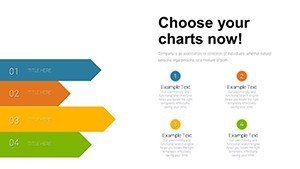
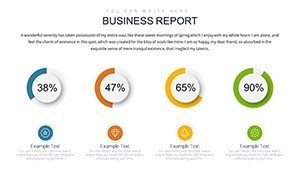
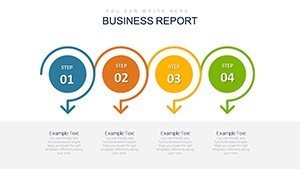
- Comprehensive Charts: Includes bar, line, and pie options for metrics like net income and expenses.
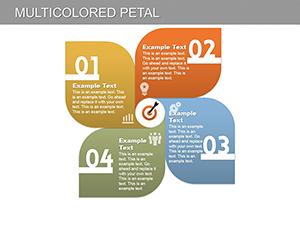
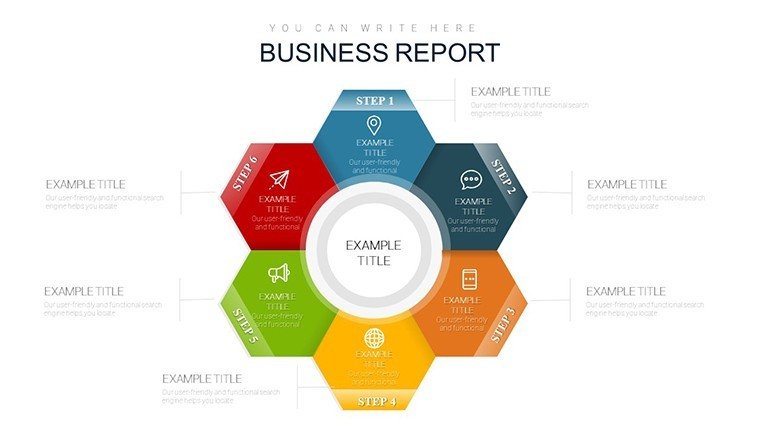
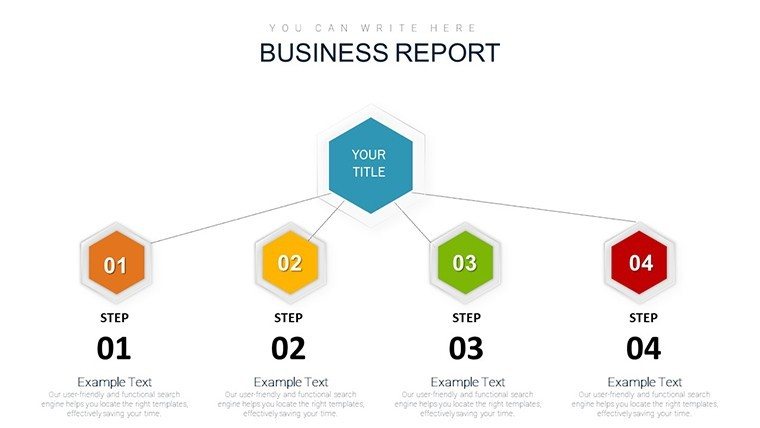
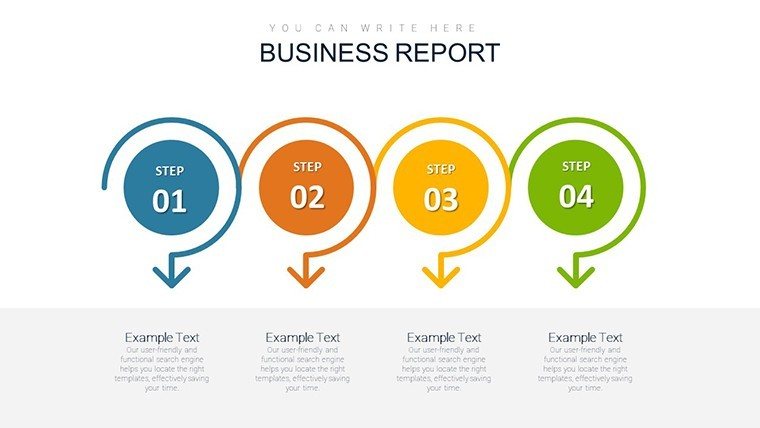
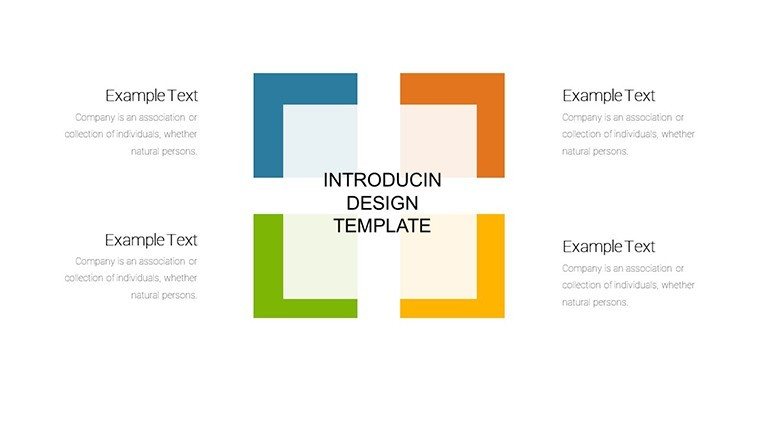
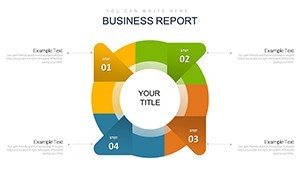
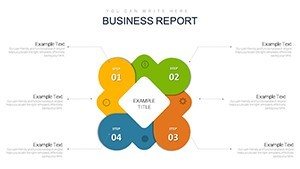
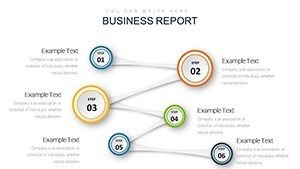
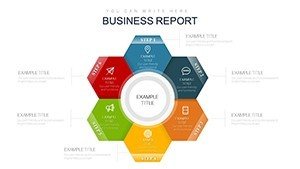
- Editable Diagrams: Flexible layouts for cash flow and debt analyses.
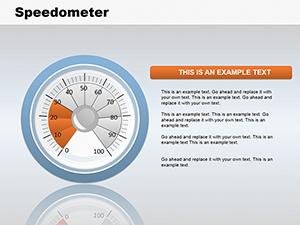
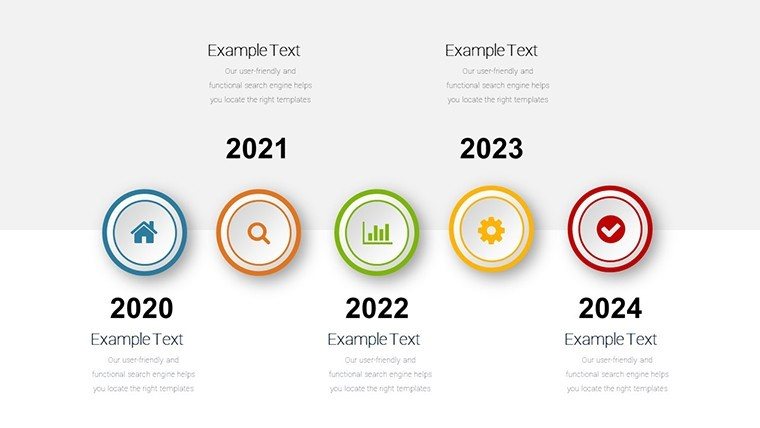
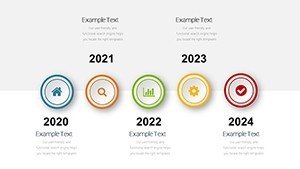
- Trend Visualizations: Tools to depict market influences like GDP and inflation.
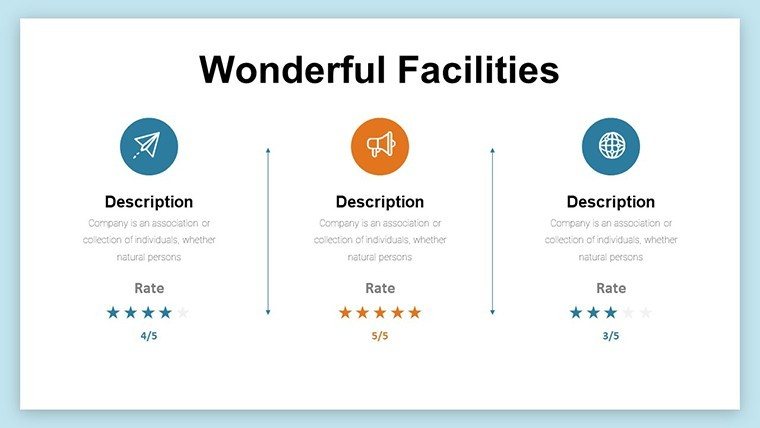
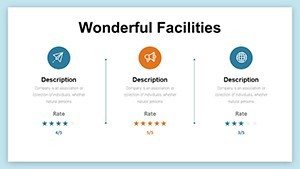
- Professional Themes: Cohesive styles that enhance credibility.
- Scalable Graphics: Maintain quality across devices.
Real impact: An investment bank revamped their quarterly decks using similar charts, improving stakeholder buy-in, as detailed in Harvard Business Review case studies.
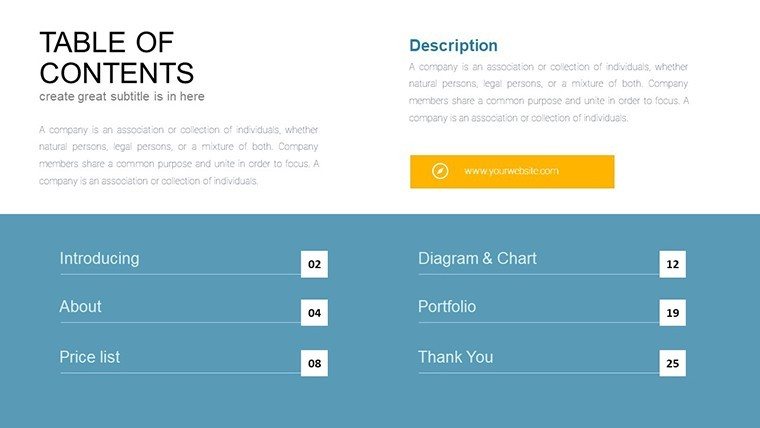
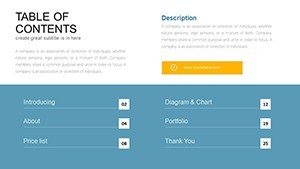
Slide Structure Explored
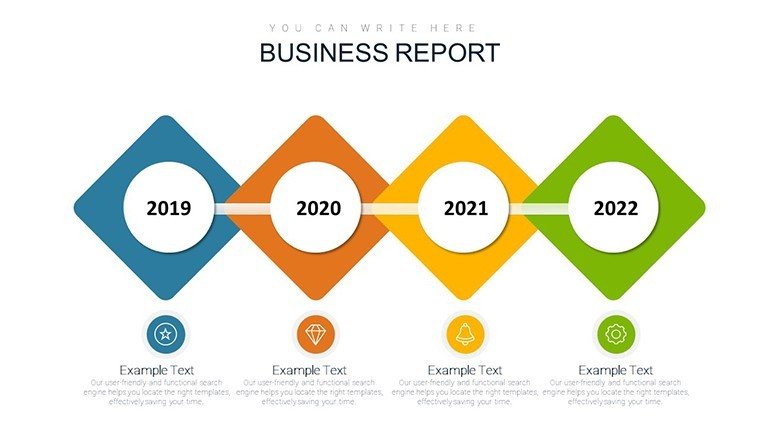
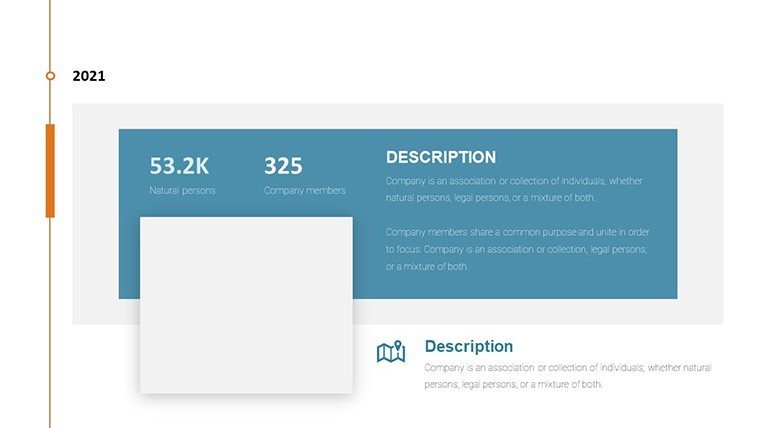
Slides 1-10 overview performance with summary dashboards. Middle sections focus on specifics like investment returns via scatter plots. Final slides analyze externalities with area charts for economic factors.
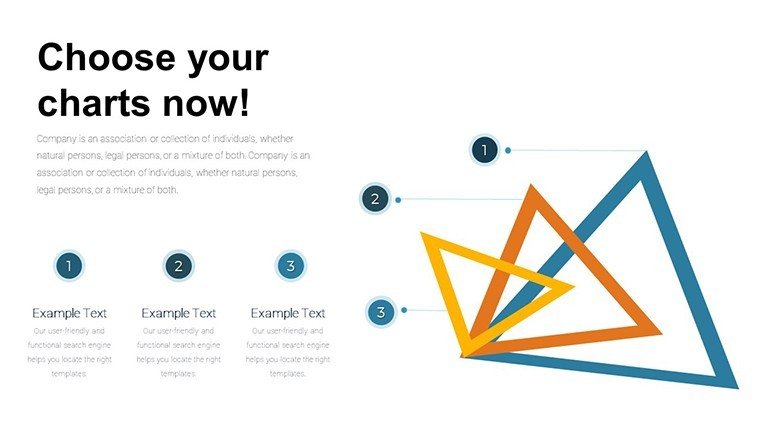
Each slide features smart connectors for easy modifications, ensuring data flows logically.
Broad Use Cases in Finance
Adaptable for myriad purposes, from risk assessments to portfolio reviews.
For leadership, visualize fiscal health to guide policy. Analysts can dissect trends for predictive insights. A notable example: During market volatility, a firm used finance charts to pivot strategies, averting losses per Bloomberg reports.
- Investor Pitches: Highlight opportunities with clear visuals.
- Internal Audits: Identify weaknesses in financial structures.
- Market Analyses: Incorporate external data for comprehensive views.
- Executive Briefs: Summarize complex info succinctly.
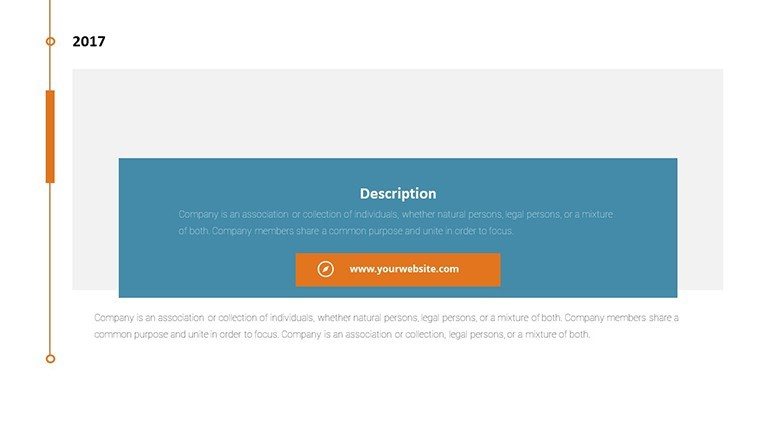
Integration tip: Embed hyperlinks to source documents for deeper dives.
Superior to Generic Alternatives
Unlike basic tools, it offers depth with pre-analyzed frameworks, incorporating LSI like "financial risk assessment."
Trust built on alignment with SEC guidelines for accurate representations.
Pro Tips for Maximum Effectiveness
Emphasize storytelling - link charts to business outcomes. Use animations sparingly for emphasis.
Success story: A startup's funding success hinged on propelled finance visuals, raising millions.
Accelerate your financial prowess - secure this Propel Finance PowerPoint Charts Template now.
Frequently Asked Questions
- How editable are the financial diagrams?
- Fully customizable, from data points to color schemes.
- Compatible with other software?
- Primarily PowerPoint, but exportable to PDF or images.
- Suitable for market trend presentations?
- Yes, with dedicated slides for economic indicators.
- What’s included in the purchase?
- 34 slides in .pptx for $20.00.
- Are there data import options?
- Yes, link to Excel for dynamic updates.