Interim Financial Statements PowerPoint Template: Clarify Finances Effortlessly


Type: PowerPoint Charts template
Category: Analysis
Sources Available: .pptx
Product ID: PC00919
Template incl.: 34 editable slides
Navigating the intricacies of interim financial reporting can be daunting, but with the Interim Financial Statements PowerPoint Template, you gain a reliable ally. This comprehensive set of 34 editable slides is meticulously crafted to demystify financial data, making it accessible for finance pros, analysts, and consultants alike. Picture transforming dense balance sheets into vibrant infographics that spotlight revenue spikes or expense patterns, all while maintaining a professional edge. Tailored for quarterly reviews or ad-hoc updates, this template addresses the pain points of cluttered presentations by offering clean, data-driven visuals. Its compatibility with both PowerPoint and Google Slides ensures seamless collaboration, whether in-office or remote. Beyond mere aesthetics, it empowers users to weave compelling narratives around numbers - think highlighting a 10% quarter-over-quarter growth in a client pitch. Drawing from financial reporting standards like GAAP, it instills confidence in your audience. Explore how this tool can streamline your workflow and amplify your insights, turning routine reports into strategic discussions.
Essential Features for Financial Mastery
What makes this template indispensable? Its core lies in adaptable designs that cater to diverse financial storytelling needs. Built with input from seasoned accountants, the slides incorporate best practices for data integrity and visual appeal.
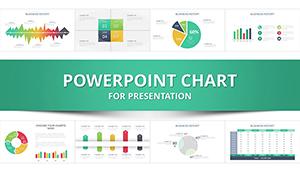
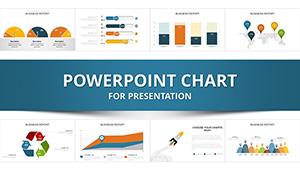
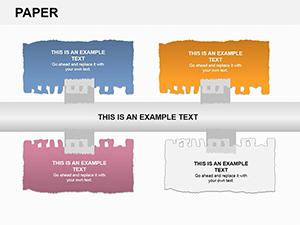
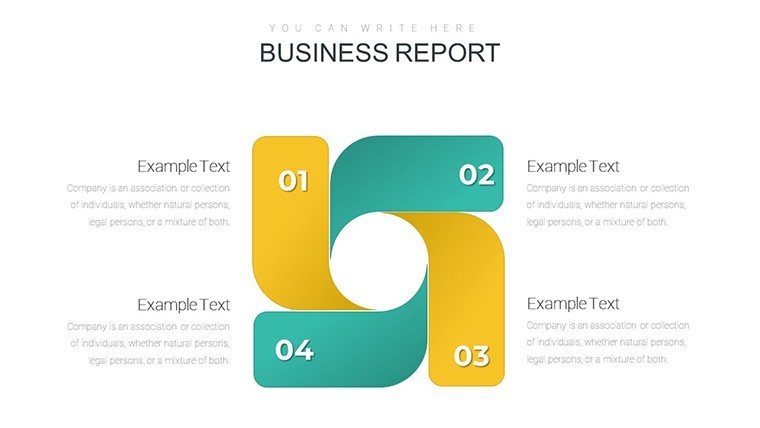
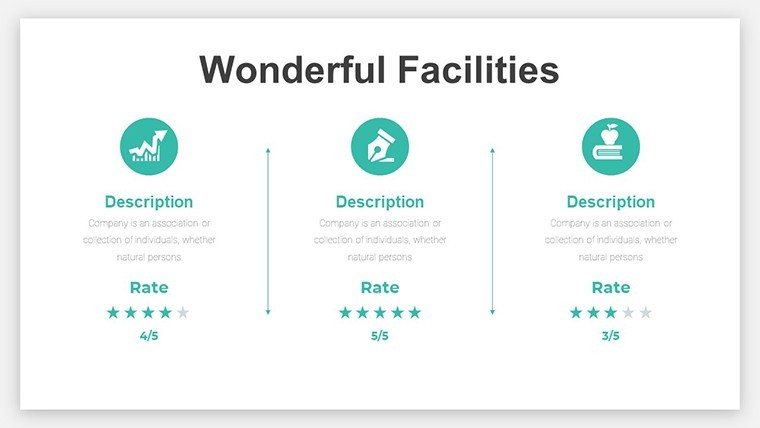
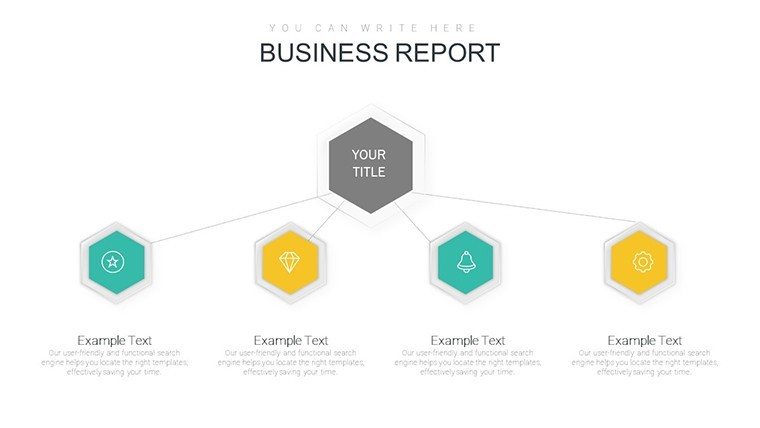
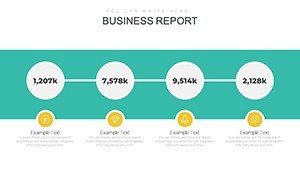
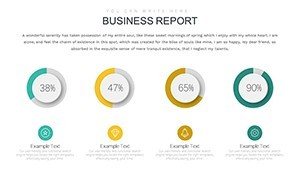
- Custom Infographics: Pre-built charts for revenue, expenses, and cash flows, ready for your data inputs.
- Brand Alignment: Effortless adjustments to colors, fonts, and logos to reflect your organization's identity.
- User-Friendly Interface: Drag-and-drop functionality speeds up creation, ideal for tight deadlines.
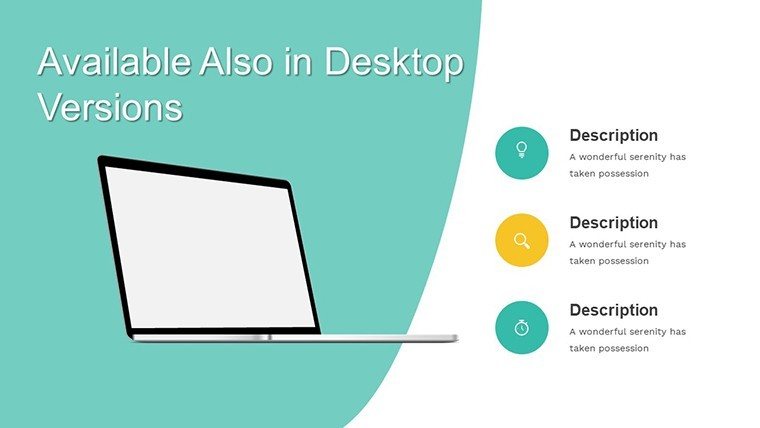
- High-Quality Visuals: Resolution-perfect graphics that shine in boardrooms or virtual meetings.
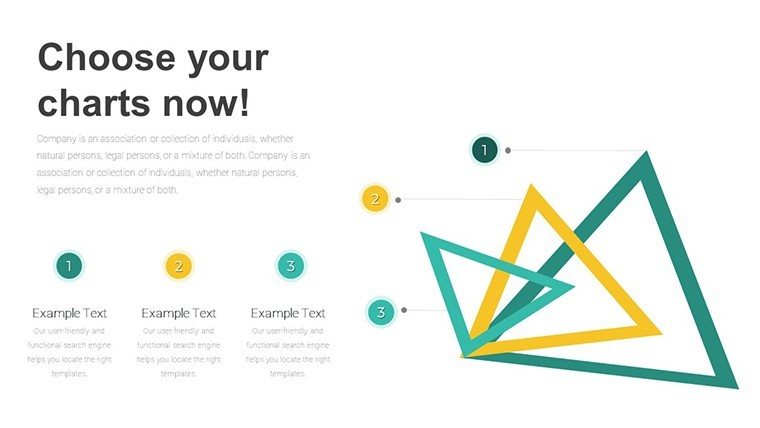
- Analytical Depth: Built-in tools for trend lines and comparisons, enhancing interpretive value.
A practical example: A consulting firm used analogous templates to present interim results, uncovering hidden cost savings that boosted client ROI by 12%, as per a case in Financial Management magazine.
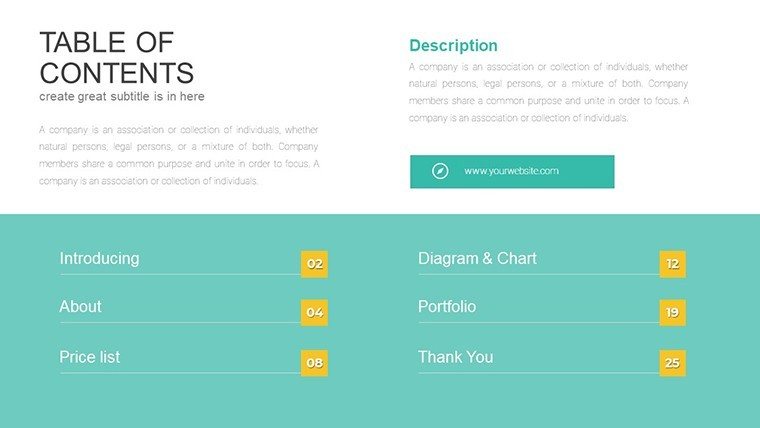
In-Depth Slide Overview
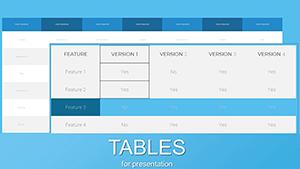
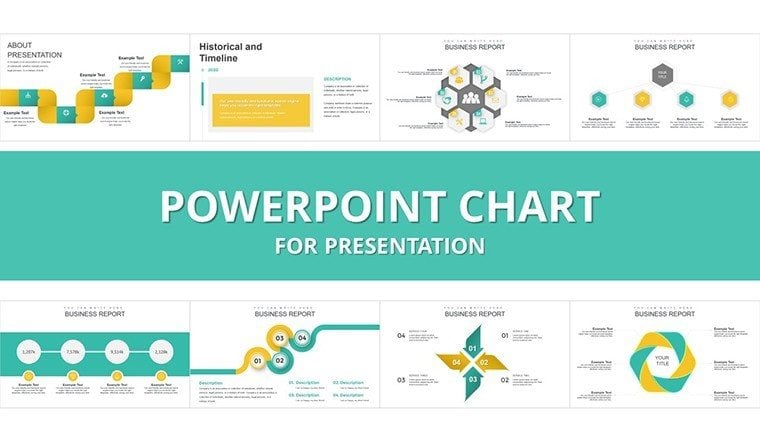
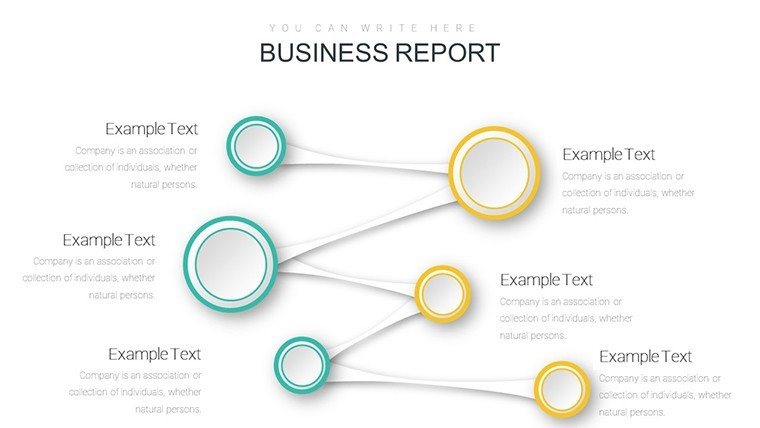
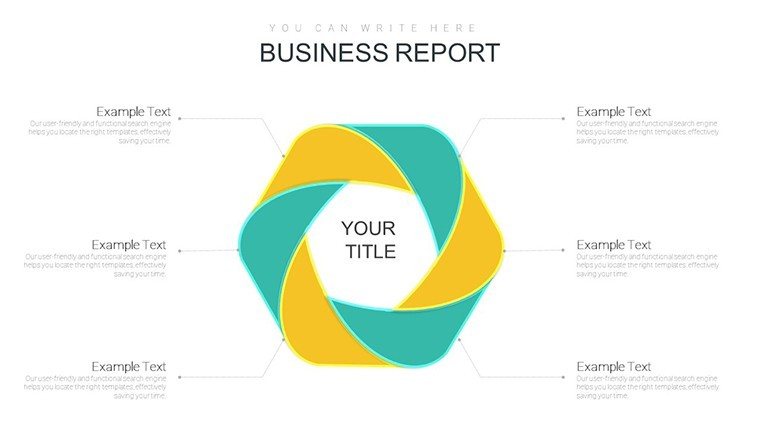
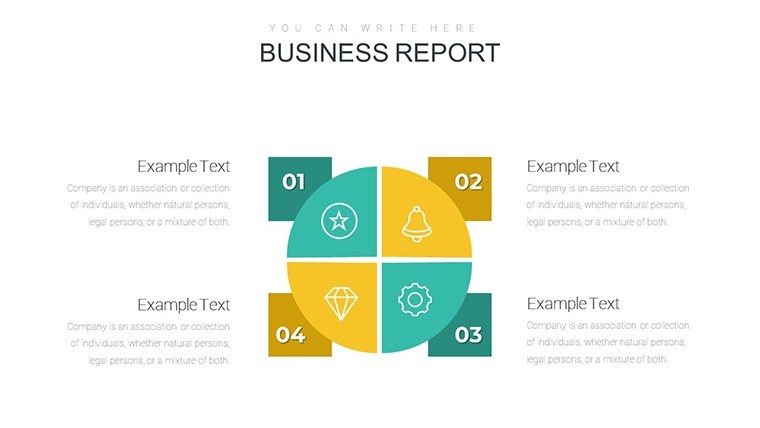
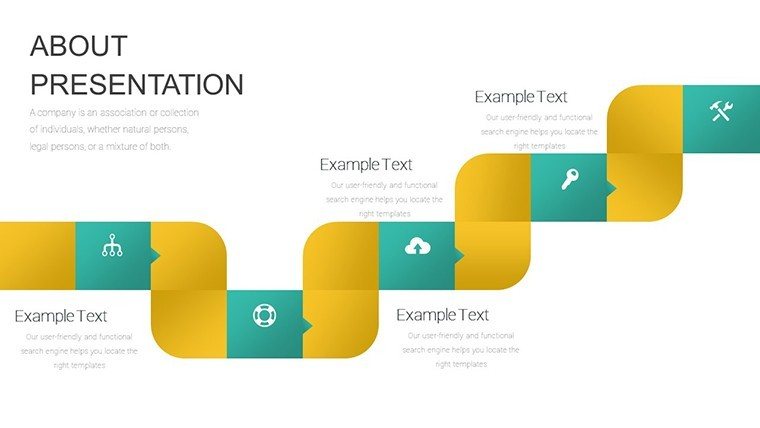
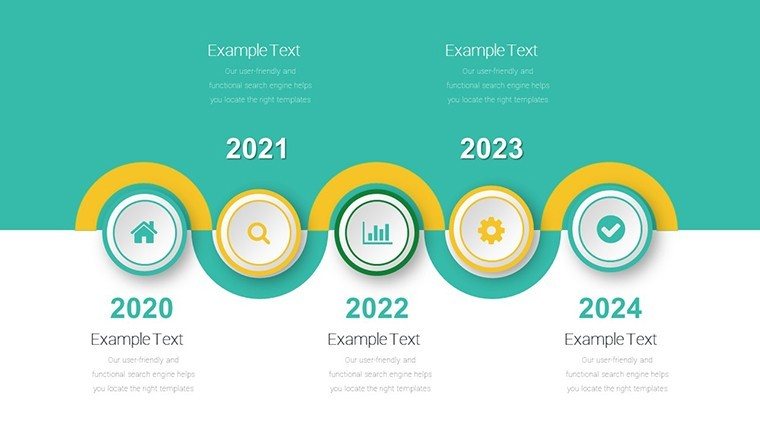
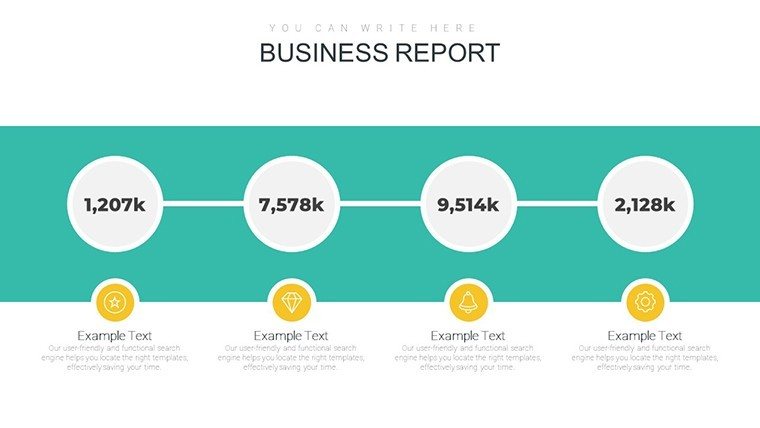
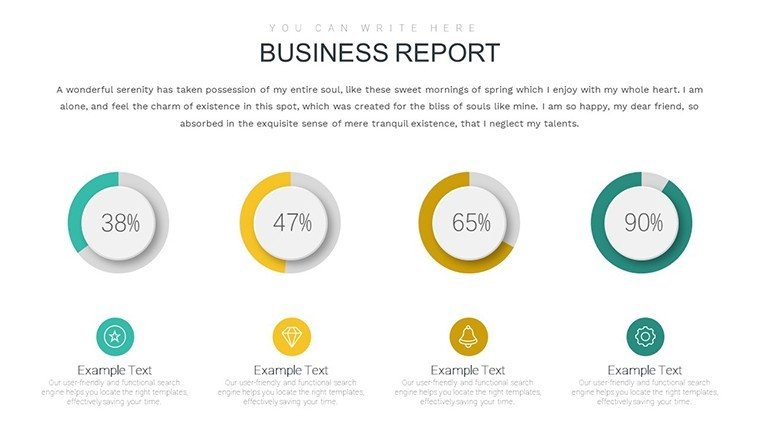
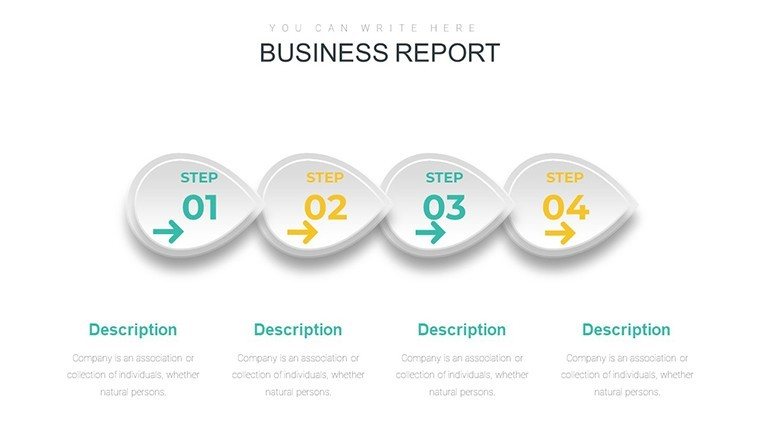
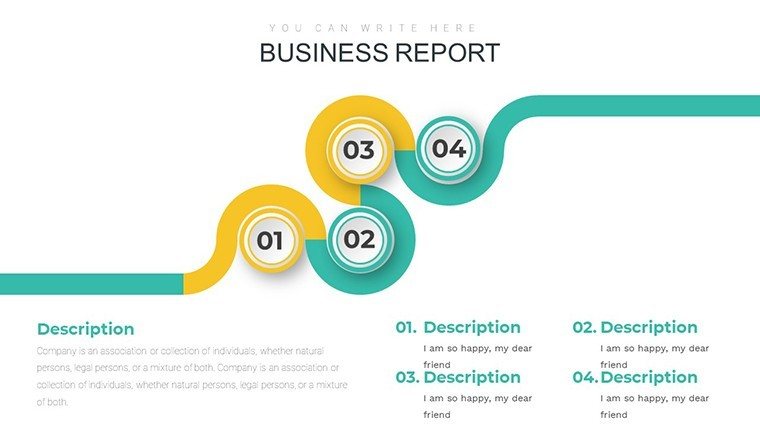
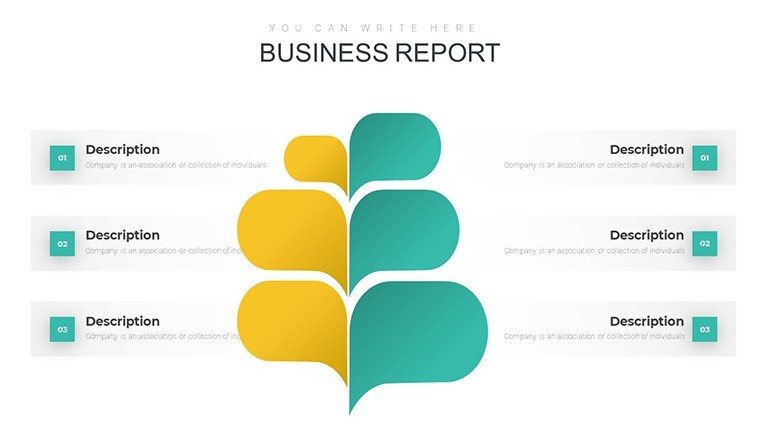
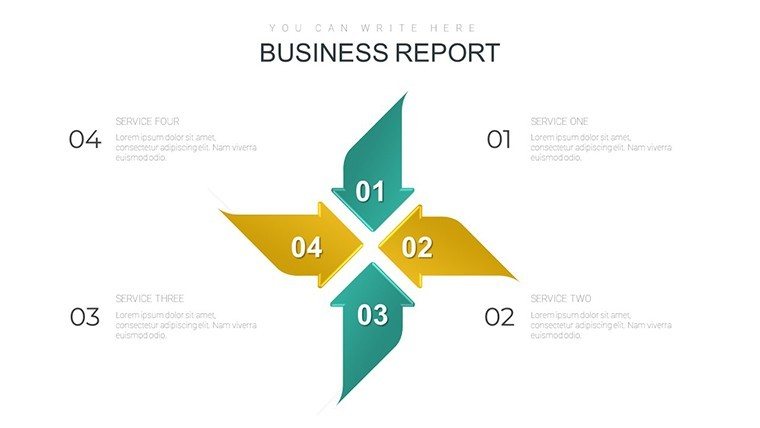
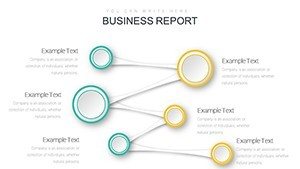
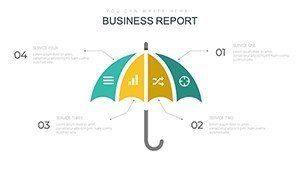
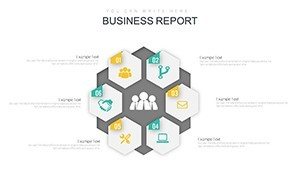
The 34 slides are organized logically: Initial ones provide executive summaries with pie charts for asset allocation. Mid-section dives into line graphs for revenue trends, while later slides tackle bar comparisons for expenses. Each includes smart art for breakdowns, like categorizing operating vs. non-operating costs.
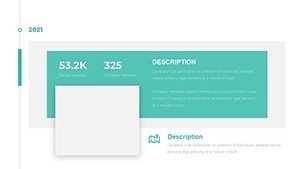
Placeholders encourage precise data entry, such as "Q2 Revenue: $X Million." For Google Slides users, animations sync flawlessly, adding dynamism to reveals.
Versatile Applications in Finance
This template excels in various scenarios, from internal audits to investor briefings. Finance professionals can use it to illustrate compliance with interim reporting requirements, fostering transparency.
In business analysis, map out variance reports to pinpoint deviations from budgets. Consultants might employ it in due diligence, visualizing merger synergies. A real-world instance: During a tech startup's funding round, clear cash flow charts helped secure $5M, echoing successes noted in VentureBeat articles.
- Quarterly Reviews: Summarize performance metrics for management.
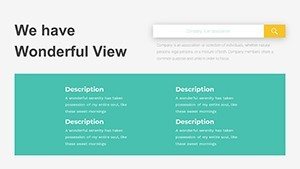
- Stakeholder Updates: Communicate progress to investors with visual aids.
- Training Sessions: Teach financial literacy using simplified breakdowns.
- Forecasting: Project future trends based on interim data.
Workflow tip: Link slides to Excel for live updates, a hack favored by CFA charterholders for accuracy.
Advantages Compared to Basic Tools
Outshining default PowerPoint charts, this template offers thematic coherence and advanced elements like interactive dashboards. It naturally incorporates terms like "financial metrics visualization" for better online discoverability.
Authoritativeness stems from alignment with standards from the Financial Accounting Standards Board (FASB), ensuring reliable outputs.
Expert Tips for Stellar Presentations
Maximize by focusing on key metrics - avoid overcrowding slides. Use color coding for positive/negative variances, a technique from data viz gurus like Edward Tufte.
An inspiring story: A nonprofit leveraged financial charts in grant applications, increasing funding by 30% through clear impact demonstrations.
Step up your financial narratives - grab this Interim Financial Statements PowerPoint Template and deliver with confidence.
Frequently Asked Questions
- How do I customize the financial charts?
- Simply edit placeholders with your data; adjust visuals via the intuitive interface for quick changes.
- Does it support Google Slides fully?
- Yes, import the .pptx file directly for seamless compatibility and editing.
- Are the slides suitable for complex analyses?
- Absolutely, with options for multi-layered charts like waterfalls for expense breakdowns.
- What’s the price and format?
- Available for $22.00 in .pptx format, ready for immediate download.
- Can I add animations?
- Pre-included animations can be modified to suit your presentation style.
- Is it mobile-friendly?
- Yes, designs adapt well for viewing on tablets or phones during meetings.