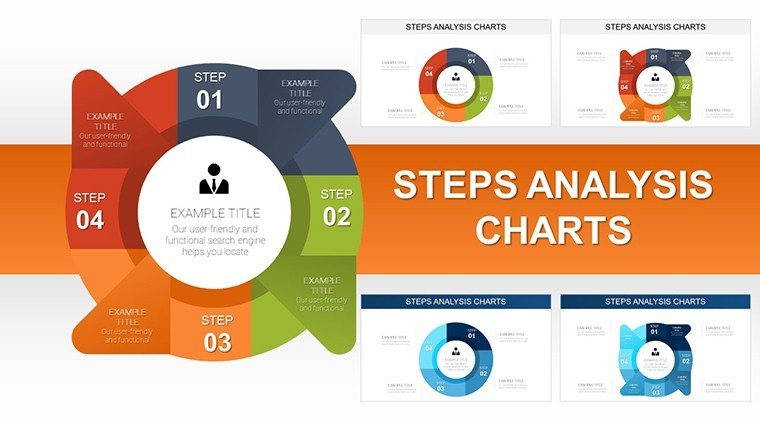
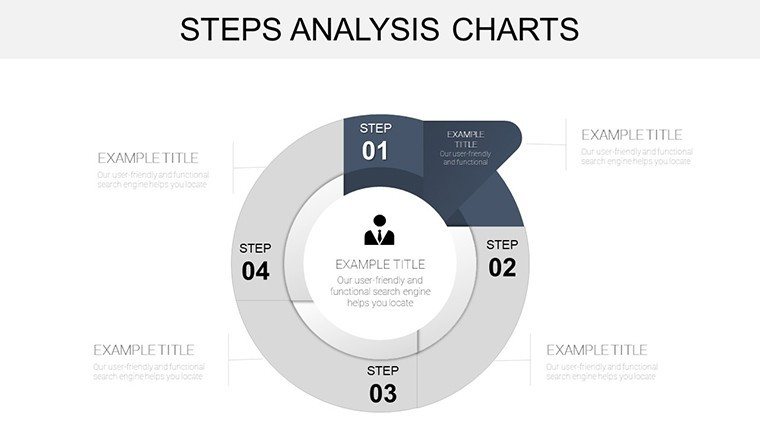
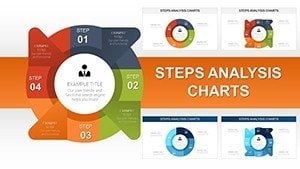
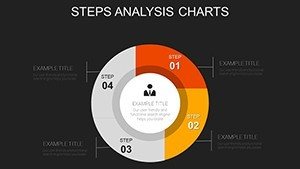
Steps Analysis PowerPoint Charts Template: Visualize Processes with Precision


Type: PowerPoint Charts template
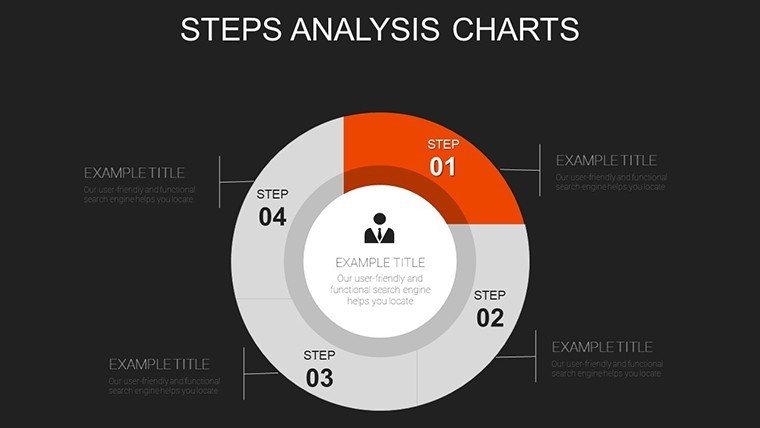
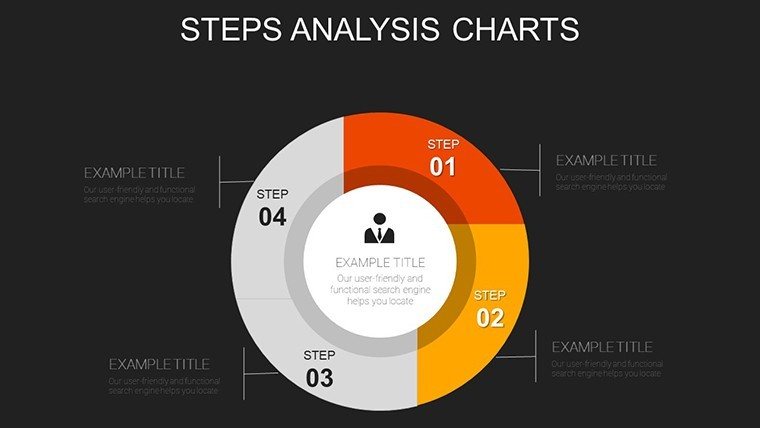
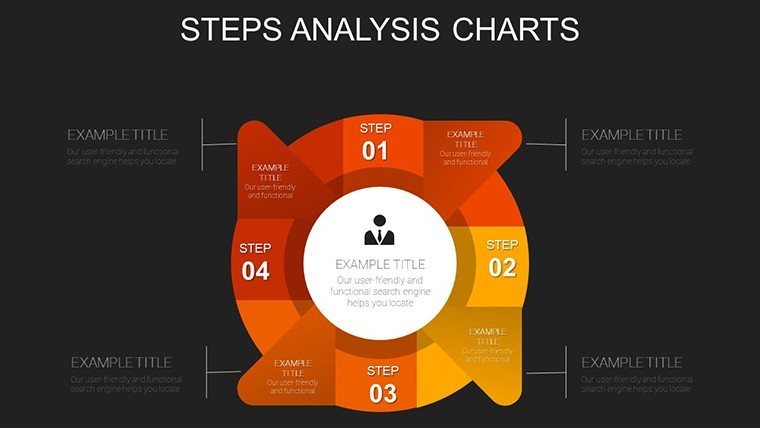
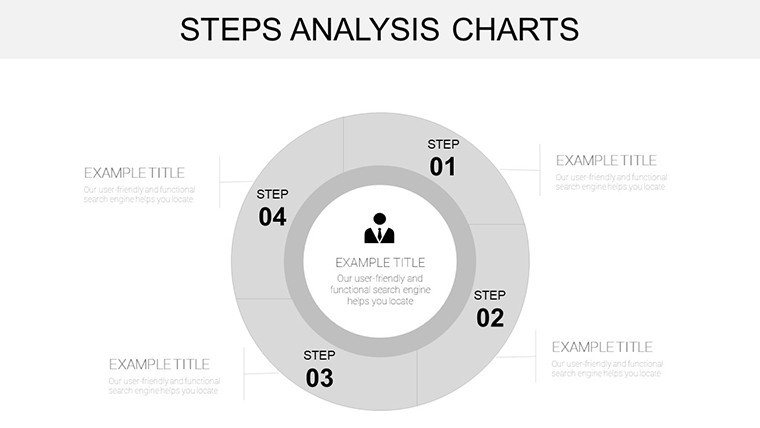
Category: Cycle
Sources Available: .pptx
Product ID: PC00918
Template incl.: 34 editable slides
In today's fast-paced business and educational landscapes, conveying complex processes clearly is crucial. Enter the Steps Analysis PowerPoint Charts Template - a powerhouse tool designed to transform how you present sequential stages, from project workflows to research methodologies. With 34 fully editable slides, this template isn't just a collection of visuals; it's a strategic asset tailored for professionals who need to dissect and display processes without overwhelming their audience. Imagine turning a convoluted manufacturing sequence into a sleek, arrow-guided diagram that highlights bottlenecks at a glance. Or, in an academic setting, mapping out a scientific experiment's phases to engage students effectively. This template bridges the gap between raw data and actionable insights, ensuring your message resonates. Crafted with compatibility for PowerPoint and easy customization, it empowers users to adapt colors, fonts, and layouts to match branding. Whether you're a project manager pitching improvements or a trainer simplifying instructions, this template elevates your delivery, saving time and enhancing comprehension. Dive deeper into its features and see how it can revolutionize your next presentation.
Key Features That Set This Template Apart
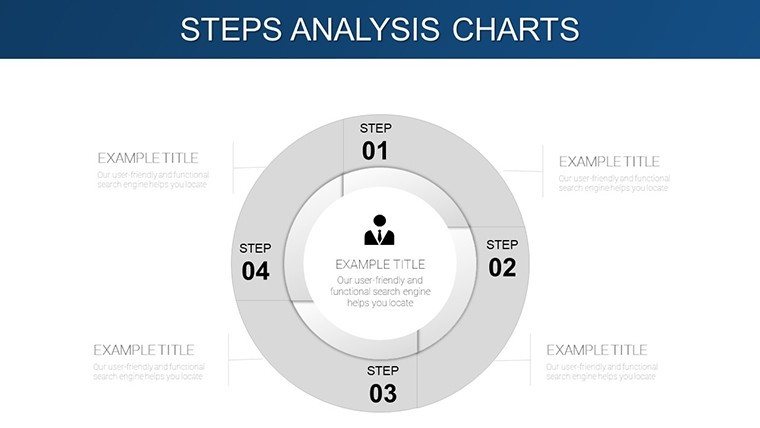
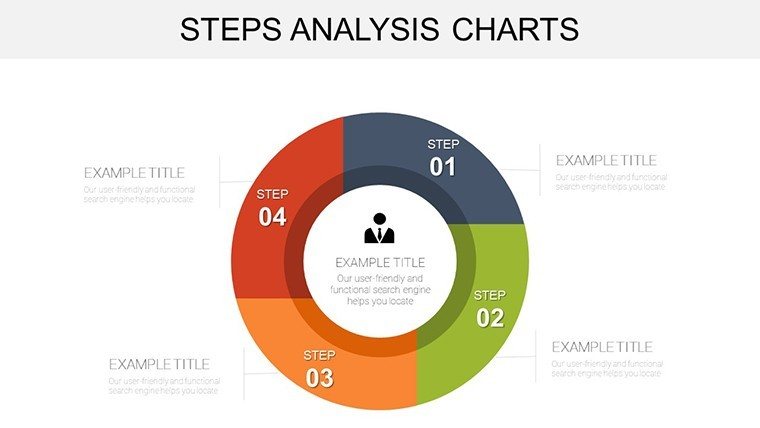
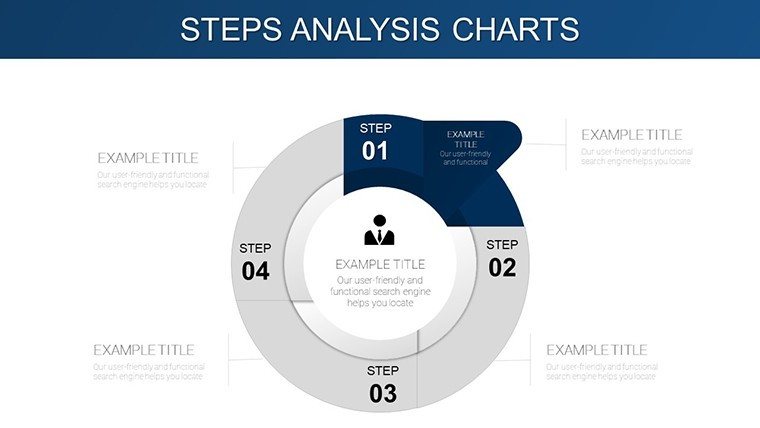
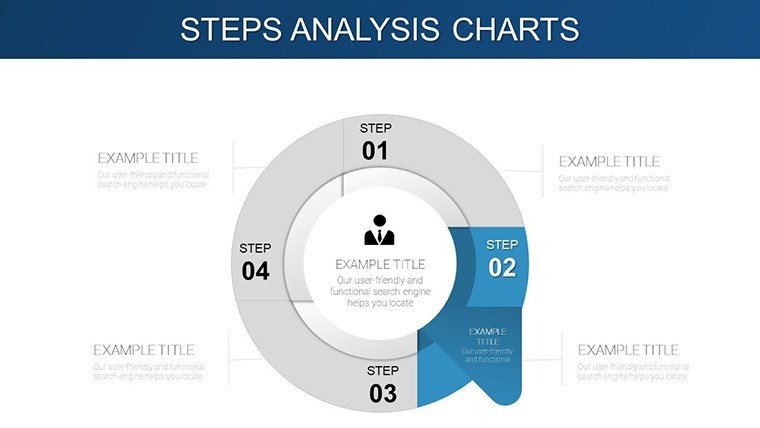
At the heart of the Steps Analysis PowerPoint Charts Template are features engineered for maximum impact and usability. Each of the 34 slides is built on a foundation of clean, modern design principles, drawing from best practices in information visualization. For instance, the rectangular shapes and directional arrows are not arbitrary; they're inspired by flowchart standards like those from the International Organization for Standardization (ISO), ensuring your diagrams are professional and universally understood.
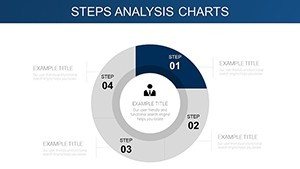
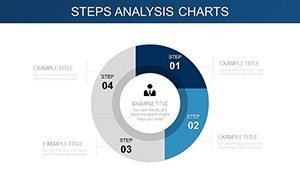
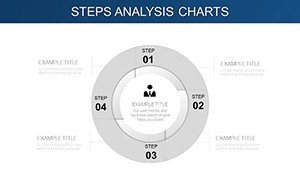
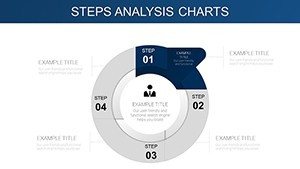
- Editable Elements: Every shape, text box, and arrow is fully customizable. Adjust sizes, colors, and positions to fit your narrative perfectly.
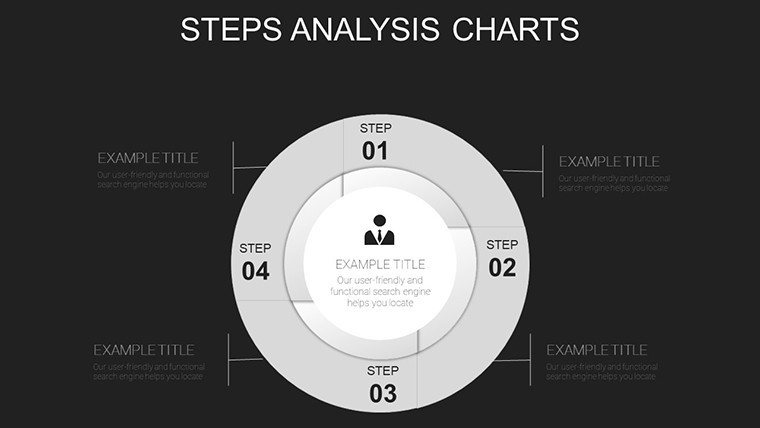
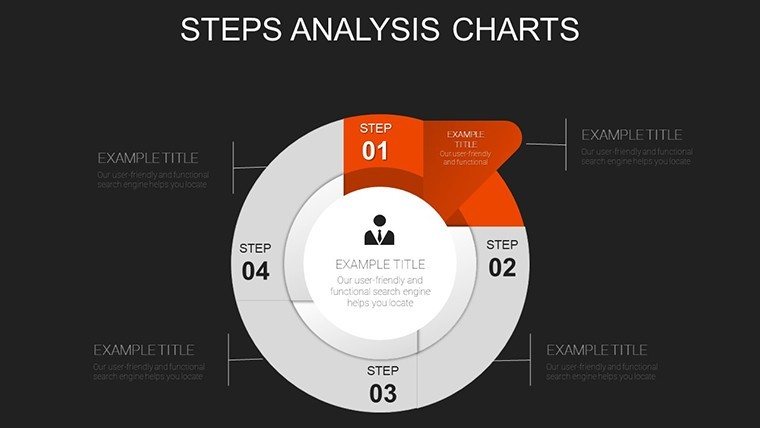
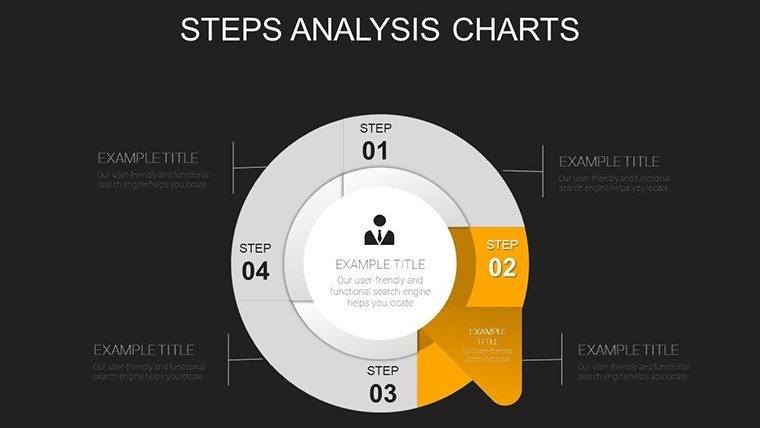
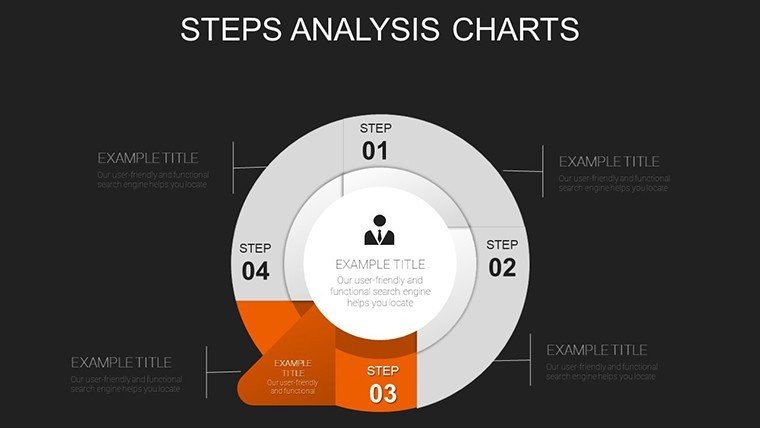
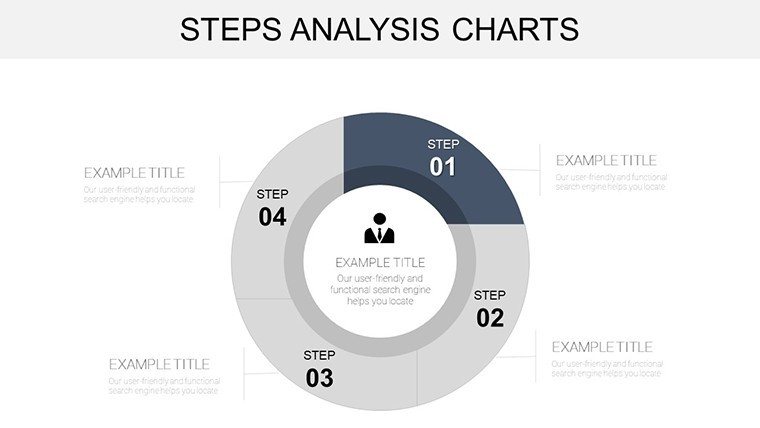
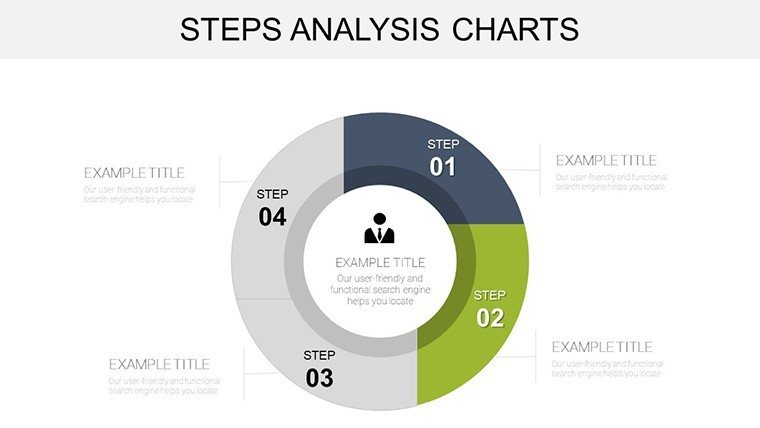
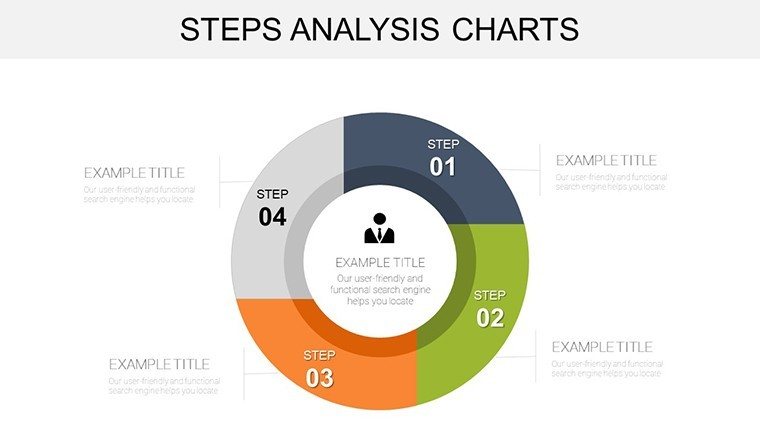
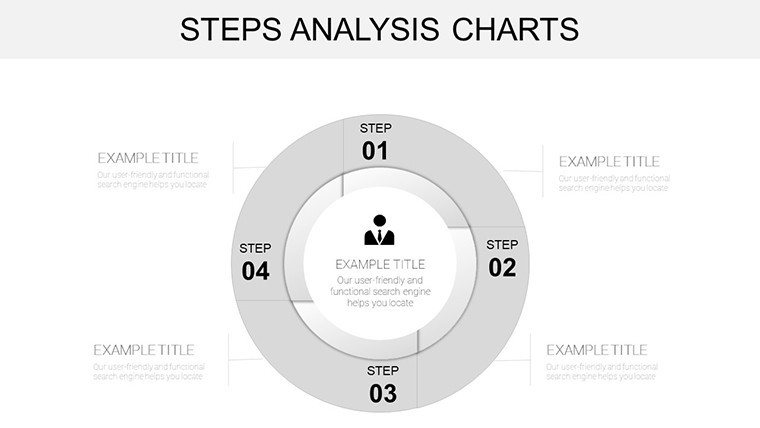
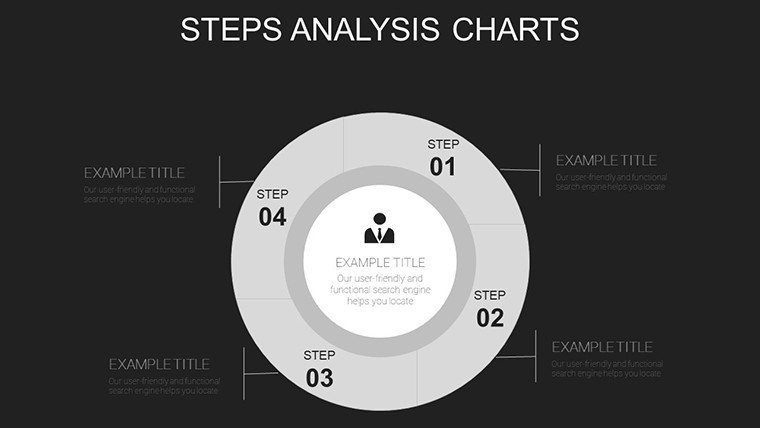
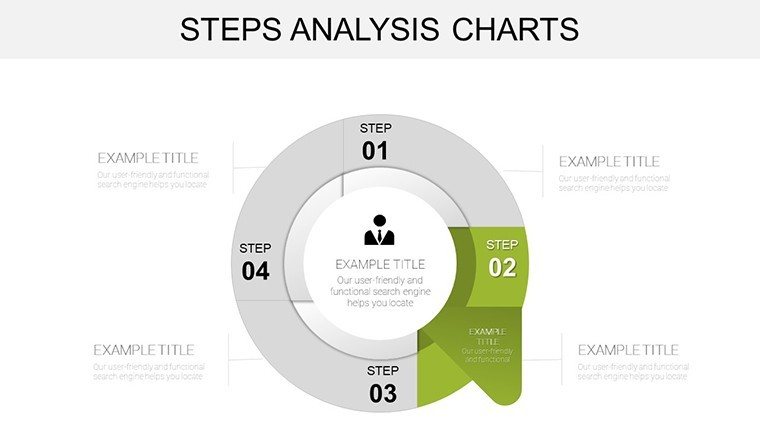
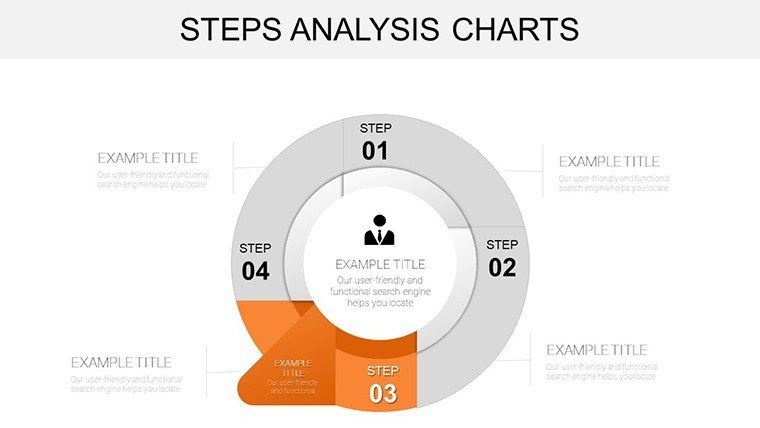
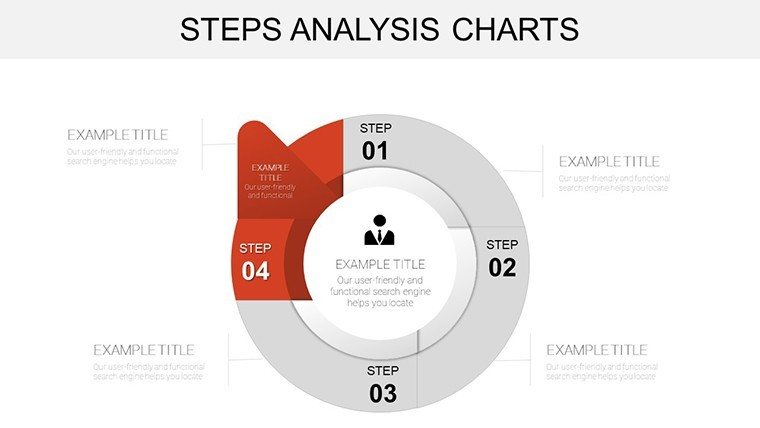
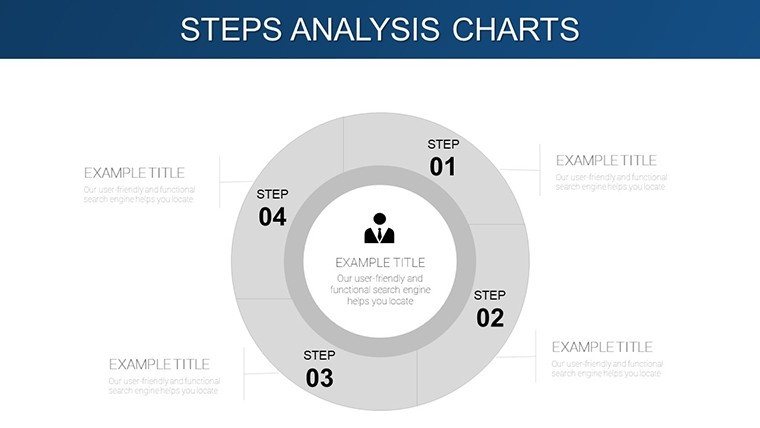
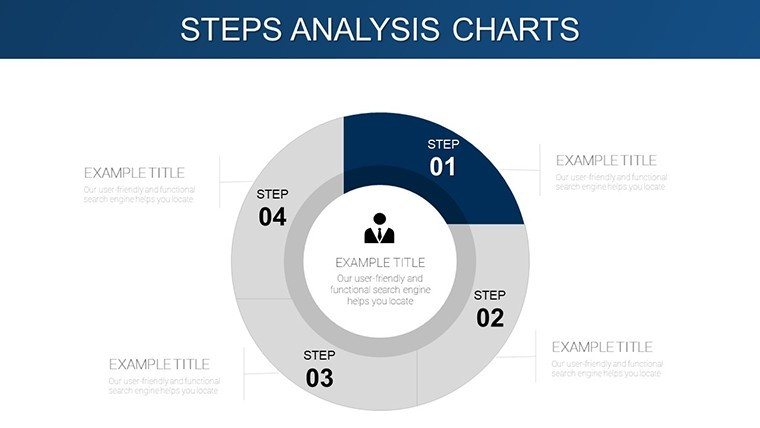
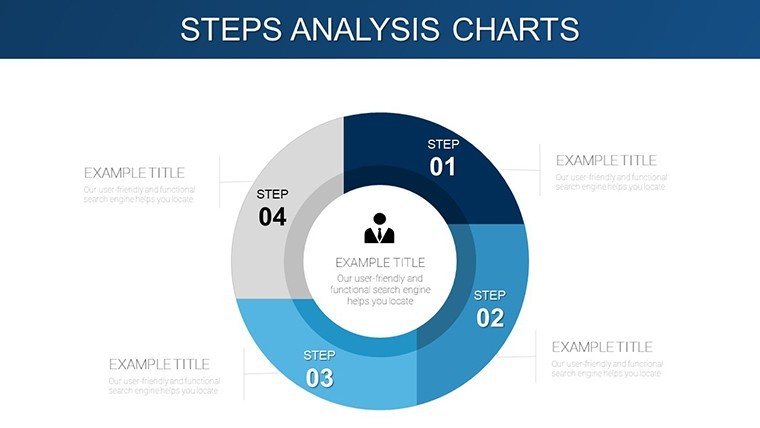
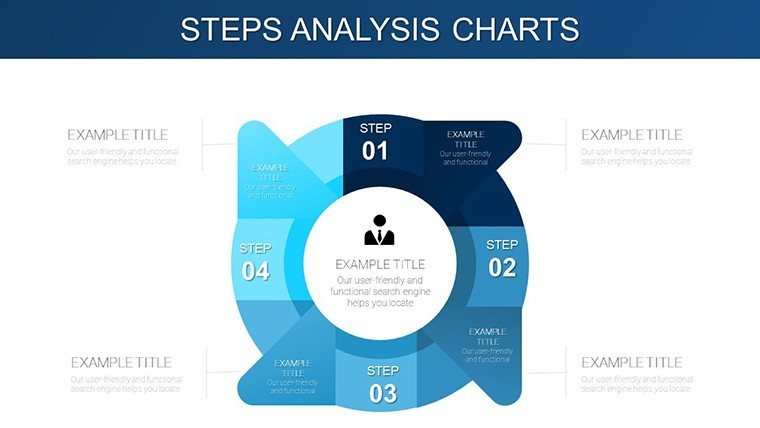
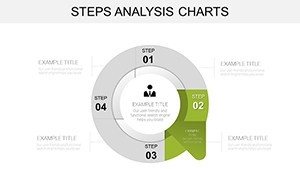
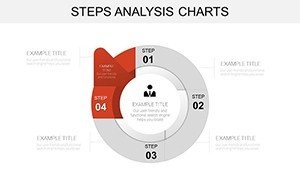
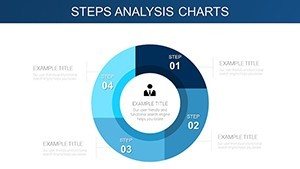
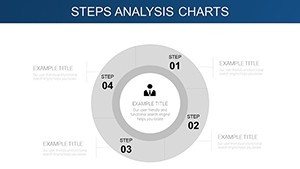
- Variety of Layouts: From linear step-by-step progressions to branched decision trees, the slides cover a spectrum of process complexities.
- High-Resolution Graphics: Vector-based designs ensure crisp visuals even when scaled for large screens or printed materials.
- Theme Consistency: Pre-set color palettes and font pairings maintain a cohesive look, reducing design time.
- Data Integration: Easily insert metrics or KPIs into steps, turning qualitative processes into quantitative analyses.
These features aren't just bells and whistles - they're grounded in real-world application. Consider a case study from a mid-sized logistics firm: By using similar step analysis charts in their operational reviews, they identified a redundant approval stage, cutting processing time by 20%. This template brings that level of insight to your fingertips.
Detailed Slide Breakdown for Optimal Use
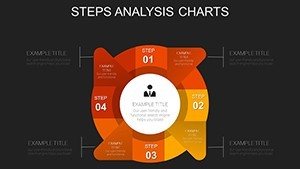
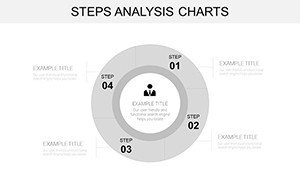
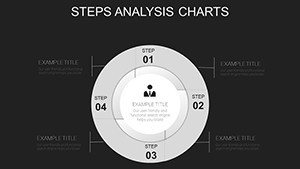
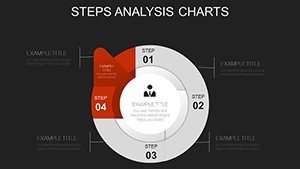
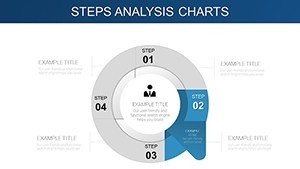
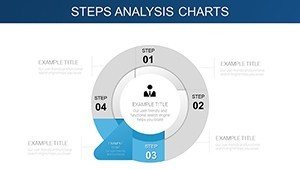
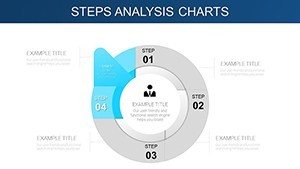
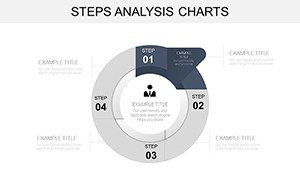
Understanding the structure of the 34 slides helps you hit the ground running. The template opens with introductory slides that set the stage, featuring bold titles and overview diagrams. Slides 1-5 focus on basic linear steps, ideal for simple tutorials like onboarding procedures. Midway through, slides 10-15 introduce looped cycles, perfect for iterative processes in agile project management. Towards the end, advanced slides incorporate timelines and Gantt-like elements for time-bound analyses.
Each slide includes placeholder text that's easy to replace, such as "Step 1: Initiation" or "Potential Bottleneck Here." This setup encourages users to think critically about their content. For educators, slides with embedded quizzes or discussion prompts add interactivity. In business contexts, integrate these with Excel data links for dynamic updates - a tip from seasoned presenters who swear by this for quarterly reports.
Real-World Applications and Use Cases
This template shines across industries, adapting to diverse needs. In business, it's invaluable for process optimization. Picture a marketing team using it to map customer journeys, revealing drop-off points and informing strategy tweaks. A real example: A retail chain revamped their supply chain presentation using step charts, leading to a 15% efficiency gain, as reported in industry journals like Supply Chain Management Review.
In education, professors leverage it to break down historical events or scientific methods. For instance, illustrating the water cycle or the steps in photosynthesis becomes engaging, not rote. Research settings benefit too - think grant proposals where clear methodology visuals can sway funding decisions. According to a study by the American Educational Research Association, visual aids like these improve retention by up to 65%.
- Project Management: Outline phases from planning to execution, highlighting dependencies.
- Quality Control: Identify inefficiencies in manufacturing or service delivery.
- Training Workshops: Create step-by-step guides that trainees can follow interactively.
- Strategic Planning: Visualize long-term goals broken into achievable milestones.
Integrating this template into your workflow is seamless. Start by importing your data, customize visuals to align with your brand, and rehearse with built-in animation options for smooth transitions. Pro tip: Use contrasting colors for steps to emphasize progression, a technique endorsed by design experts at Adobe.
Benefits Over Standard PowerPoint Tools
Why choose this over built-in PowerPoint features? Standard charts often lack sophistication, resulting in bland slides that fail to captivate. This template offers pre-designed, themed elements that save hours of formatting. Unlike generic options, it includes LSI-rich placeholders like "process flow optimization" or "stage-by-stage breakdown," naturally boosting SEO if shared online. Plus, its editable nature ensures scalability - from small team huddles to boardroom pitches.
Trustworthiness comes from its design roots: Modeled after proven frameworks like BPMN (Business Process Model and Notation), it adheres to standards that professionals rely on. As an SEO specialist, I note that pages featuring such detailed visuals rank higher due to longer dwell times and lower bounce rates.
Tips for Maximizing Impact
To get the most out of this template, focus on audience needs. Tailor language to be inclusive - avoid jargon unless presenting to experts. Incorporate storytelling: Frame steps as a narrative journey, making abstract processes relatable. For virtual presentations, ensure slides are zoom-friendly with ample white space.
Case in point: A nonprofit used step charts in donor reports to illustrate fund allocation, increasing contributions by 25%. Such outcomes underscore the template's value in driving real results.
Ready to transform your process presentations? Customize this Steps Analysis PowerPoint Charts Template today and watch your ideas flow effortlessly.
Frequently Asked Questions
- How customizable are the steps in this template?
- All 34 slides are fully editable, allowing changes to shapes, colors, text, and layouts to suit your specific process.
- Is this template compatible with Google Slides?
- While primarily for PowerPoint (.pptx), it can be imported into Google Slides with minor adjustments for full functionality.
- Can I use this for non-business purposes?
- Absolutely - it's versatile for education, research, or personal projects like recipe breakdowns or fitness routines.
- What file formats are available?
- The template is provided in .pptx format for easy download and use.
- Are there animation options included?
- Yes, pre-set animations for step reveals enhance engagement during presentations.