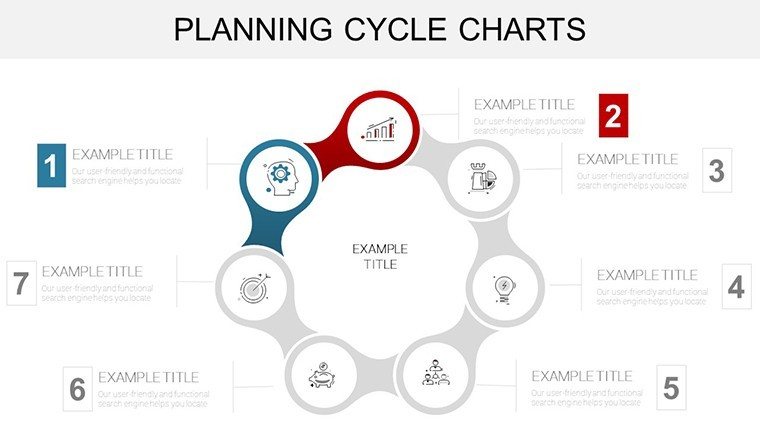
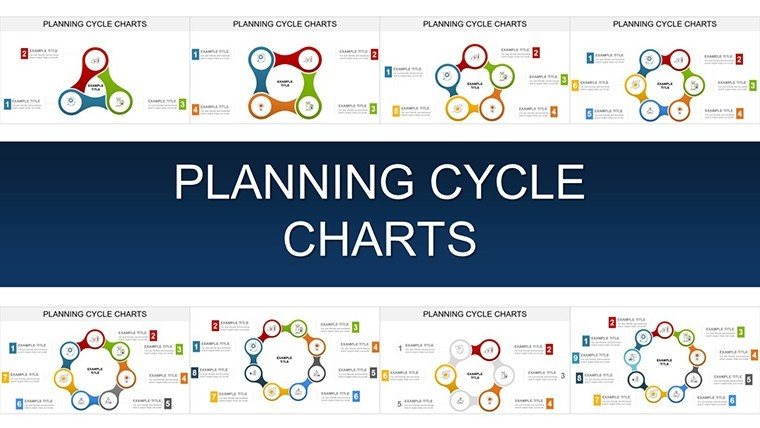
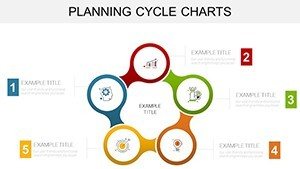
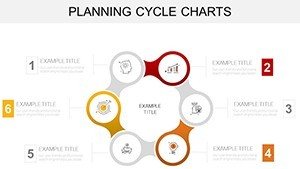
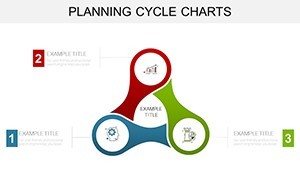
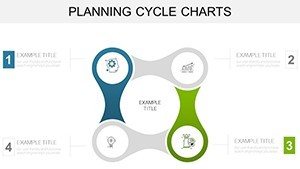
Planning Cycle PowerPoint Charts Template for Strategic Presentations


Type: PowerPoint Charts template
Category: Cycle
Sources Available: .pptx
Product ID: PC00915
Template incl.: 42 editable slides
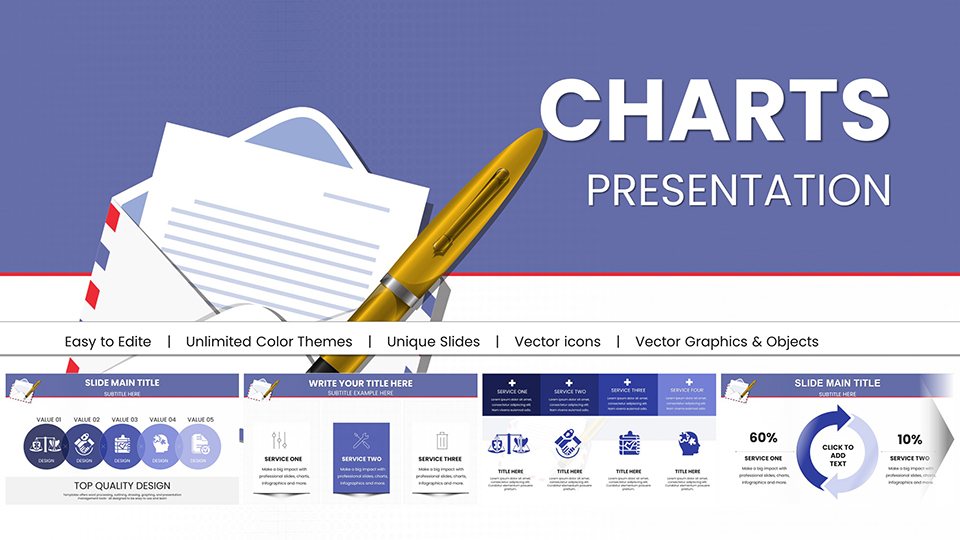
Envision charting a course through complex projects with effortless precision. Our Planning Cycle PowerPoint charts template, boasting 42 editable slides, is engineered for managers and strategists who demand clarity in chaos. This isn't your average slide deck - it's a comprehensive toolkit for mapping out goals, analyses, and executions, inspired by proven frameworks like the PDCA cycle from quality management pioneers like W. Edwards Deming.
Ideal for business planners and project leads, it addresses the pain of disjointed strategies by providing cohesive visuals that align teams. Case in point: A mid-sized firm revamped their annual planning using our Gantt charts, slashing timeline overruns by 35% through better resource visualization.
Stand out from rudimentary tools with advanced features like interactive timelines that adapt to real-time data, ensuring your plans remain agile. Fully compatible with PowerPoint and Google Slides, it's built for seamless workflow integration.
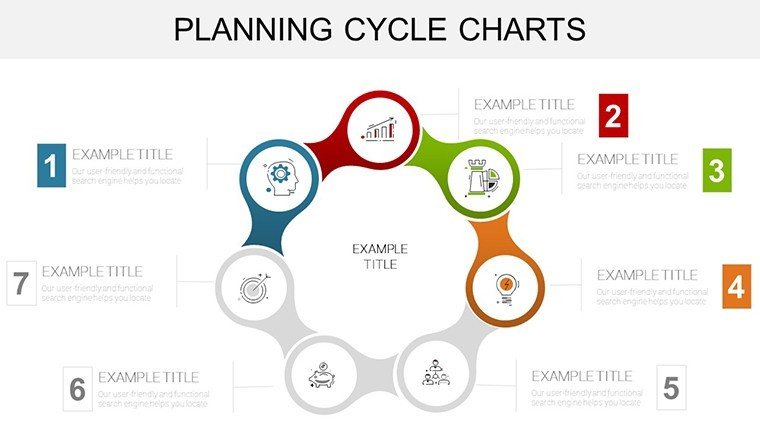
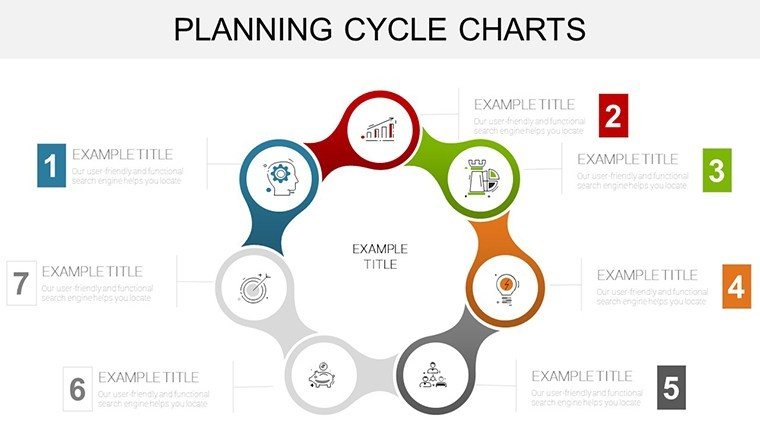
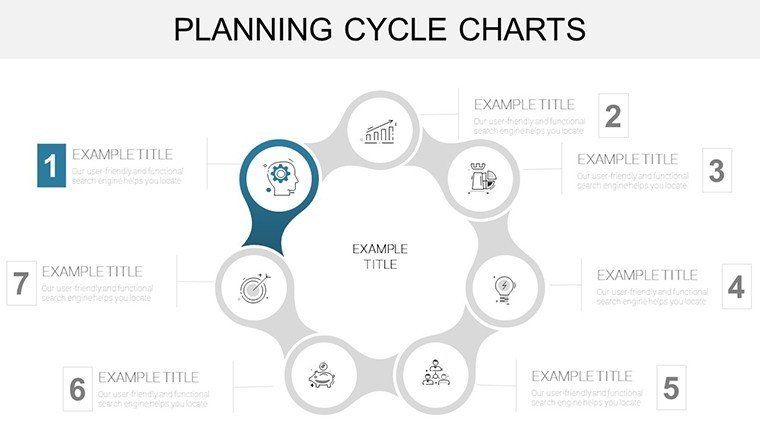
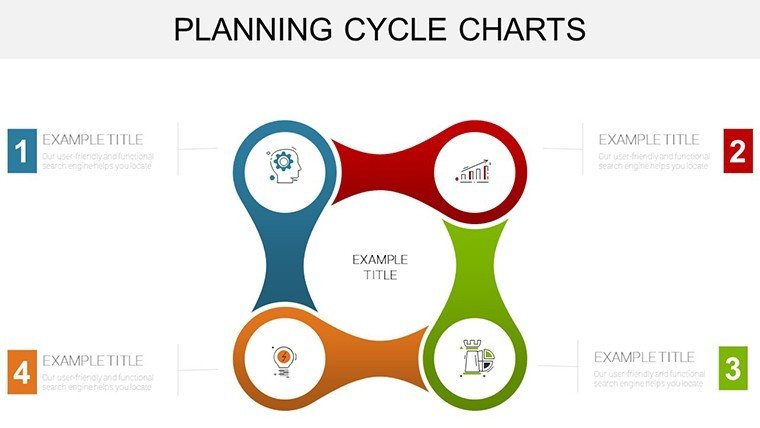
Navigating the Planning Landscape
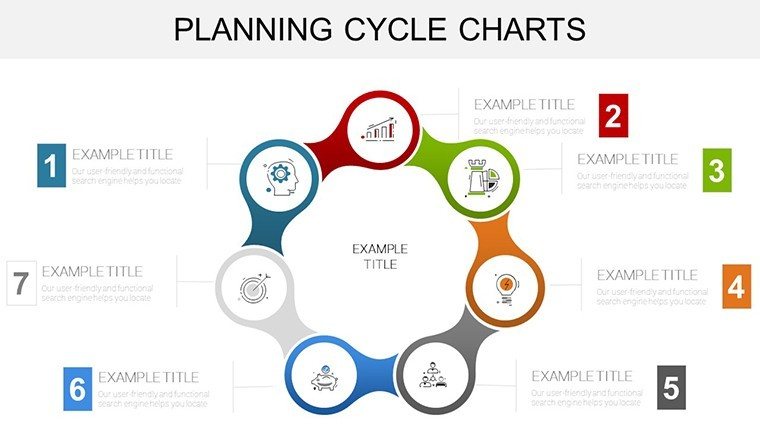
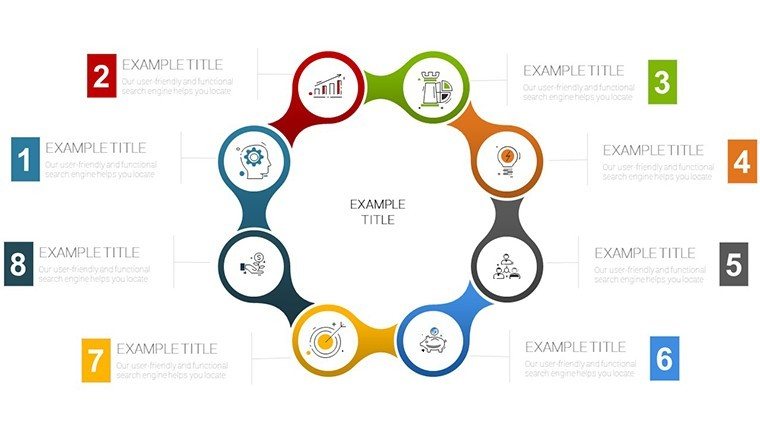
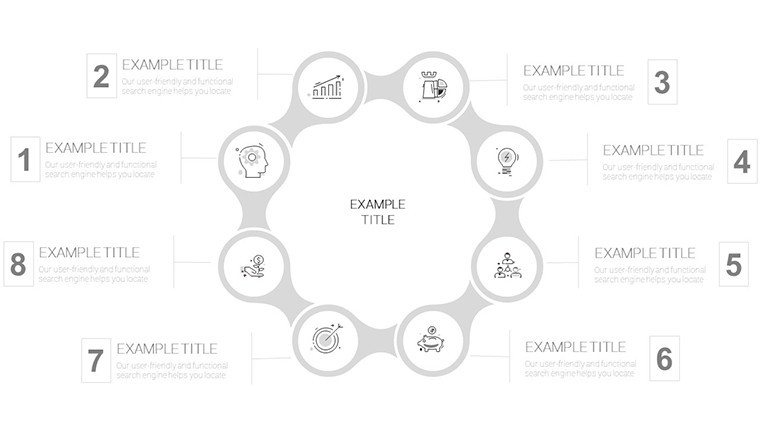
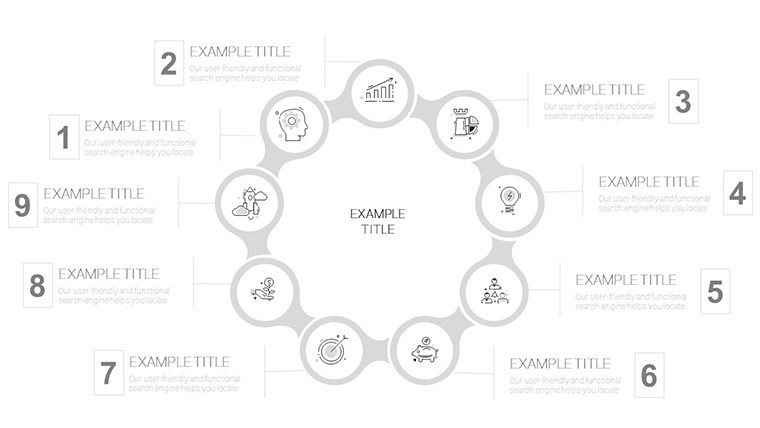
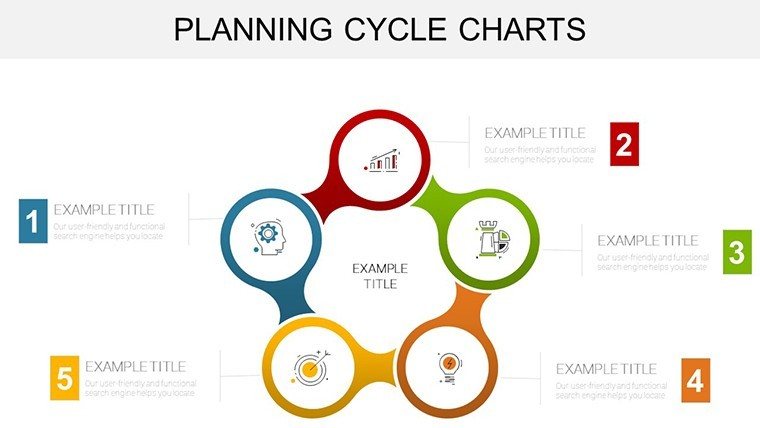
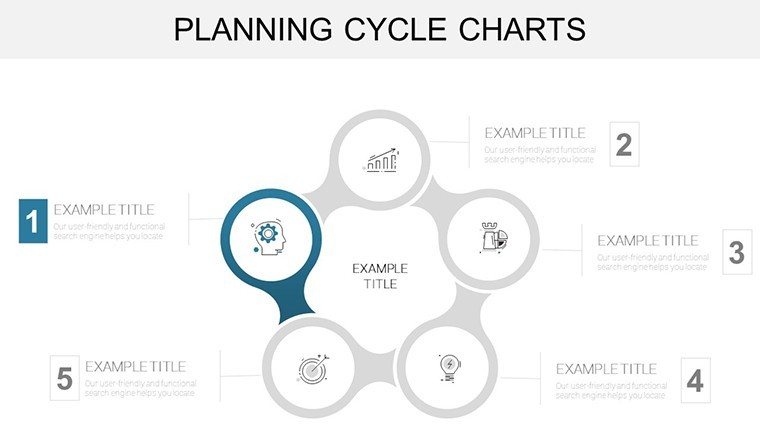
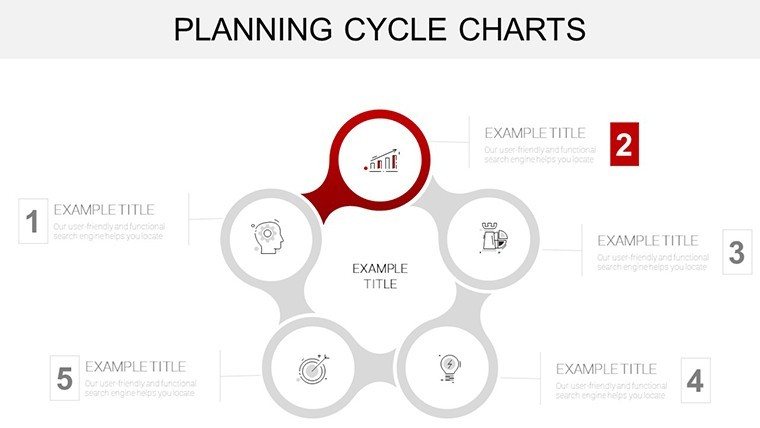
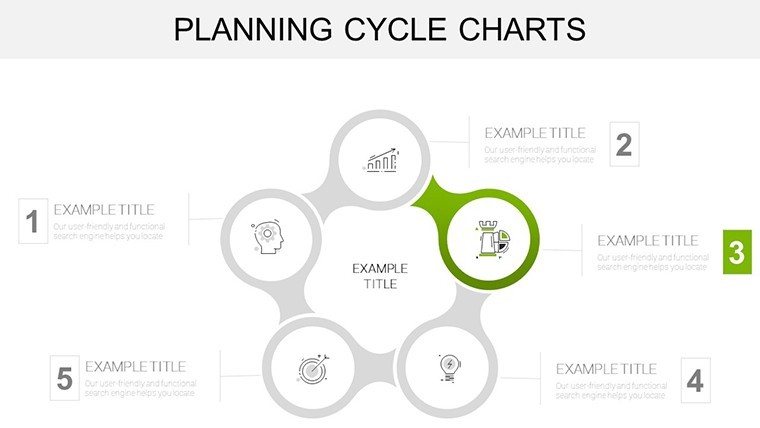
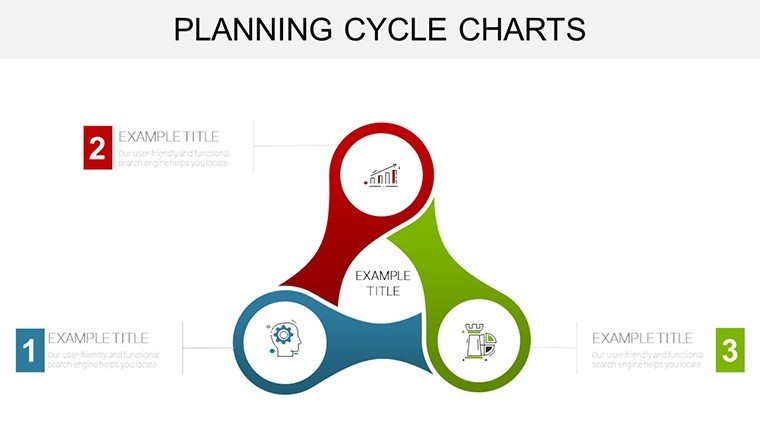
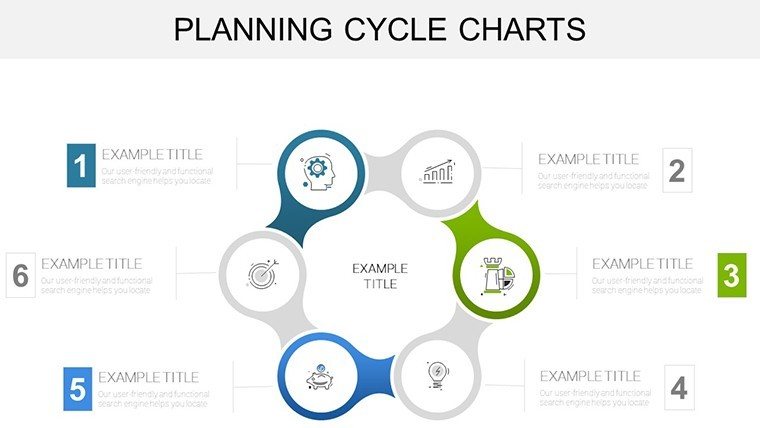
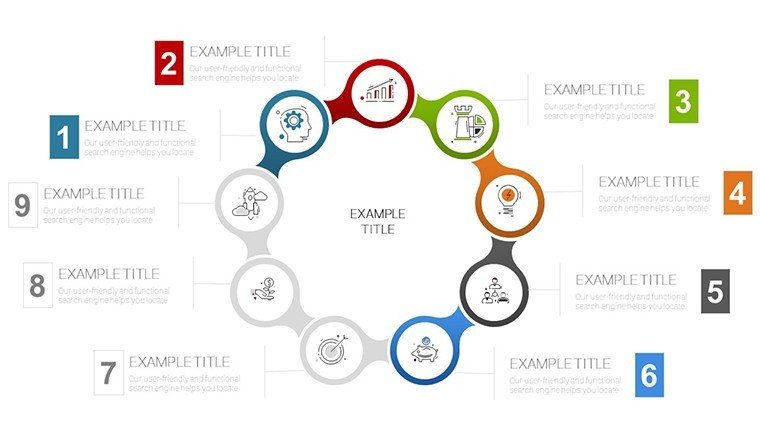
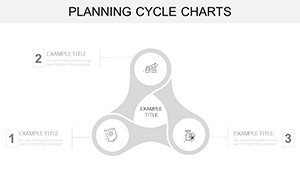
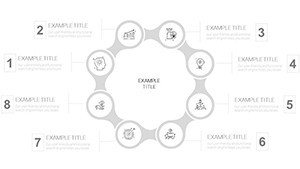
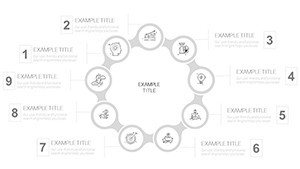
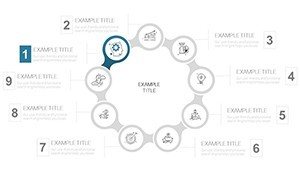
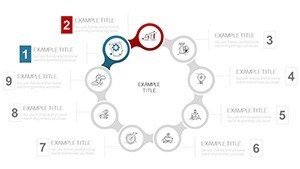
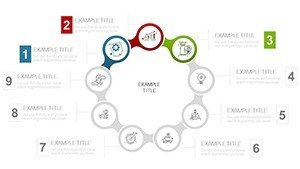
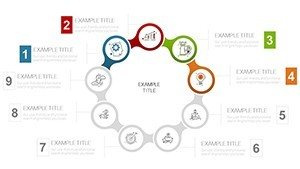
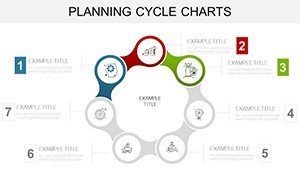
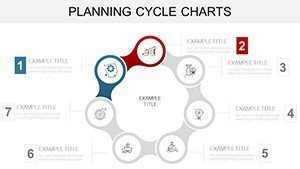
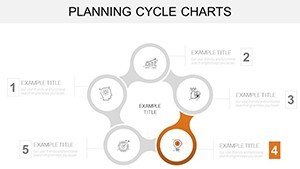
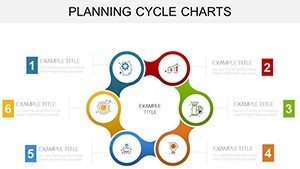
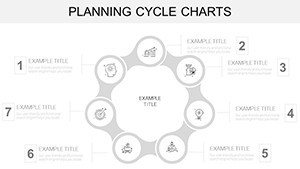
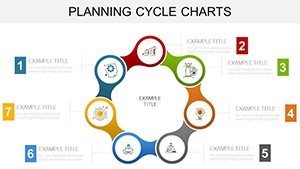
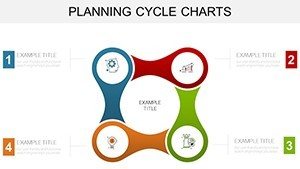
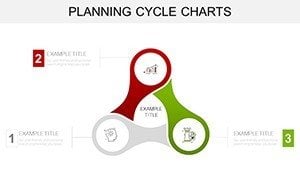
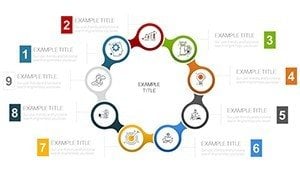
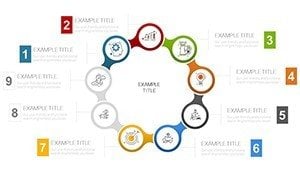
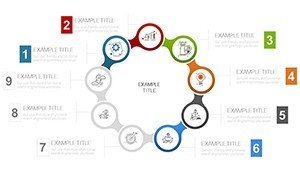
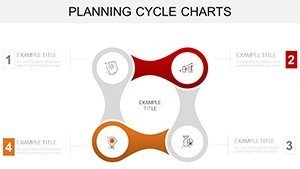
Planning cycles are iterative, and this template captures that essence with diagrams that loop through stages like goal setting and monitoring. Use process flows to depict resource allocation in manufacturing or timeline charts for marketing rollouts, all with vector-based precision for flawless scaling.
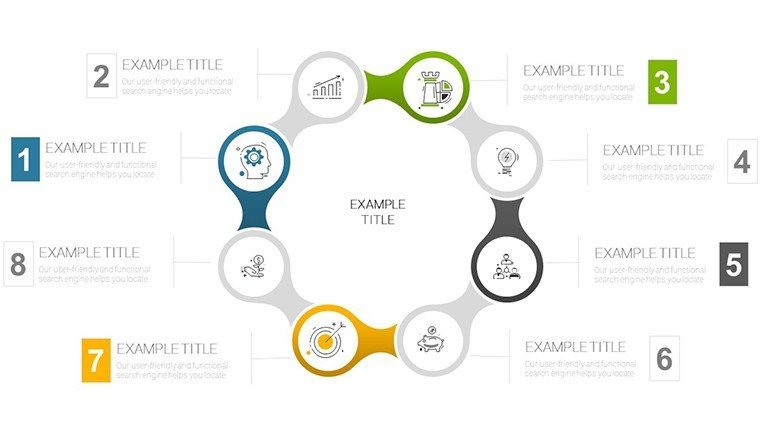
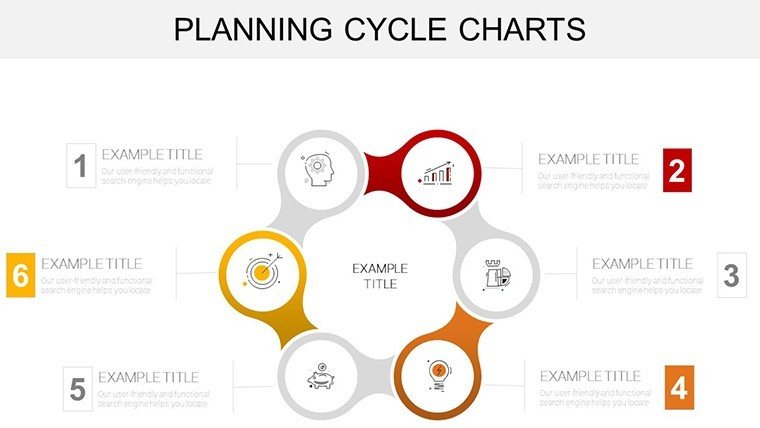
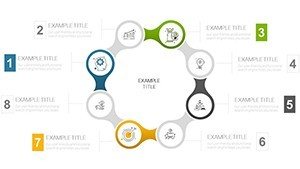
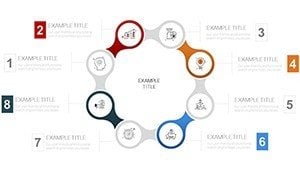
Tailor every element: Modify fonts to suit formal reports or infuse colors reflecting company vibes. Unlike free templates plagued by inconsistencies, this offers uniform styling, drawing from PMI standards for project excellence.
Standout Features for Strategic Depth
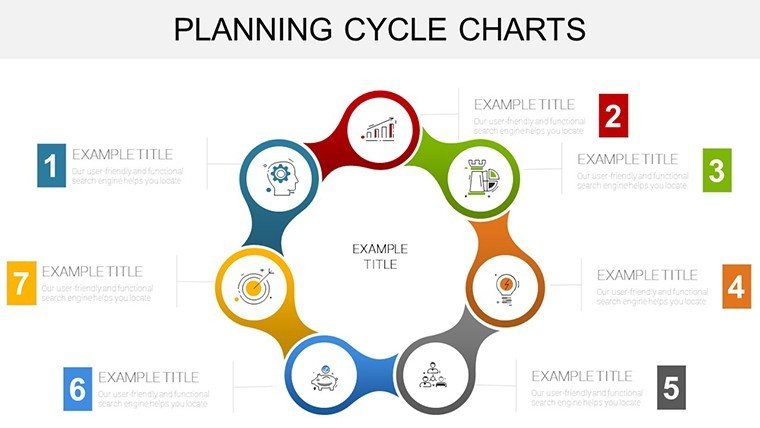
- Chart Diversity: Gantt, timelines, and SWOT matrices for holistic planning.
- Dynamic Updates: Editable fields that refresh with new inputs, no recoding needed.
- Visual Cues: Icons for milestones, like checklists for completion phases.
- Integration Ready: Links to external data sources for automated refreshes.
- Compliance Tools: Templates for risk assessments adhering to ISO guidelines.
In a strategic planning session for a nonprofit, our cycle diagrams clarified donor engagement paths, boosting fundraising efficiency.
Practical Use Cases in Action
From startups to enterprises, apply these charts universally. In performance management, track KPIs with dashboard slides; in education, teach strategic models with annotated flows. Step-by-step: Import data, select a cycle layout, customize metrics, and simulate scenarios with duplicates.
Tips for optimization: Employ grid alignments for symmetry, per graphic design basics, and use subtle animations to trace cycle progress, enhancing narrative flow.
Seamless Implementation Guide
- Launch the .pptx and pick a foundational slide.
- Enter project specifics into smart objects.
- Adjust visuals for emphasis, like bolding critical paths.
- Collaborate via shared links for input.
- Present with confidence, backed by data visuals.
This method trumps manual builds, offering speed and professionalism for tight deadlines.
Building Lasting Strategic Value
Affordable and evergreen, with updates to match software evolutions. Thousands rely on it for its robustness in volatile markets, incorporating terms like "strategic visualization aids" for discoverability.
Add inspiration: Frame cycles as "wheels of progress" to motivate teams during reviews.
Step up your planning game - secure this template and chart success.
Frequently Asked Questions
How flexible are the planning diagrams? Completely adaptable; resize, recolor, and reconfigure effortlessly.
Compatible with older PowerPoint versions? Yes, works from 2010 onward, plus Google Slides.
Ideal for team brainstorming? Perfect, with collaborative editing features.
Includes data examples? Starter datasets provided for quick starts.