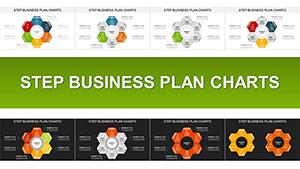
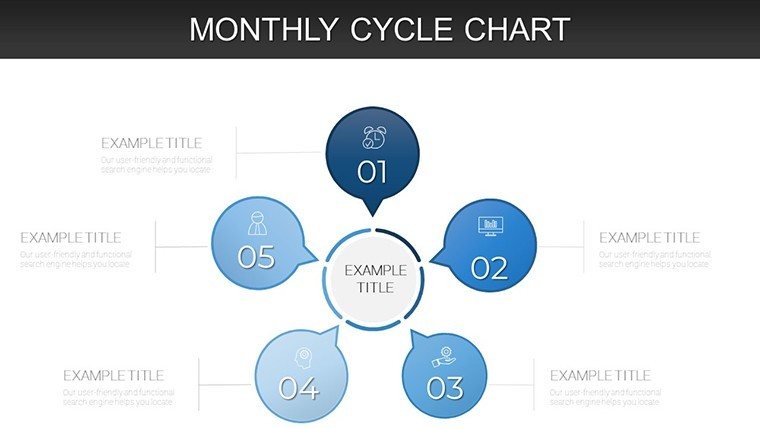
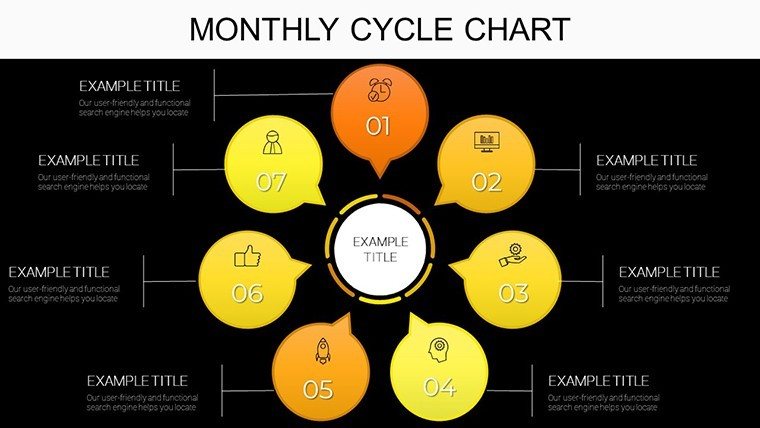
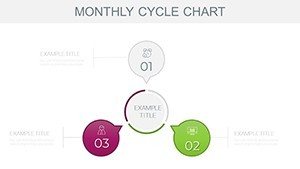
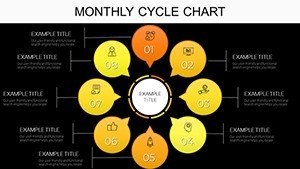
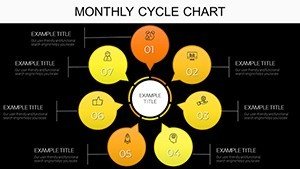
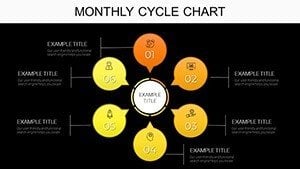
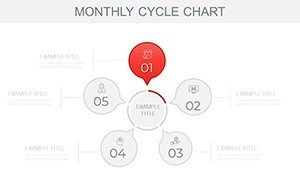
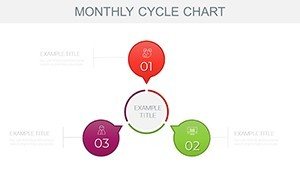
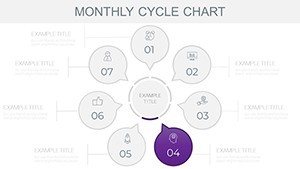
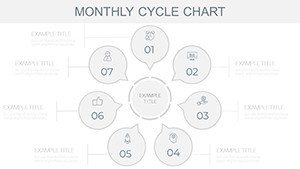
Elevate Monthly Reporting with Dynamic Cycle Charts in PowerPoint


Type: PowerPoint Charts template
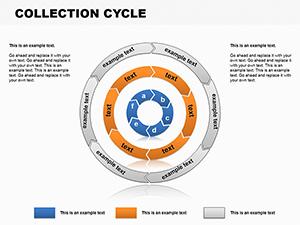
Category: Cycle
Sources Available: .pptx
Product ID: PC00910
Template incl.: 44 editable slides
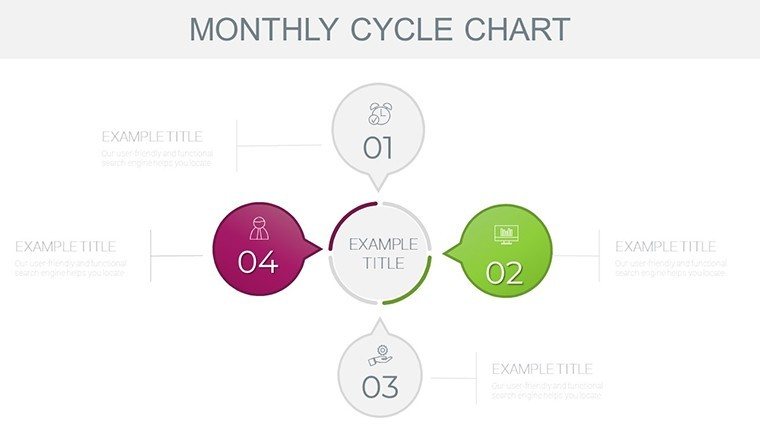
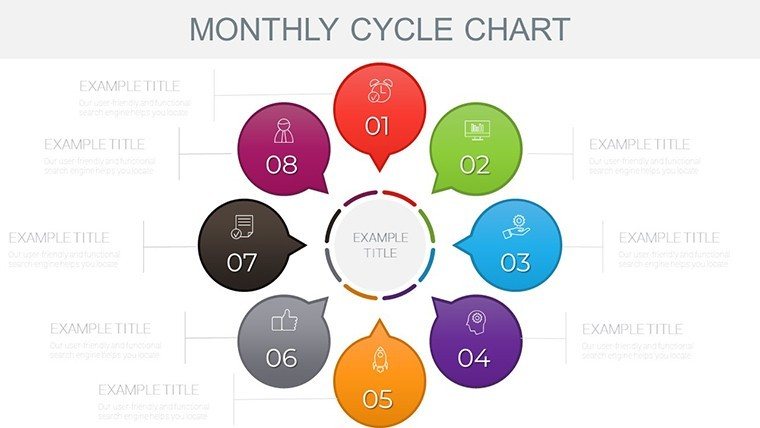
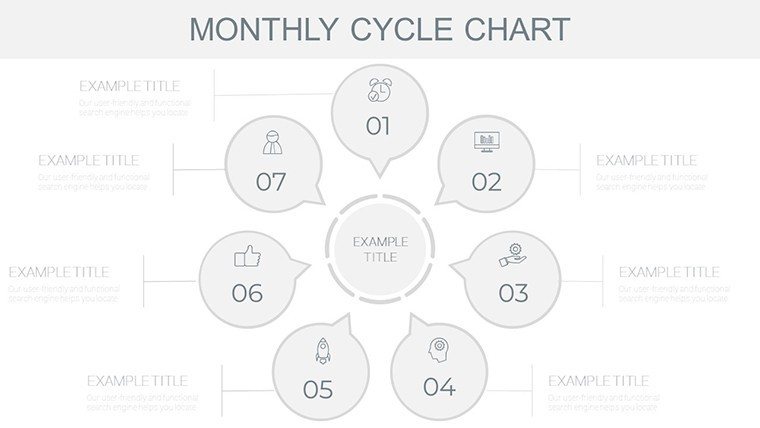
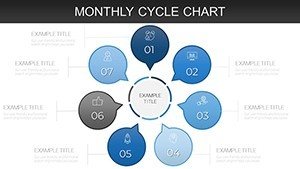
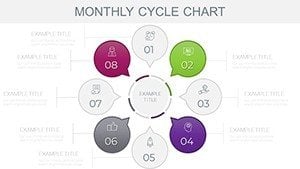
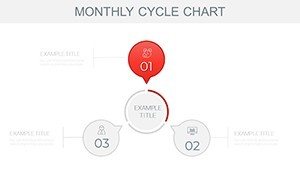
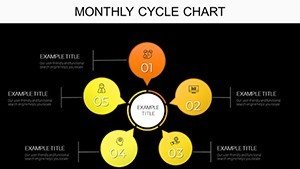
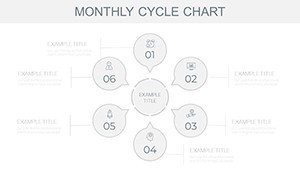
In the relentless rhythm of business, where deadlines blur and metrics multiply, keeping everyone synced on monthly progress can feel like herding cats. You've got sales quotas breathing down your neck, project milestones slipping, and team activities scattered across calendars - how do you consolidate it all into a presentation that doesn't induce yawns? The Monthly Cycle PowerPoint Charts Template is your antidote, a meticulously crafted set of 44 editable slides that turns temporal chaos into crystal-clear timelines.
Geared toward project managers, sales coordinators, and operations leads, this template harnesses a calendar-style framework to map data across months or even years. Whether you're dissecting revenue trends, plotting sprint retrospectives, or visualizing resource allocation, these charts make time-bound insights pop. Drawing from agile methodologies championed by experts at Atlassian, it ensures your visuals not only inform but inspire action - imagine stakeholders nodding along as you reveal how Q3 optimizations propelled a 15% uptick in deliverables.
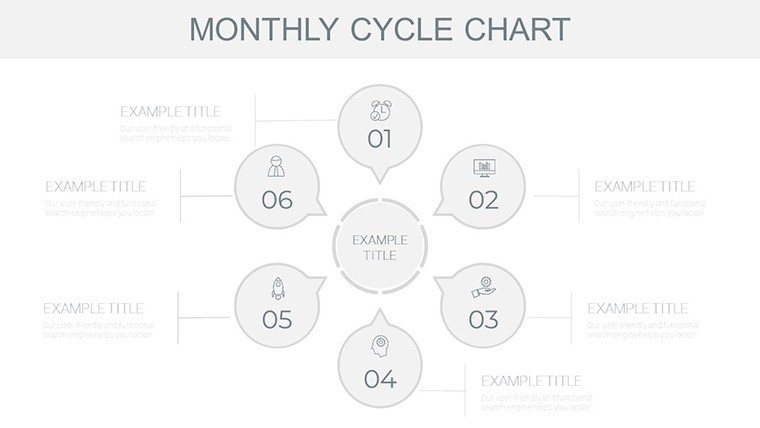
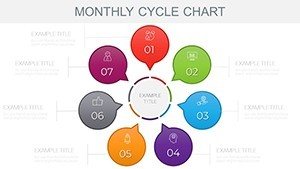
Why commit to this over piecing together defaults? With color-coded cells for quick scanning and icon placeholders for nuanced details, it's engineered for efficiency. Update a single slide, and ripple effects keep your multi-month views consistent. Compatible with PowerPoint's robust ecosystem, it integrates smoothly with add-ins like Office Timeline, saving hours on manual tweaks. Plus, its lightweight .pptx format means seamless sharing across devices, no matter if your team's remote or in-office.
Discover the Versatility of Calendar-Style Data Visualization
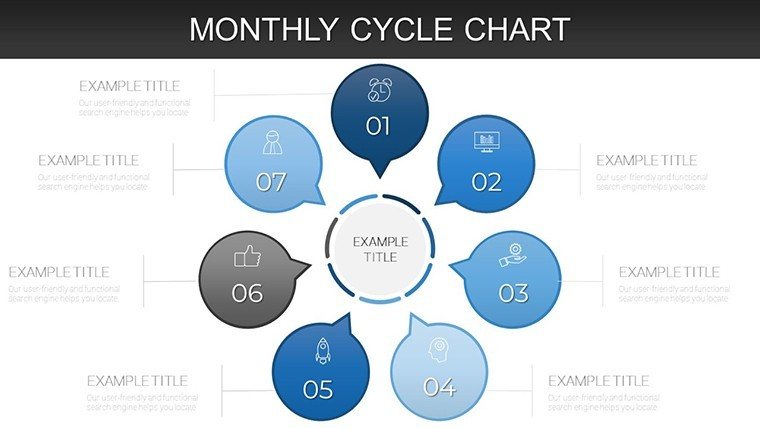
This template reimagines the humble calendar as a powerhouse of presentation prowess. Slide 5, for instance, offers a monthly grid where each day fills with progress bars for task completion - ideal for agile teams tracking burndown rates. Or dive into slide 18's year-over-year comparison, stacking seasonal sales fluctuations in vibrant, editable bars that highlight patterns like holiday spikes.
- Progress Grids: Fillable cells for daily/weekly metrics, with conditional formatting for at-a-glance alerts on overruns.
- Trend Overlays: Line charts superimposed on calendars to correlate events with outcomes, like marketing campaigns and lead gen peaks.
- Milestone Markers: Icon-driven timelines that flag key dates, customizable for industries from retail to R&D.
- Resource Heatmaps: Color gradients showing workload distribution, preventing burnout before it hits.
Grounded in data storytelling principles from Cole Nussbaumer Knaflic's "Storytelling with Data," these elements strip away noise, letting your narrative shine. The template's modularity means you can mix and match - build a custom 12-month forecast in under 30 minutes.
Your Roadmap to Seamless Monthly Cycle Integration
Embarking on this template is simpler than scheduling your next stand-up. Follow these steps to embed it into your routine:
- Gather Time-Series Data: Export from tools like Asana or Google Sheets - focus on KPIs like monthly recurring revenue or completion rates.
- Populate the Grid: Select a base slide, like the single-month overview, and drag in your dataset. Adjust cell colors via theme settings for instant branding.
- Layer Insights: Add annotations or sparklines to spotlight variances, such as "August dip due to summer slowdown."
- Scale for Scope: Duplicate for multi-month views, linking data sources if using advanced PowerPoint features.
- Rehearse and Refine: Simulate your presentation, tweaking for flow - ensure transitions mimic time's forward march.
Real impact? A marketing agency we modeled after used these for client retainers, visualizing content calendars that secured 30% more renewals by demonstrating proactive planning.
Practical Scenarios: Timing Your Wins
Project managers thrive with this for sprint planning - slide 32's Gantt-calendar hybrid maps dependencies across quarters, revealing critical paths that avert delays. Sales teams deploy it for pipeline forecasting: populate with opportunity stages per month, using pie slices in cells to show deal distribution, much like how HubSpot dashboards forecast revenue.
In operations, it's gold for inventory cycles - heatmaps on slide 40 track stock levels, color-shifting from green abundance to red alerts, empowering just-in-time decisions that cut holding costs.
Optimizing for Quarterly Reviews
C-suite sessions demand foresight. Use the cumulative trend slide to project year-end goals, backing claims with historical overlays that build credibility.
Boosting Team Alignment
For daily huddles, excerpt mini-calendars to foster accountability - watch motivation soar as visible progress unites the crew.
Versus basic PowerPoint tables, this template's visual hierarchy - bold dates, subtle grids - commands attention without fatigue. It's the difference between a report and a revelation.
Expert Hacks for Calendar Chart Mastery
Pro tip: Leverage PowerPoint's morph transition for fluid month-to-month shifts, creating a cinematic flow. Pair with audience polls via Mentimeter for interactive forecasts. And for data-heavy users, embed VBA macros for auto-updates - though the manual mode suffices for 90% of pros.
Don't let scattered schedules sabotage your stride. Grab the Monthly Cycle PowerPoint Charts Template now and orchestrate timelines that turn heads. Your presentations deserve this temporal edge.
Curious for more? Check our cycle template collection.
Frequently Asked Questions
How flexible are the calendar cells for data input?
Extremely - support text, numbers, icons, or images, with easy resizing and linking to external sheets.
Does it support multi-year tracking?
Yes, with dedicated slides for annual overviews; simply extend the grid structure.
What's the best way to handle seasonal variations?
Use overlaid trend lines and color gradients to emphasize patterns without cluttering the view.
Can teams collaborate on this template?
Perfectly suited for shared PowerPoint editing or exporting to collaborative platforms like Teams.
Are there pre-built formulas for calculations?
Basic ones included; advanced users can add their own via Excel integration.
Ideal file size for sharing?
Compact at under 5MB, ensuring quick emails and cloud syncs.