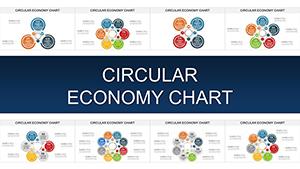
Circular Economy Charts: PowerPoint Tools for Sustainable Architecture
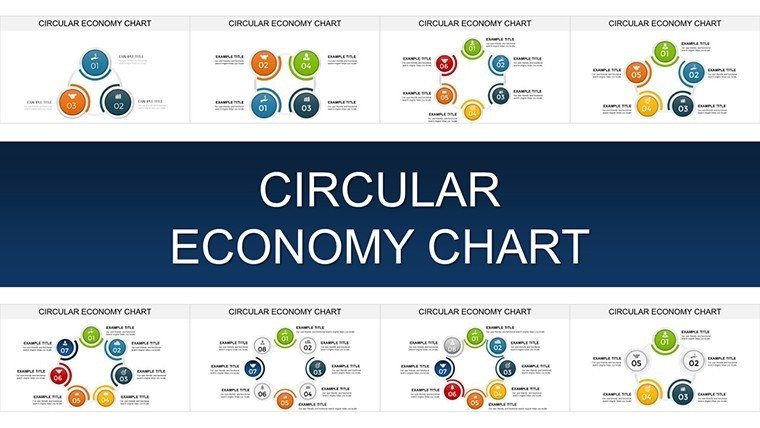


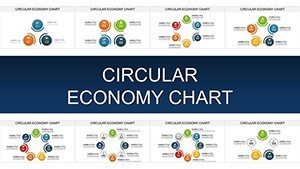


In an era where buildings consume 40% of global resources yet cradle-to-cradle thinking promises regeneration, architects are pivotal in looping waste into wealth. Our Circular Economy Charts PowerPoint Presentation, featuring 25 editable slides, equips you to visualize this paradigm shift - from linear extraction to infinite cycles of reuse. Ideal for sustainability consultants, green builders, and eco-conscious firms, this template turns abstract principles into tangible blueprints for resilient structures.
Envision interconnected pies and cycles that trace material journeys: sourcing reclaimed timber, designing modular facades, manufacturing with low-impact processes, and closing loops via disassembly for future lives. Fully tweakable in PowerPoint or Google Slides, it aligns with LEED and BREEAM standards, empowering pitches that sway developers toward net-zero visions. By spotlighting benefits like 30% cost savings through resource efficiency, it positions your work as forward-faring, not just functional.
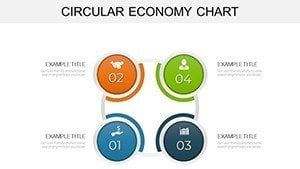
Bright, evocative palettes - earthy greens looping into solar yellows - make these charts pop, while clear text ensures accessibility for diverse audiences, from policymakers to suppliers.
Standout Features: Cycling Sustainability into Design
These 25 slides are a circular manifesto, rich in functionality.
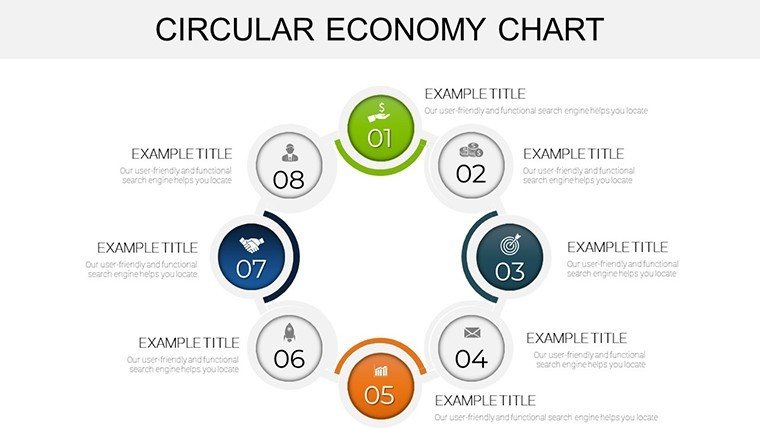
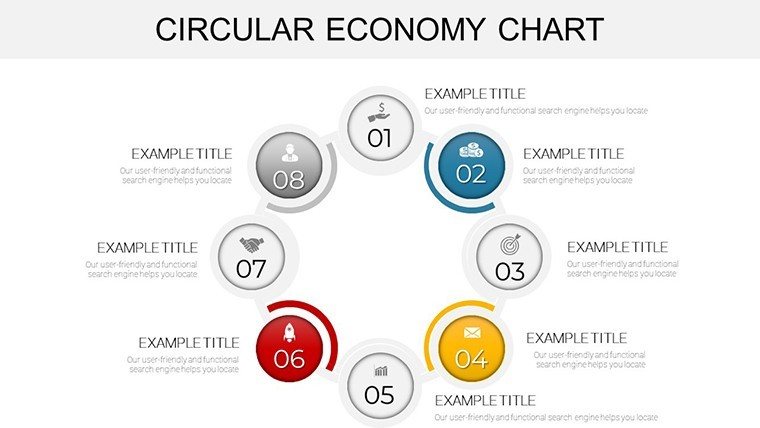
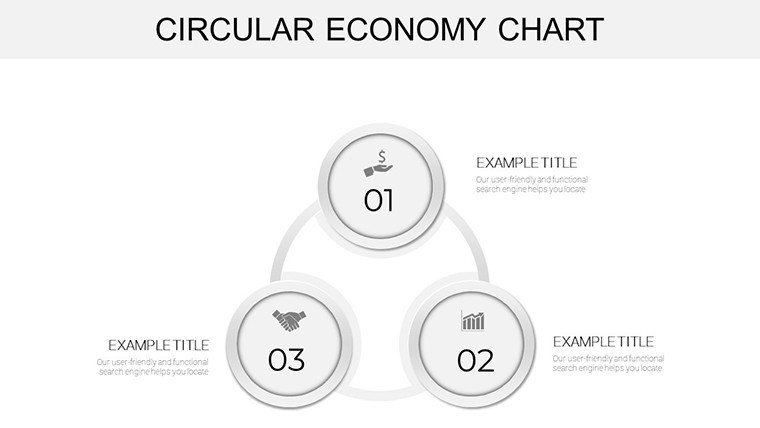
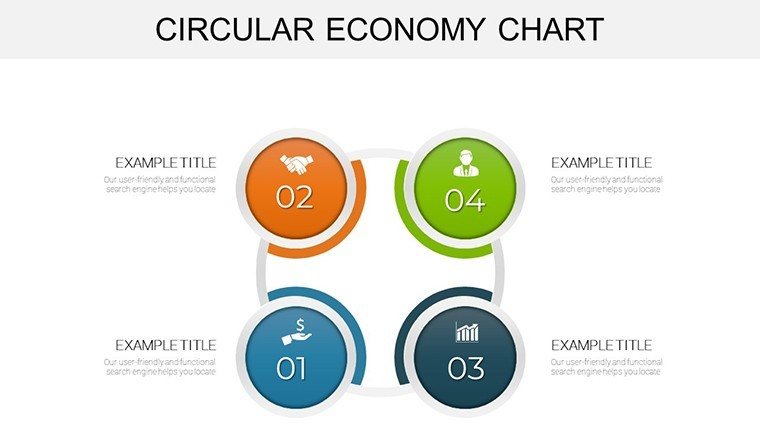
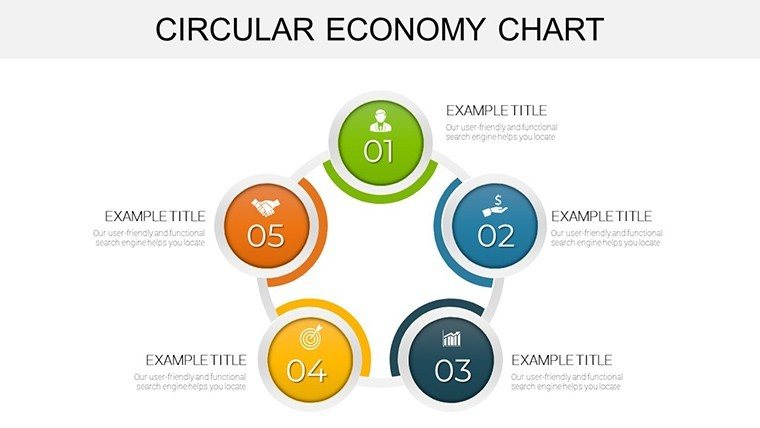
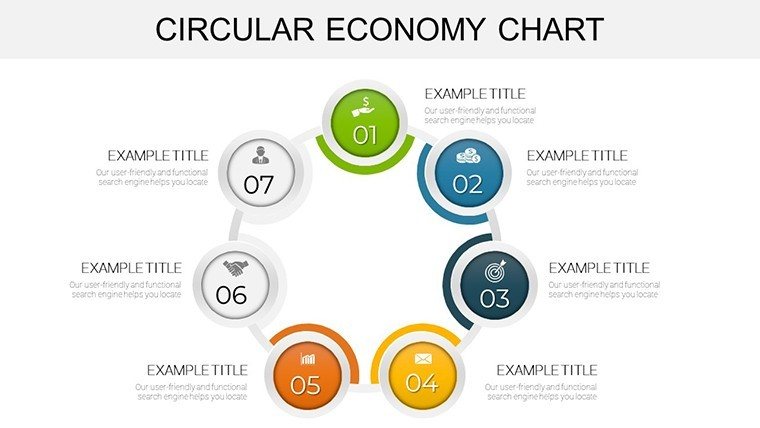
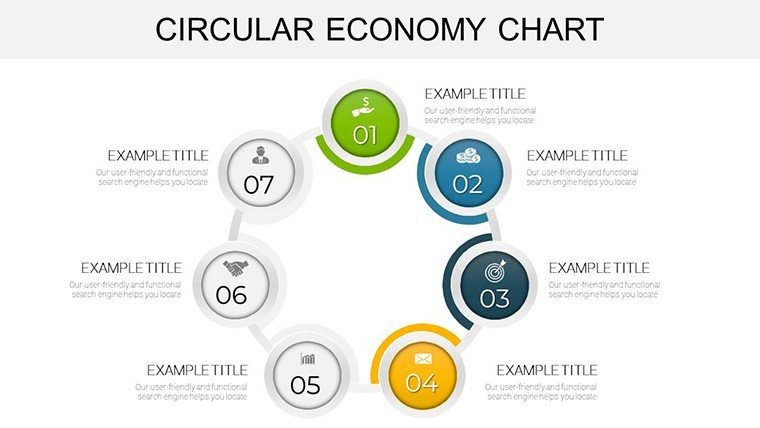
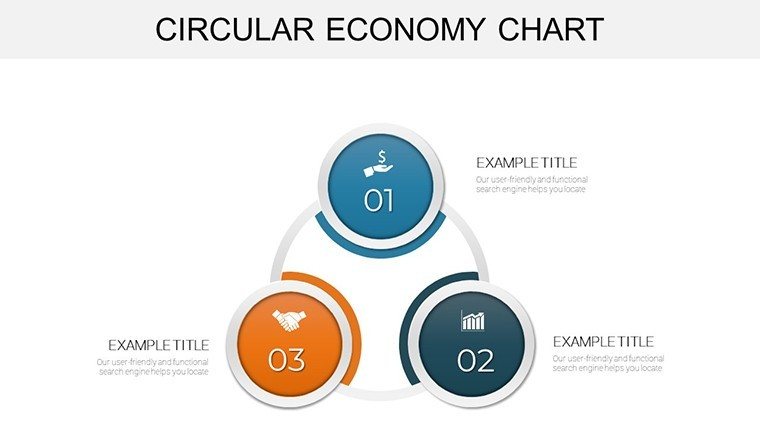
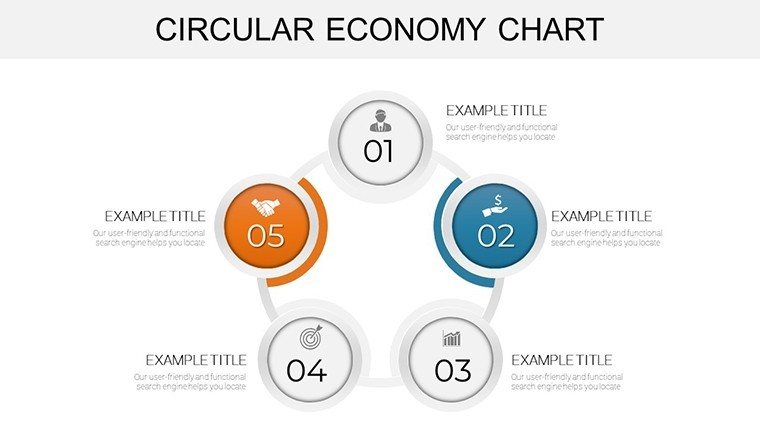
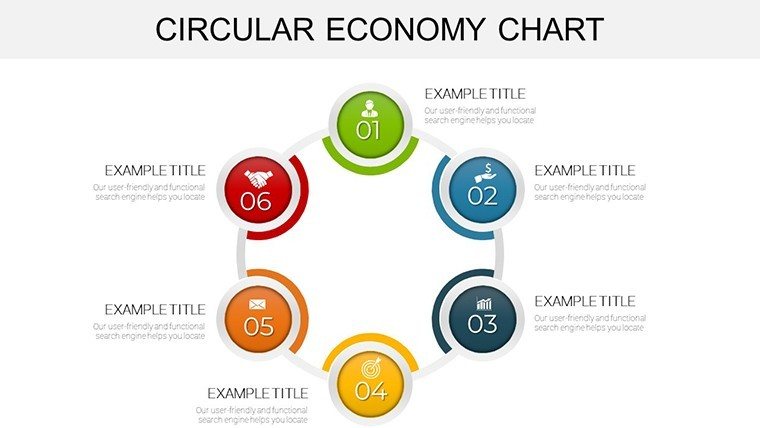
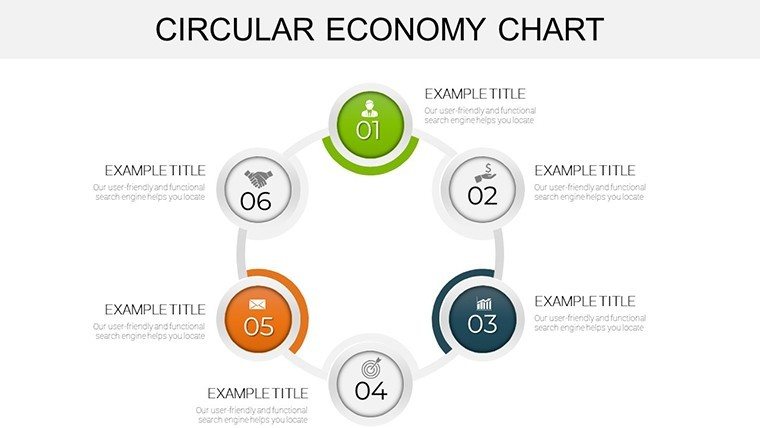
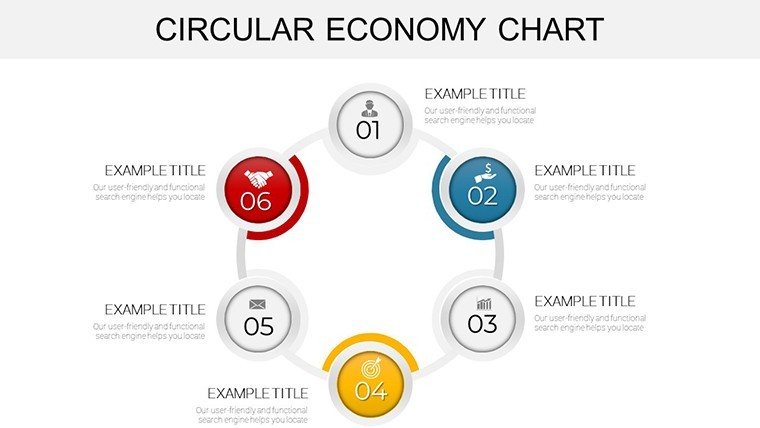
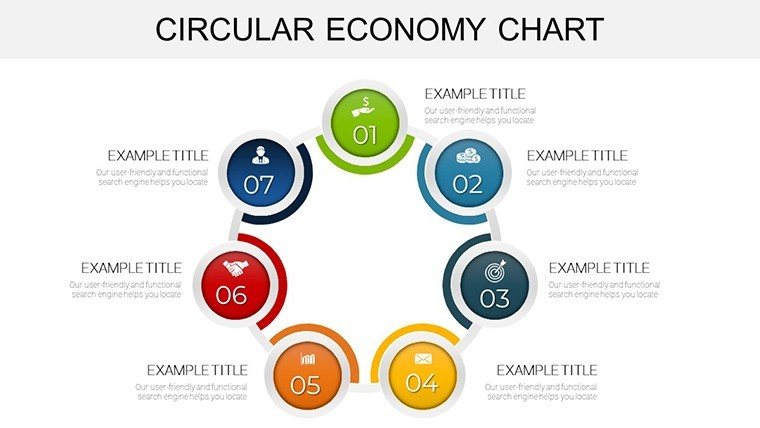
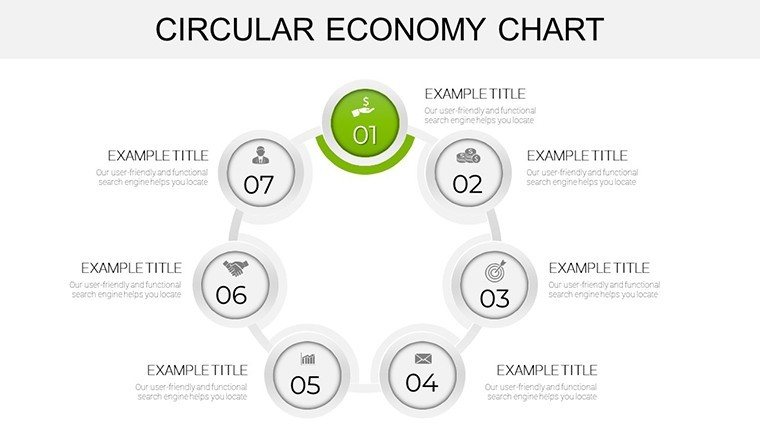
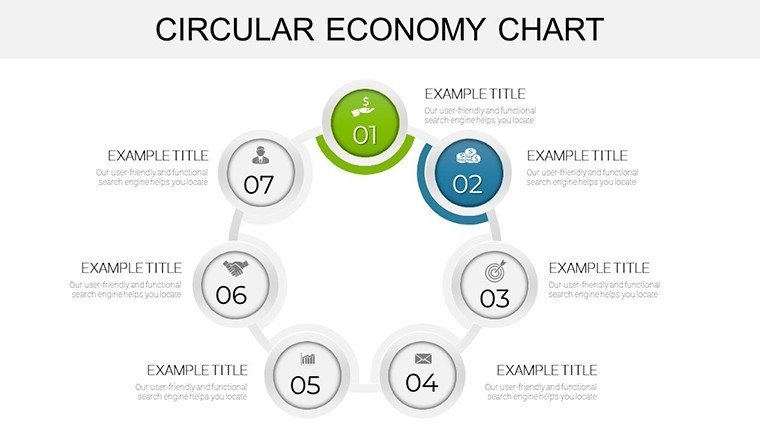
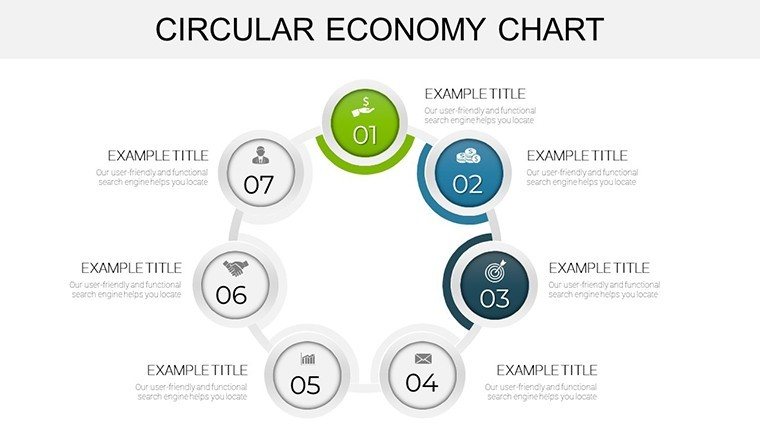
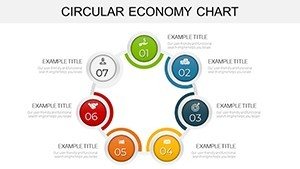
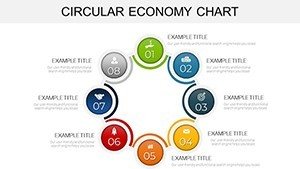
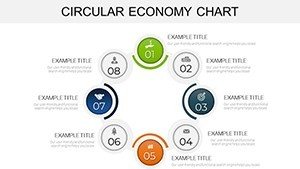
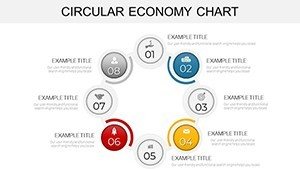
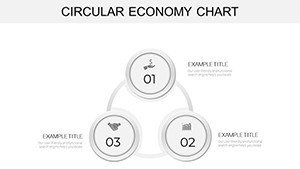
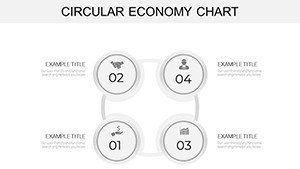
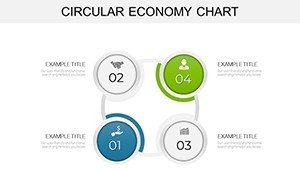
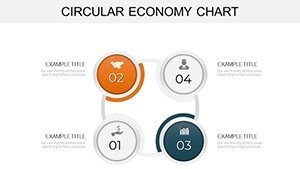
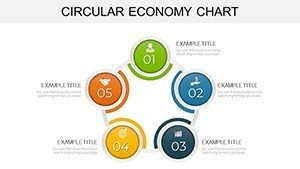
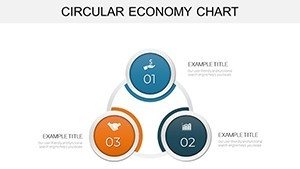
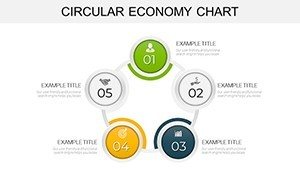
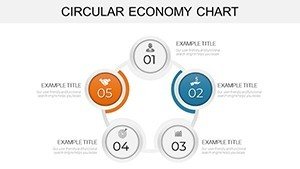
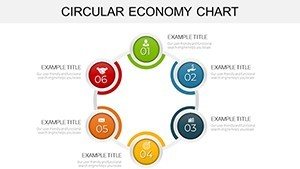
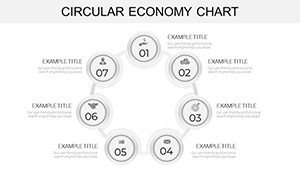
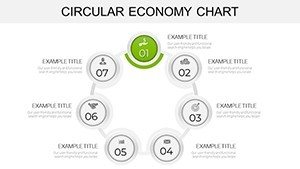
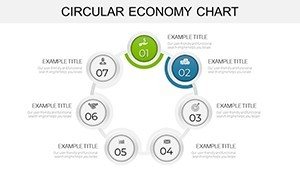
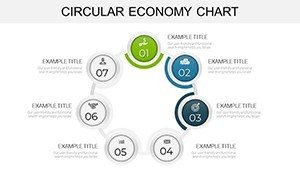
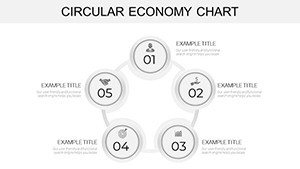
- Interlinked Diagrams: Pie-cycle hybrids for stages like design-for-disassembly and waste-to-resource flows.
- Industry Icons: 40+ bespoke graphics - recycled bricks, bio-based composites - for authentic appeal.
- Metric Mashups: Embed LCA data into radials, tracking carbon footprints dynamically.
- Modular Branding: Slot in logos and stats, with vector scalability for print or screen.
Eclipsing standard sustainability slides with its holistic loops, this template fosters deeper engagement, unlike fragmented eco-infographics.
Slide Deep Dive: Mapping the Circular Path
Slide 1 orbits with a grand economy cycle, overviewing principles. Slide 12 zooms on construction phases via segmented pies. By Slide 20, benefits burst in comparative charts, contrasting linear vs. circular impacts, ending with a visionary closer on scalable implementations.
Inspiring Use Cases: Circular in the Built World
Consider Edenica's London repository, where salvaged materials fuel new projects - our charts could map its ecosystem, highlighting reuse cascades.
- Green Proposals: Cycle material sourcing to underscore ethical sourcing in bids.
- Workshop Facilitation: Interactive pies for brainstorming disassembly strategies.
- Policy Advocacy: Data loops to lobby for circular incentives.
Integrate with tools like Autodesk for 3D cycle simulations, amplifying your advocacy.
Insights and Tips: Greening Your Presentations
Infuse AIA sustainability cred by referencing verified metrics. Animate loops clockwise for intuitive flow, and add levity - "Circular: Because straight lines are so last century." Optimize alts like "Circular economy pie chart for architectural material reuse."
Loop into legacy - grab this template today and architect tomorrow's circles.
Frequently Asked Questions
Q1: How customizable are the circular diagrams?A: Completely - resize, recolor, and relink data points freely.
Q2: Does it cover specific industries like construction?A: Yes, with tailored examples for built environment applications.
Q3: Compatible with Google Slides?A: Seamless import and editing.
Q4: Are there metrics for environmental impact?A: Built-in placeholders for LCA and carbon calcs.
Q5: Can I use it for non-architecture sustainability talks?A: Versatile for manufacturing or policy, with adaptable icons.
Q6: What's the focus on economic benefits?A: Dedicated slides quantifying savings and efficiencies.