Safe Period Charts: Your Ultimate PowerPoint Guide to Cycle Awareness


Type: PowerPoint Charts template
Category: Cycle, Relationship
Sources Available: .pptx
Product ID: PC00903
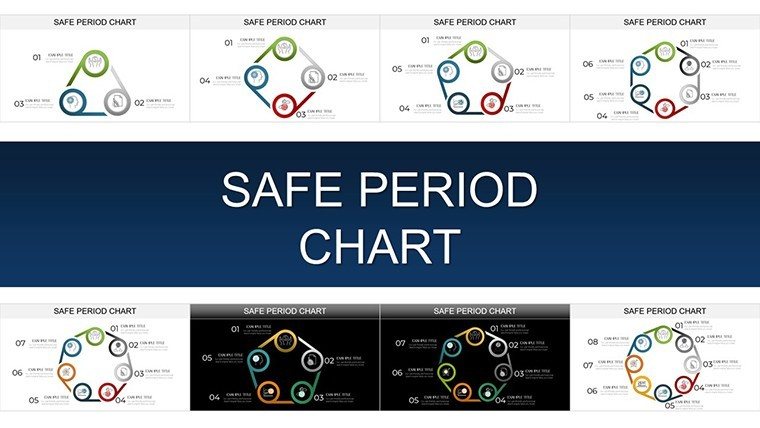
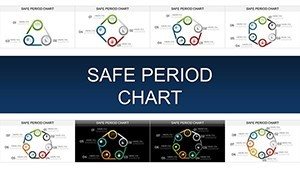
Template incl.: 45 editable slides
Navigating the rhythms of life - whether planning a family, teaching reproductive health, or simply understanding your body's signals - starts with clarity. Our Safe Period Charts PowerPoint template, with 45 editable slides, demystifies menstrual cycles through intuitive, color-coded visuals that make complex biology accessible and empowering. Designed for educators, healthcare pros, couples, and anyone embracing fertility awareness, this guide isn't just charts; it's a conversation starter for informed choices.
From the fertile window's red alerts to the safe phases in soothing greens and blues, these slides map a standard 28-day cycle while offering tweaks for variations. Compatible with PowerPoint and Google Slides, they're perfect for workshops, counseling sessions, or personal trackers. Imagine transforming a dry health seminar into an engaging dialogue, where participants grasp ovulation peaks via animated timelines - boosting retention by up to 85% when paired with real-life applications.
Rooted in WHO-endorsed methods, it highlights natural family planning's non-invasive appeal, effective for avoidance or conception when tracked diligently. Slides include legends, symptom trackers, and comparison grids, ensuring your presentation resonates across audiences - from teen education to preconception consults.
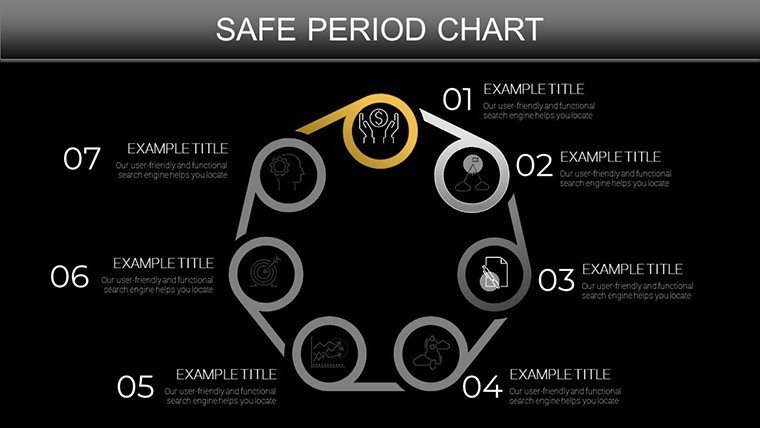
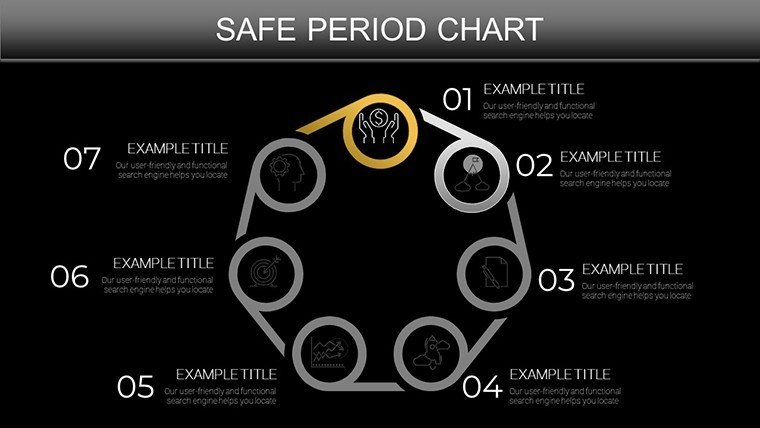
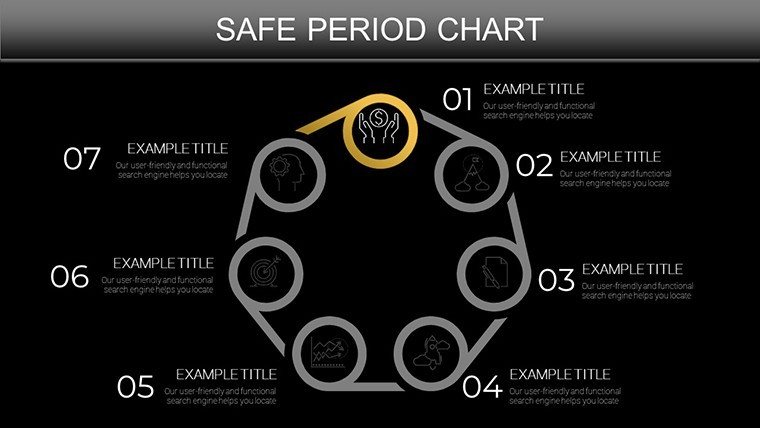
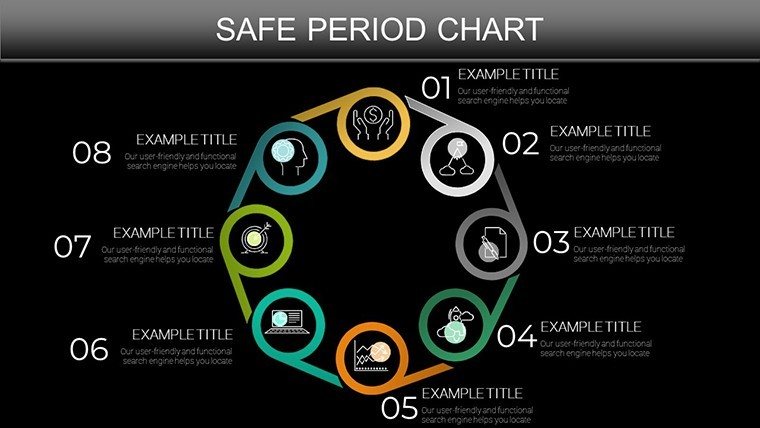
Essential Features: Crafting Clear Cycle Visuals
Packed with user-friendly tools, these 45 slides prioritize simplicity and science.
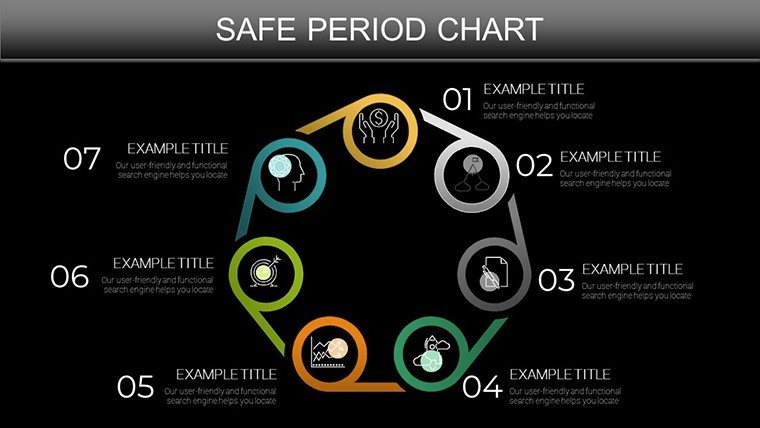
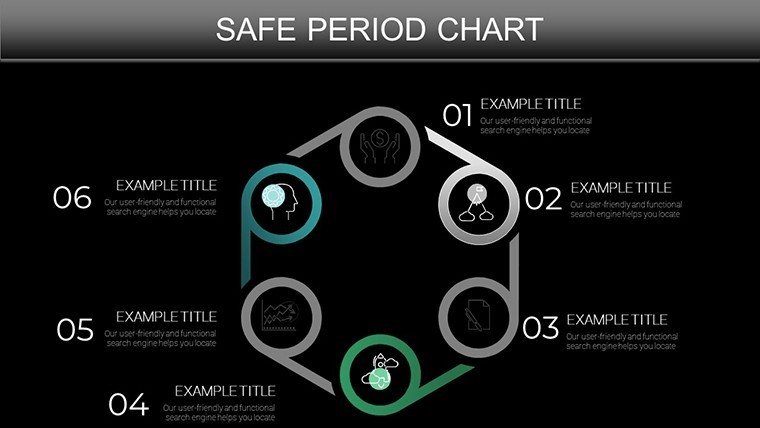
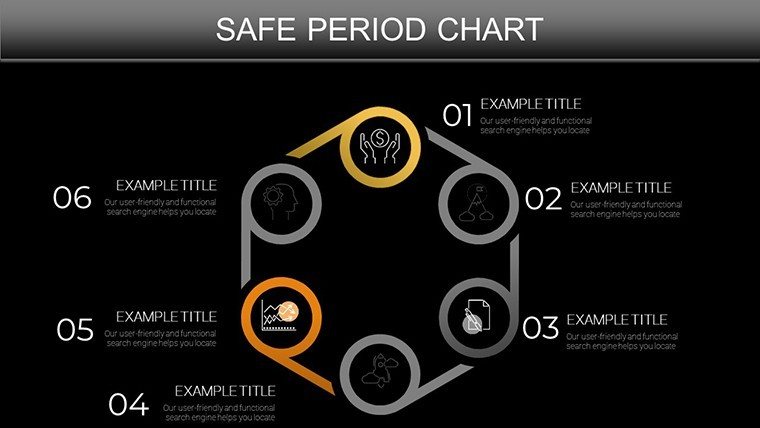
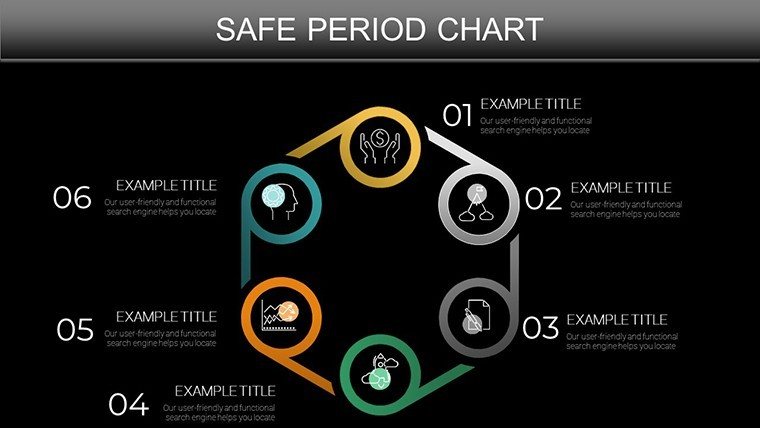
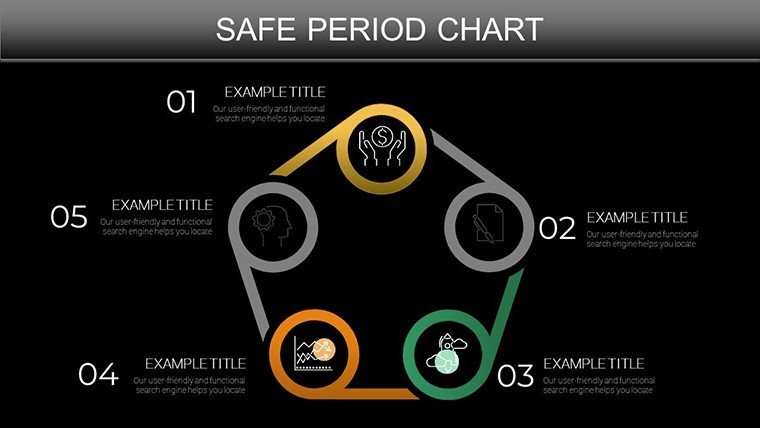
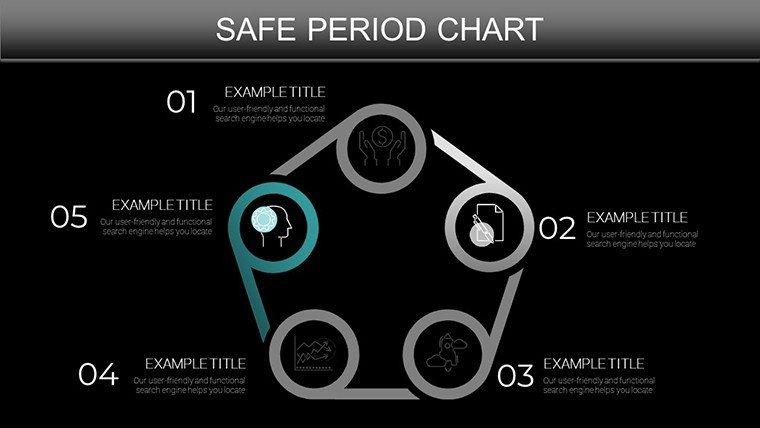
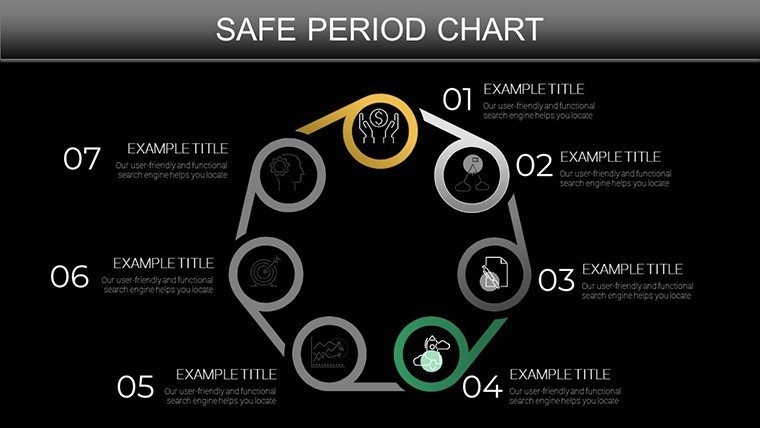
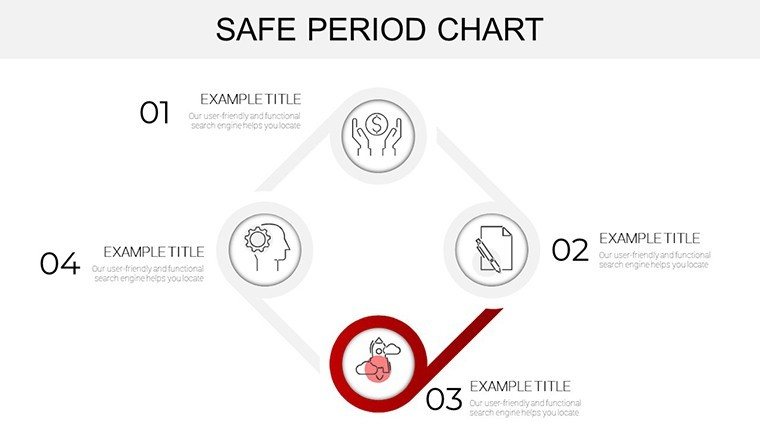
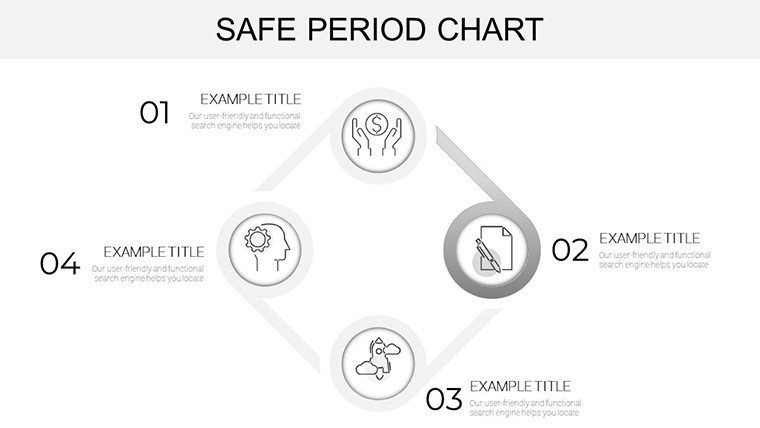
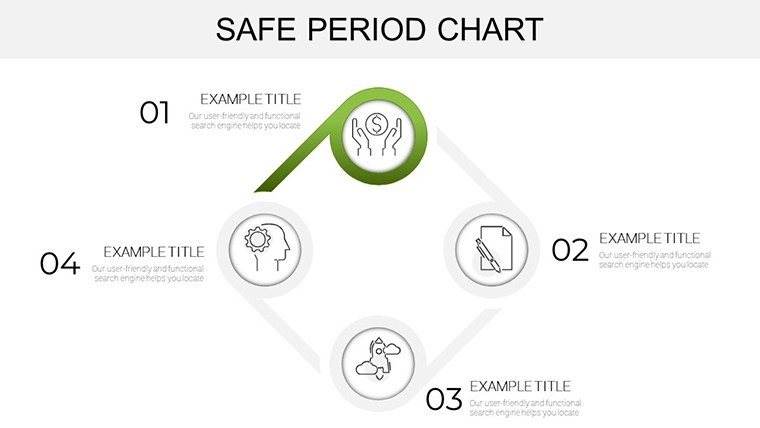
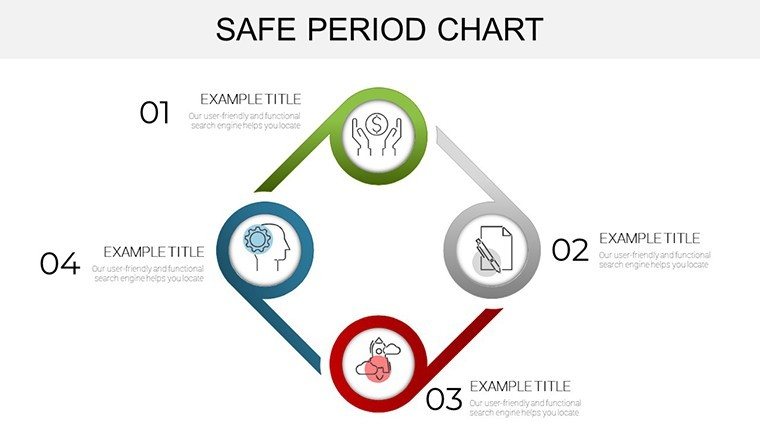
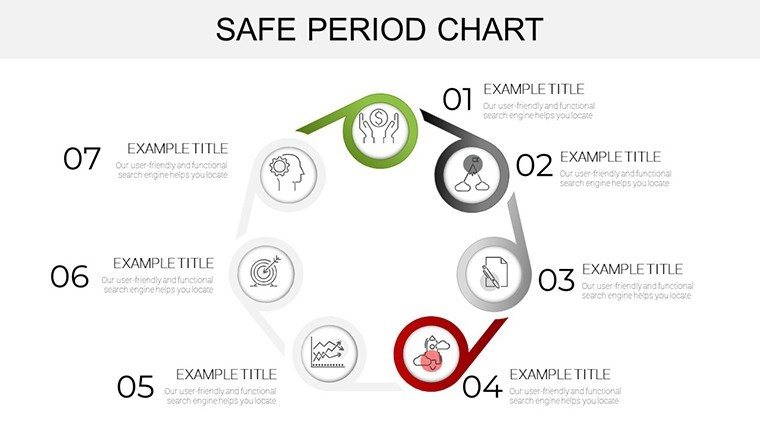
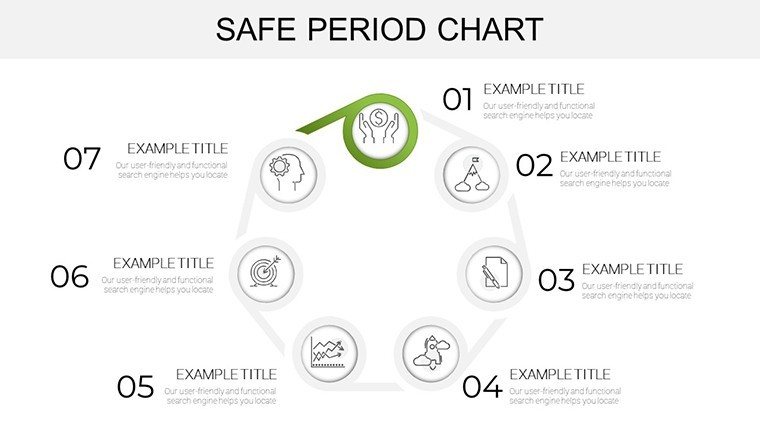
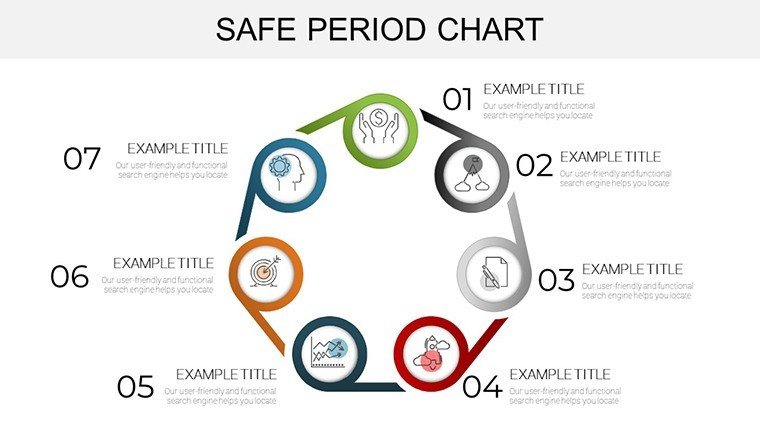
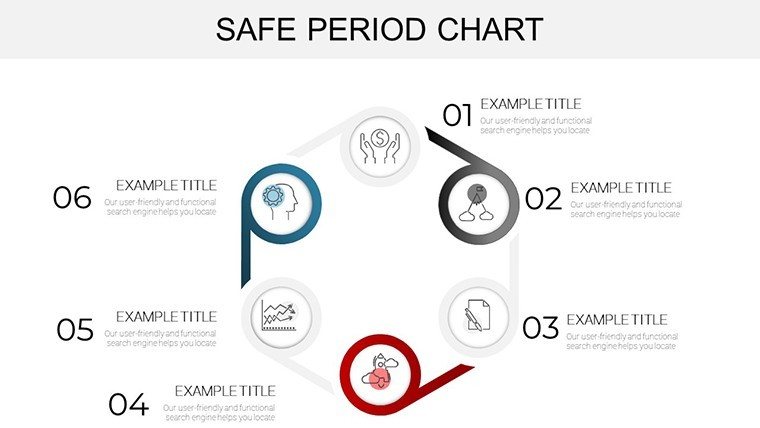
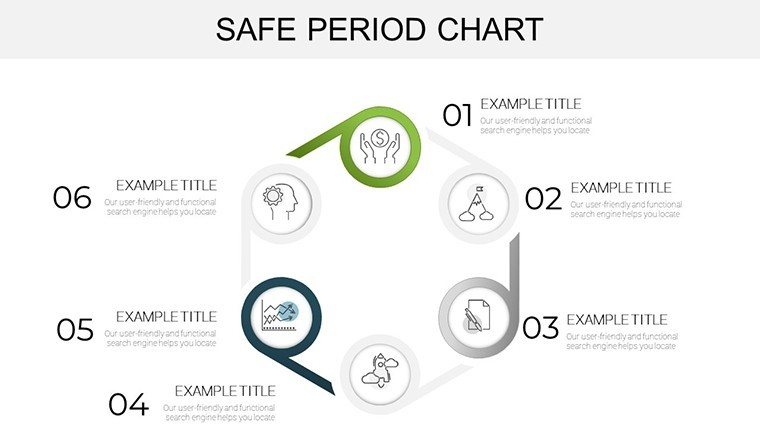
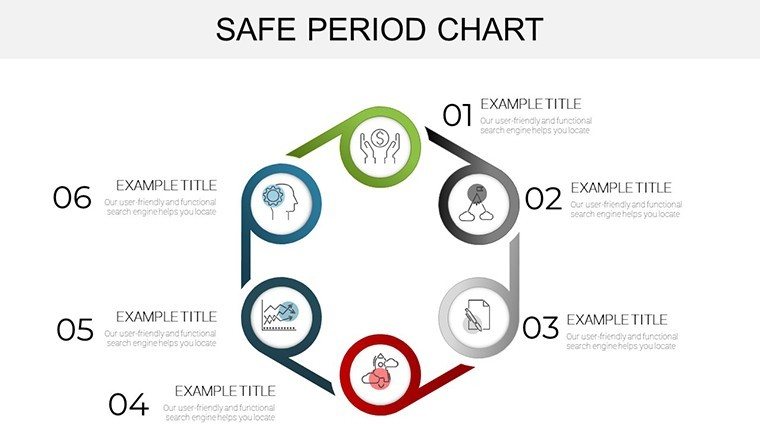
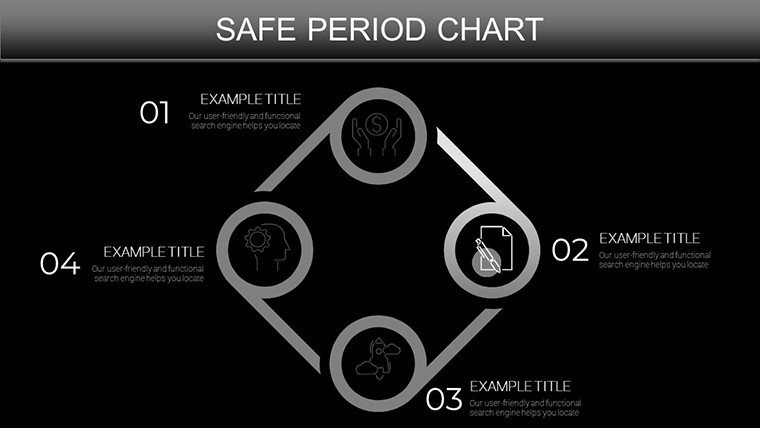
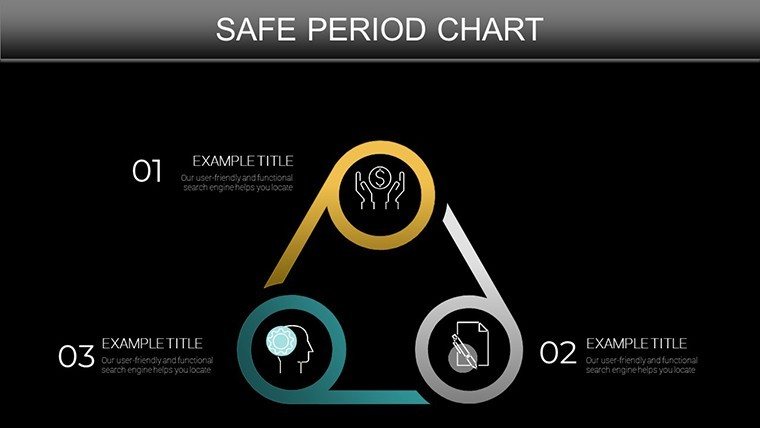
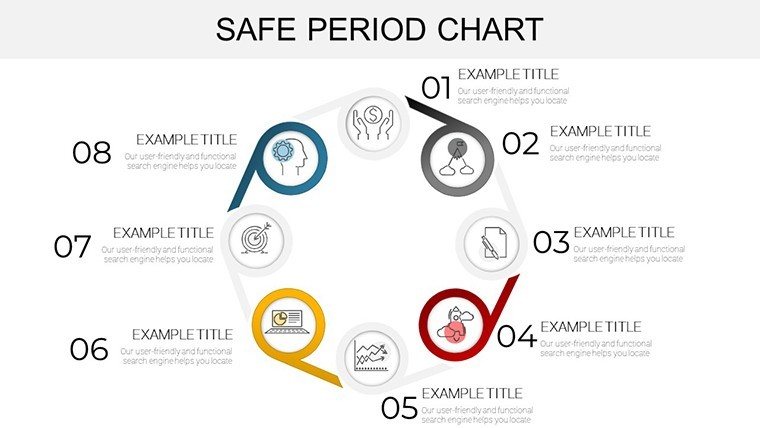
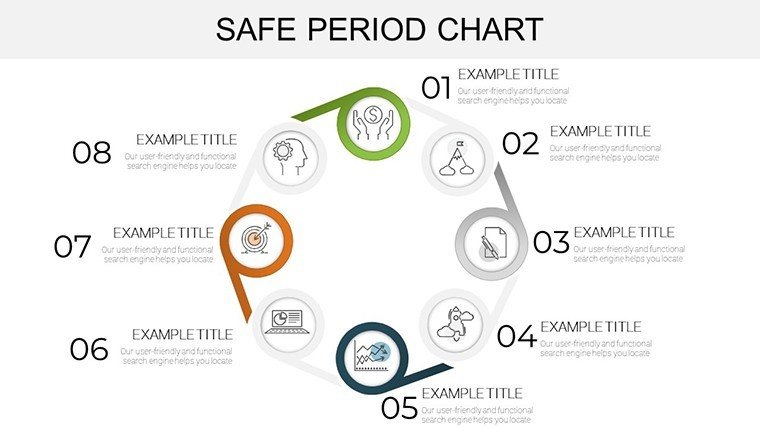
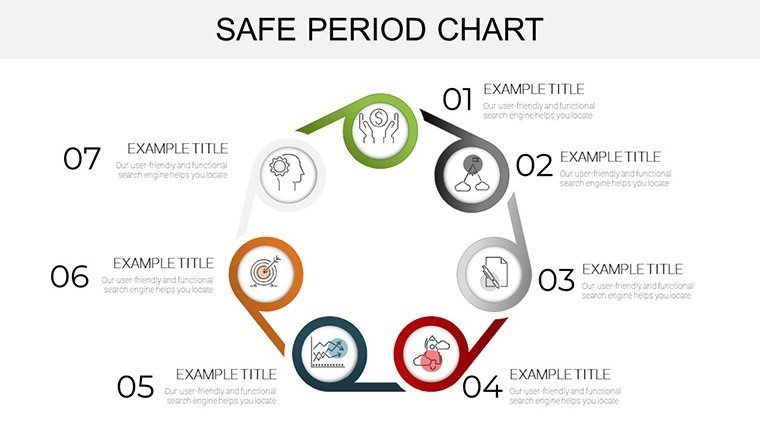
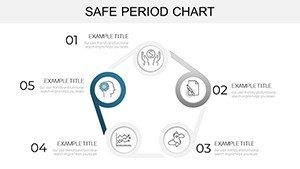
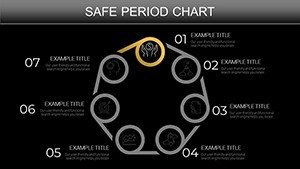
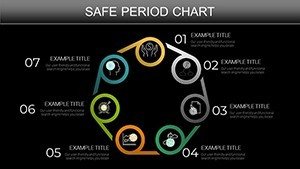
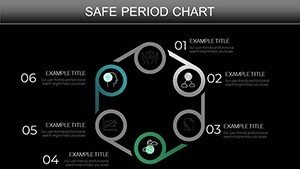
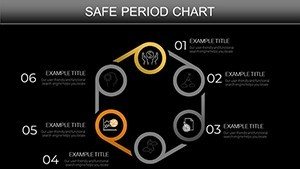
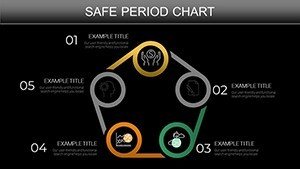
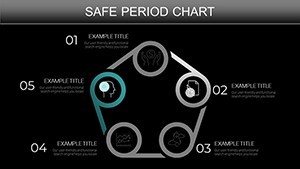
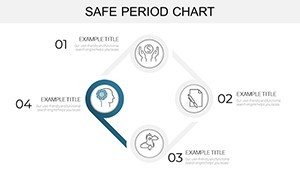
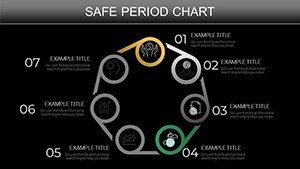
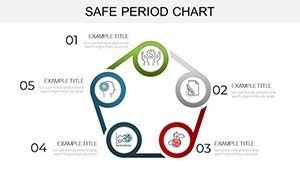
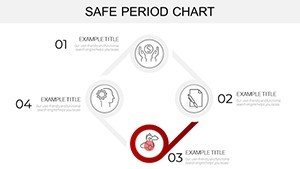
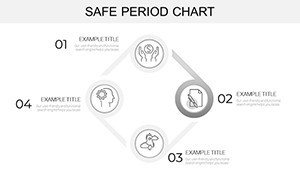
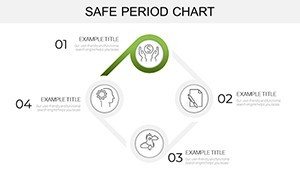
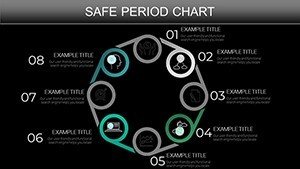
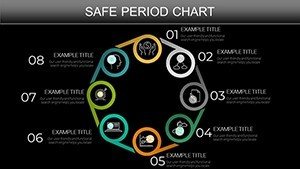
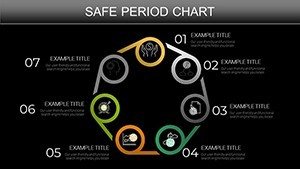
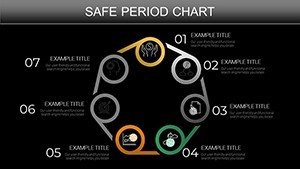
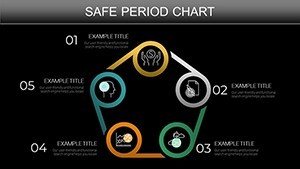
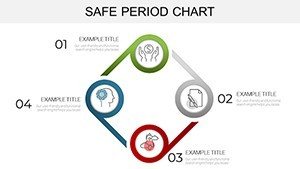
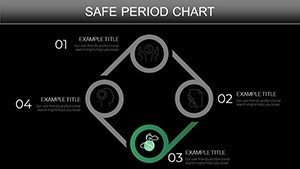
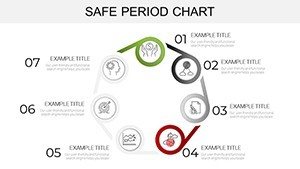
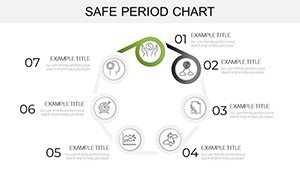
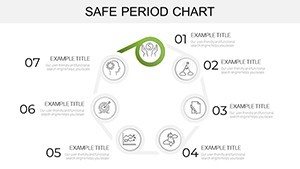
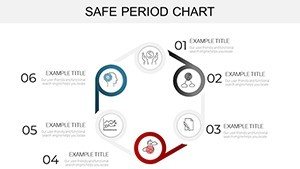
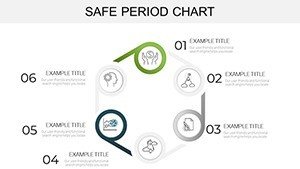
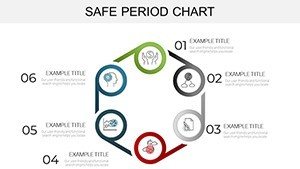
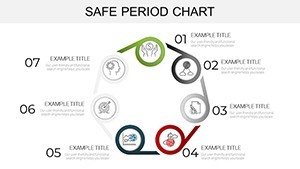
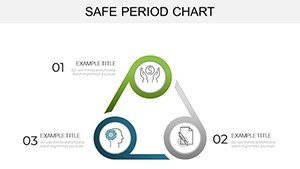
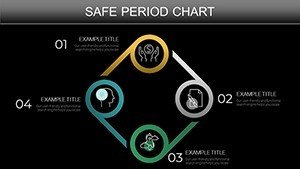
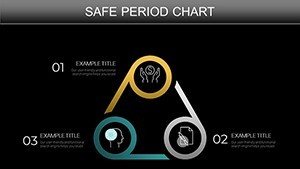
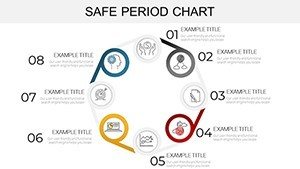
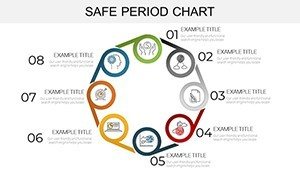
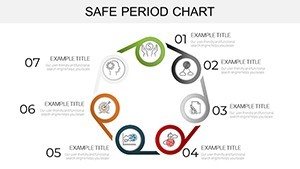
- Color-Coded Calendars: Red for fertile days, green/blue for safe periods, with ovulation stars for pinpoint accuracy.
- Adjustable Templates: Scale for 21-35 day cycles; add basal temp or mucus notations effortlessly.
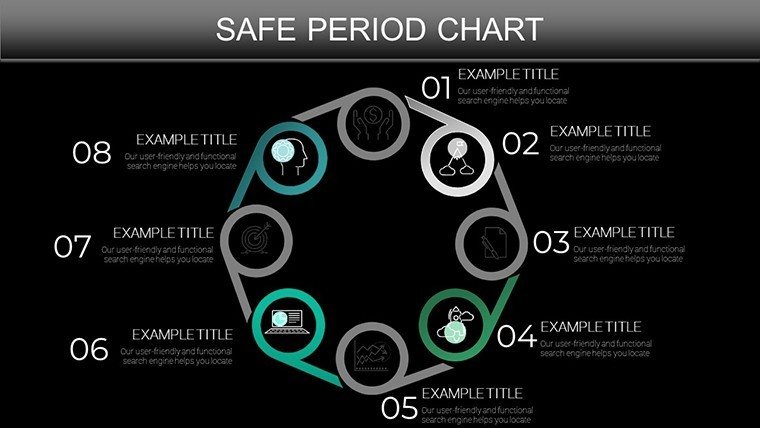
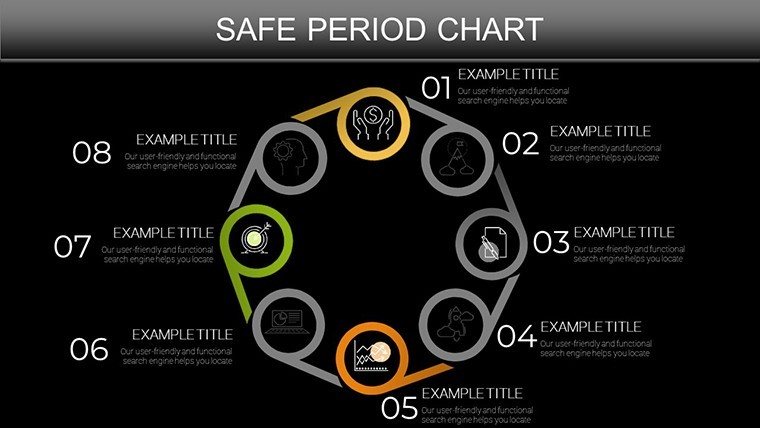
- Educational Icons: 30+ symbols for symptoms like cramps or discharge, enhancing relatability.
- Interactive Elements: Hyperlinked tabs for quick jumps between phases, ideal for digital delivery.
Outshining basic spreadsheets, this template's polished aesthetics - soft curves mimicking natural flows - make it a staple for professional talks, far beyond generic health slides.
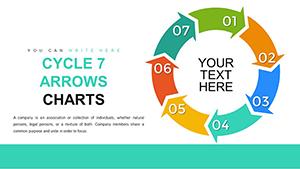
Slide Highlights: From Basics to Advanced Insights
Opening with Slide 1's cycle overview - a circular graph with phase wedges - sets a welcoming tone. Mid-pack (Slide 22), dive into benefits via infographic bursts, citing efficacy stats. Closing Slide 44? A customizable action planner, prompting users to chart their own paths.
Practical Applications: Empowering Real Lives
In educational settings, this template shines in FABM workshops, where students explore cycle charting's role in holistic health.
- Health Classes: Animate phases to teach tracking, reducing myths with evidence-based visuals.
- Counseling Aids: Personalize for clients, overlaying lifestyle factors on safe windows.
- Wellness Blogs: Export as embeds for online content, driving engagement.
Pair with apps like ClearBlue for hybrid tracking; the slides serve as printable backups, bridging digital and analog.
Design and Usage Tips: Making It Yours
Keep it conversational: Use first-person prompts like "Your Cycle, Your Story." Cite sources inline for trust, and vary pacing with pauses on key slides. For inclusivity, include diverse body representations in icons. Lighten with wit - "Cycles: Nature's original subscription service, now with visuals!"
Empower your narrative - download these free templates instantly and chart a course to greater awareness.
Frequently Asked Questions
Q1: How accurate are these safe period charts?A: Up to 85% effective with consistent use, per WHO; customize for personal cycles.
Q2: Can I adjust for irregular periods?A: Yes, slides include variable length tools and symptom adjustments.
Q3: Are animations suitable for all ages?A: Gentle and optional, focused on education over flash.
Q4: Does it cover fertility boosting?A: Absolutely, with conception window highlights and tips.