Process Infographic PowerPoint Charts Template


Type: PowerPoint Charts template
Category: Relationship
Sources Available: .pptx
Product ID: PC00893
Template incl.: 23 editable slides
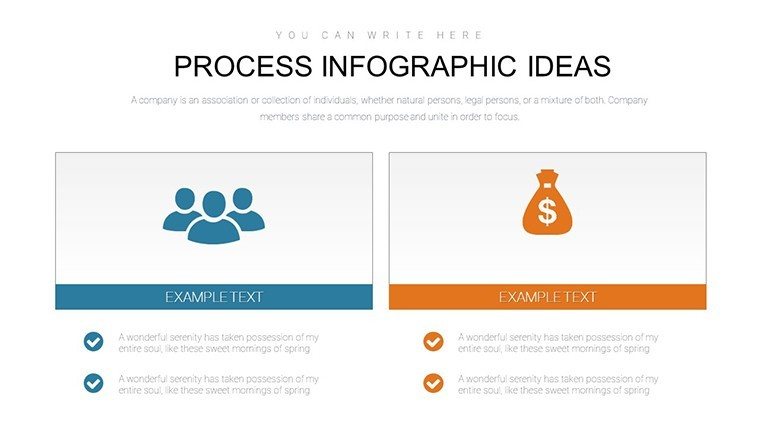
Visualizing processes can turn convoluted ideas into crystal-clear narratives, especially in fields where precision matters. Our Process Infographic Ideas PowerPoint charts template delivers just that, with 23 editable slides focused on relationship-based visuals and infographic designs. Tailored for professionals like architects who need to map out design phases or urban planners illustrating development flows, this template simplifies complex data into engaging, story-driven graphics. Say goodbye to confusing diagrams; embrace slides that guide your audience through steps with intuitive charts, ensuring your message resonates and sticks.
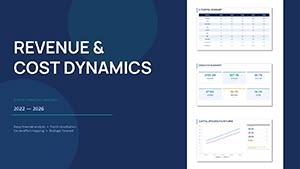
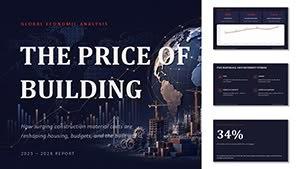
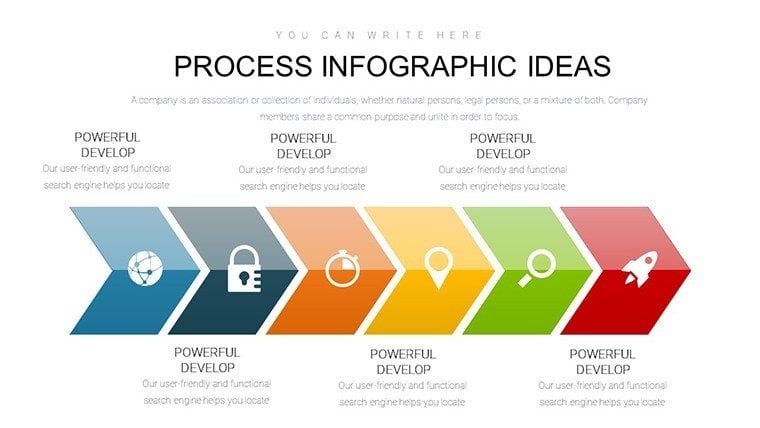
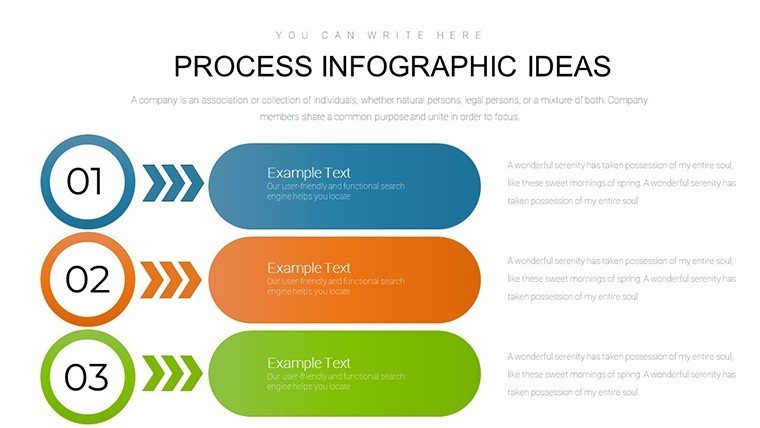
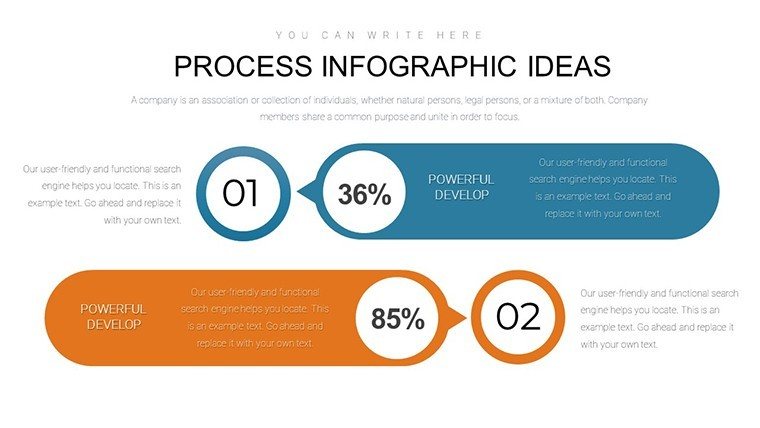
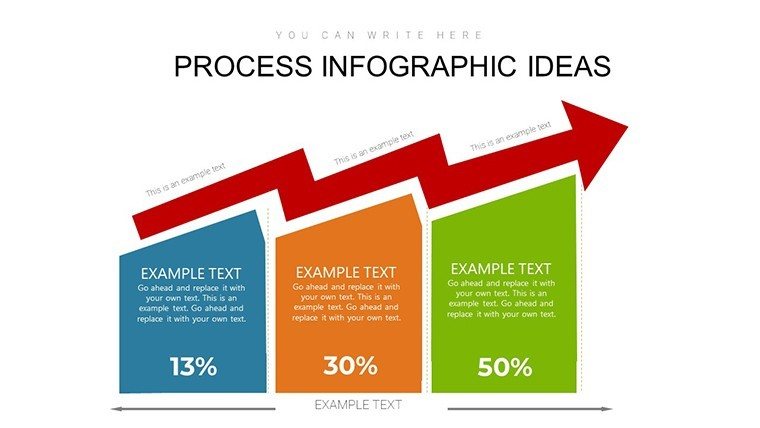
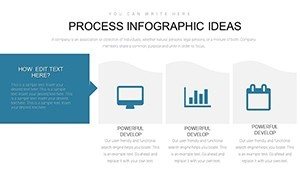
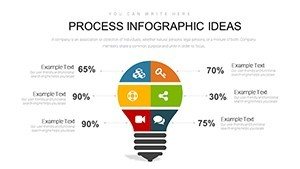
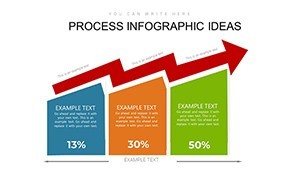
Envision presenting a building project timeline: Slide 3's flowchart breaks down phases from concept to completion, using color-coded elements for quick comprehension. Inspired by real-world applications, such as AIA-recommended process documentation, this tool helps secure stakeholder buy-in by making abstract relationships tangible.
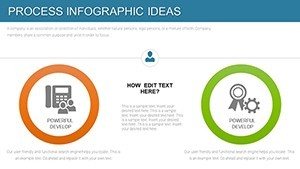
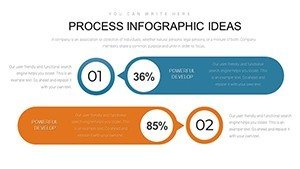
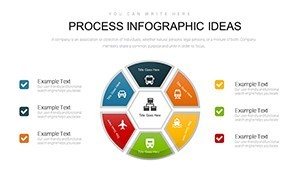
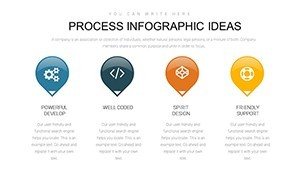
Core Features That Simplify Complex Processes
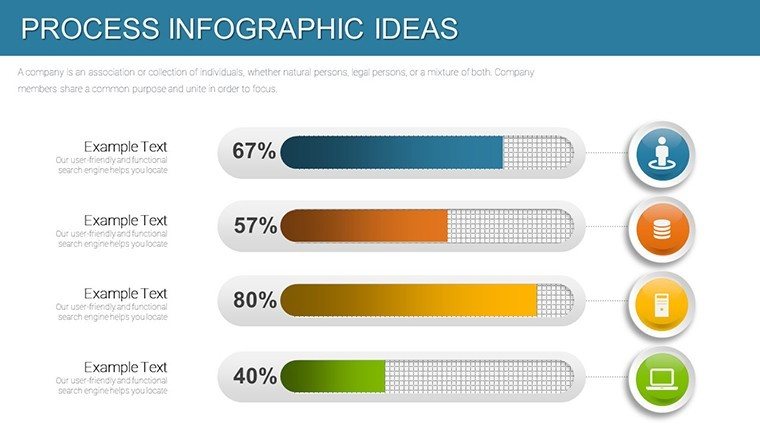
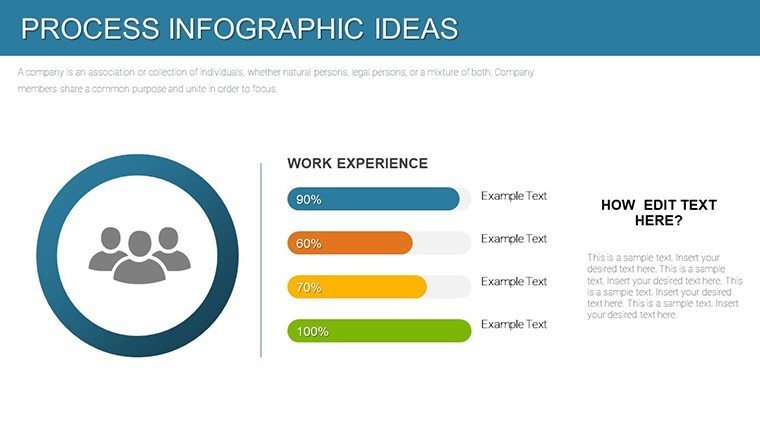
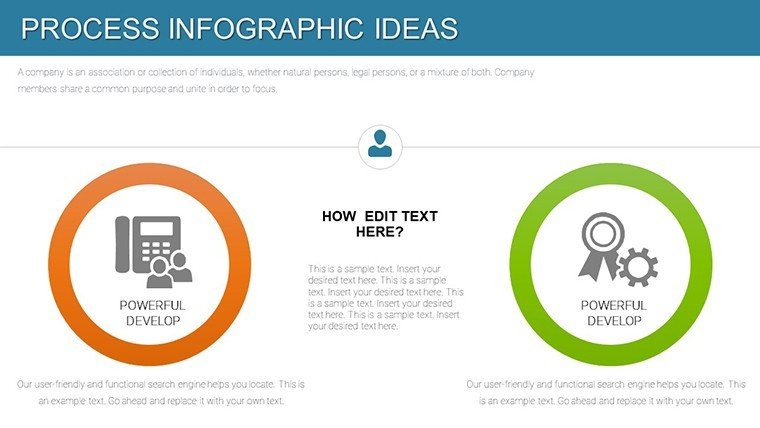
Built for efficiency, the template boasts features like map charts for regional data, side-by-side bars for comparisons, and consistent design elements for cohesive decks. Editable in .pptx format, it supports PowerPoint and Google Slides, offering flexibility for team collaborations.
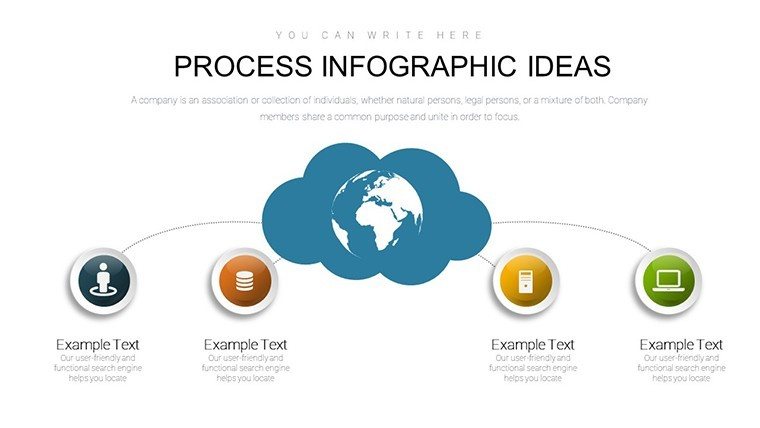
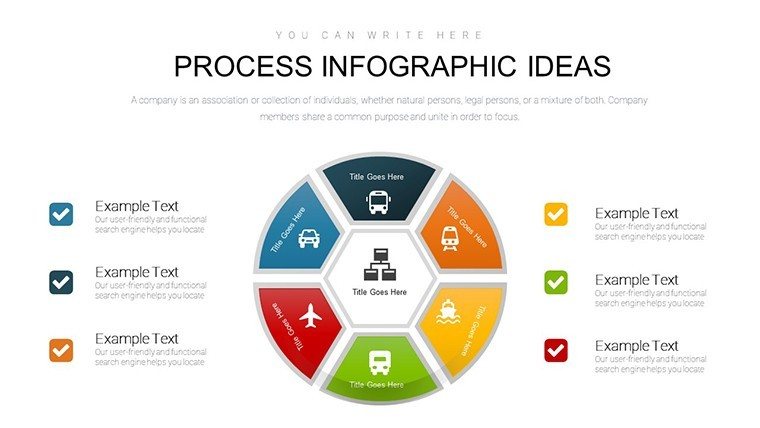
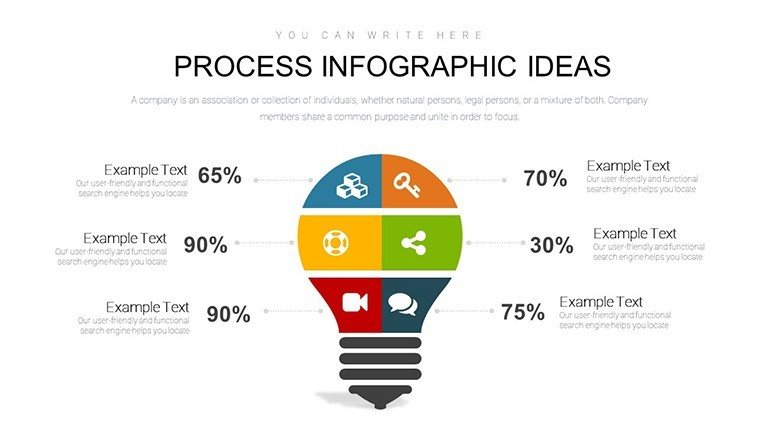
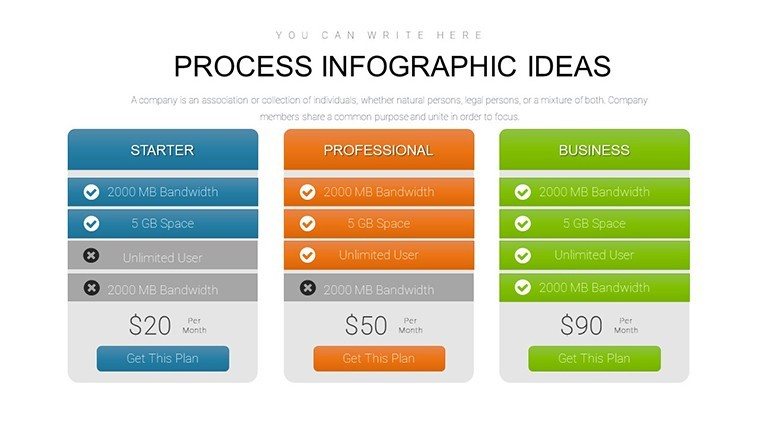
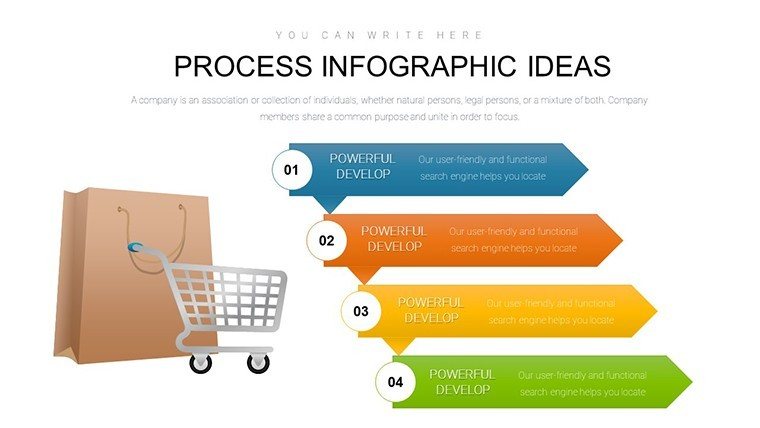
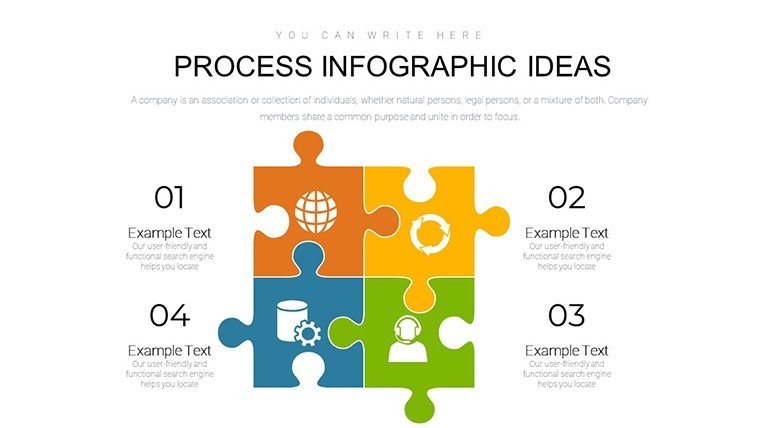
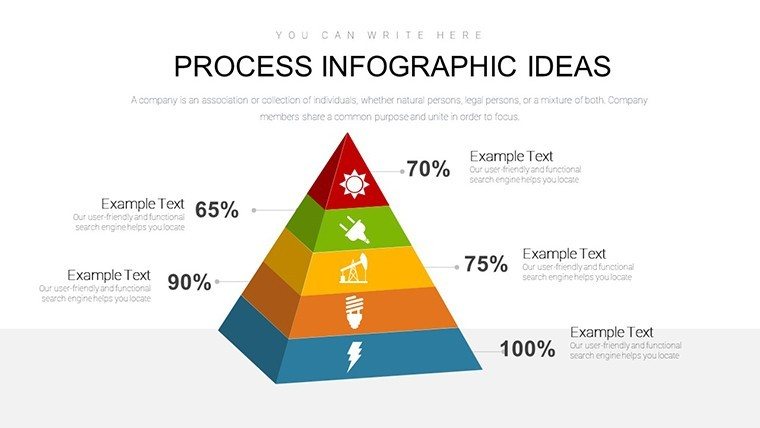
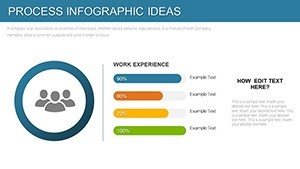
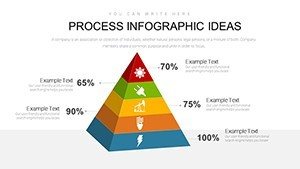
- Design Versatility: Choose from pie, bar, or line charts to fit your process narrative, with typography and color schemes that enhance readability.
- Data-Driven Insights: Input custom data to visualize relationships, like supplier chains in architecture supply management.
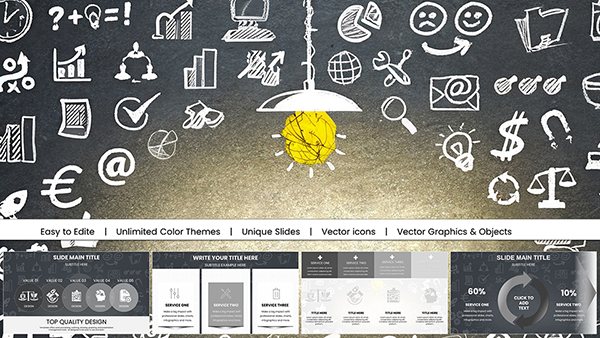
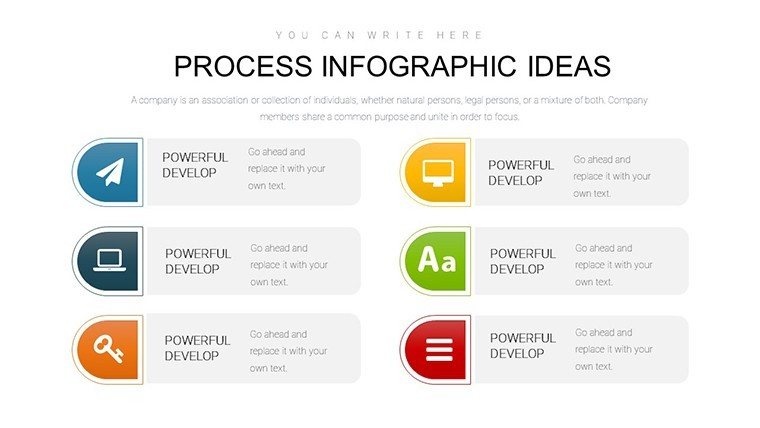
- Infographic Elements: Pre-built icons and layouts speed up creation, turning hours of work into minutes.
The benefits? Enhanced audience understanding, as evidenced by studies where infographic-heavy presentations increase retention by up to 65%. Naturally incorporating terms like "workflow diagrams" or "relationship mapping" boosts relevance without awkwardness.
Practical Applications Across Industries
In architecture, use these charts to depict sustainable design processes, showing how eco-friendly materials integrate into builds. For a case study, consider how a firm used similar infographics to streamline client approvals for a high-rise project, reducing revisions by 20%. Marketers can adapt for campaign flows, while educators teach process theories with editable examples.
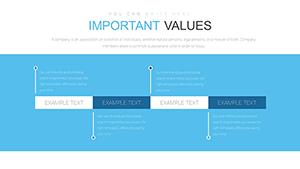
The template's relationship category shines in scenarios like team dynamics or project interdependencies, making it indispensable for multifaceted pitches.
Guided Steps to Craft Your Infographics
- Research and Plan: Gather your process data, identifying key stages and relationships.
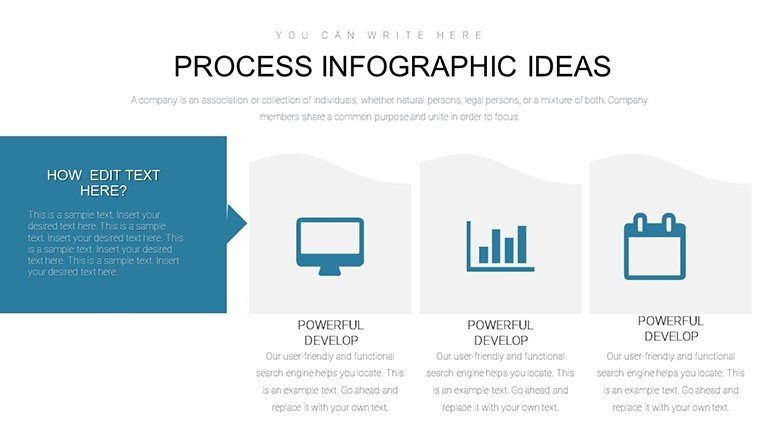
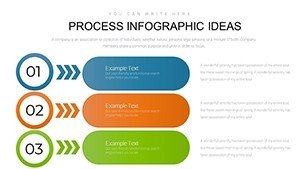
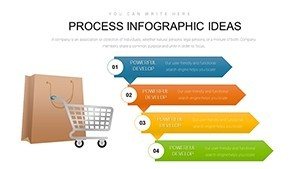
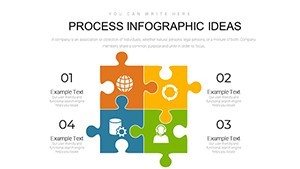
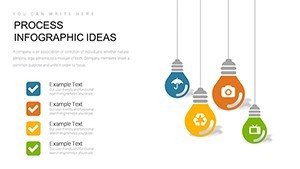
- Select Charts: Pick from 23 slides - e.g., flowcharts for sequential processes or matrices for comparisons.
- Customize Visuals: Adjust colors and add icons to align with your theme, like blueprint blues for architecture.
- Refine Messaging: Add concise text to guide viewers, ensuring each slide tells part of the story.
- Test and Present: Preview for flow, then share via links for feedback.
This method outpaces basic tools by providing themed starters, reducing design fatigue and errors in data representation.
Expert Tips for Infographic Excellence
Keep it simple: Limit to 5-7 elements per slide to avoid clutter. For architects, align with AIA visuals standards for authority. Inject creativity with subtle animations, like revealing process steps one by one, to maintain engagement in webinars. Reliability comes from the template's robust structure, supporting large datasets seamlessly.
Users in design fields praise its time-saving aspect, allowing focus on content over creation.
Stand Out with Process Mastery
Unlike generic options, this template emphasizes infographic ideas for processes, with unique layouts that inspire innovation. It's a trustworthy choice for pros seeking polished outputs without hassle.
Time to visualize your processes like never before? Secure this template and craft compelling infographics now.
Frequently Asked Questions
- How many slides are in the process infographic template?
- 23 fully editable slides, covering various chart types for comprehensive process visualization.
- Can I edit the charts for specific industries like architecture?
- Yes, all elements are customizable to fit niche needs, including colors and data inputs.
- Is it compatible with Google Slides?
- Absolutely, the .pptx format imports easily for online editing.
- What types of charts are included?
- A mix including flowcharts, maps, bars, and pies for diverse process representations.
- Are there design tips provided?
- While not in-file, our resources offer guidance on best practices for infographics.