Fishbone PowerPoint Chart Template: Master Root Cause Analysis Effortlessly


Type: PowerPoint Charts template
Category: Business Models
Sources Available: .pptx
Product ID: PC00889
Template incl.: 26 editable slides
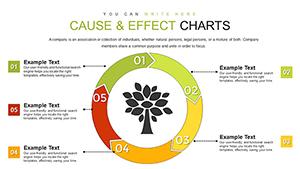
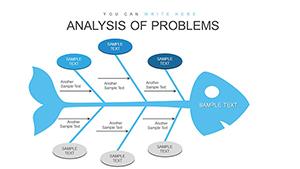
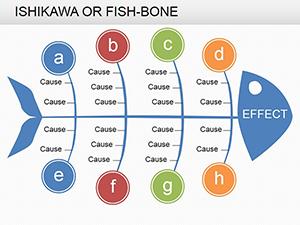
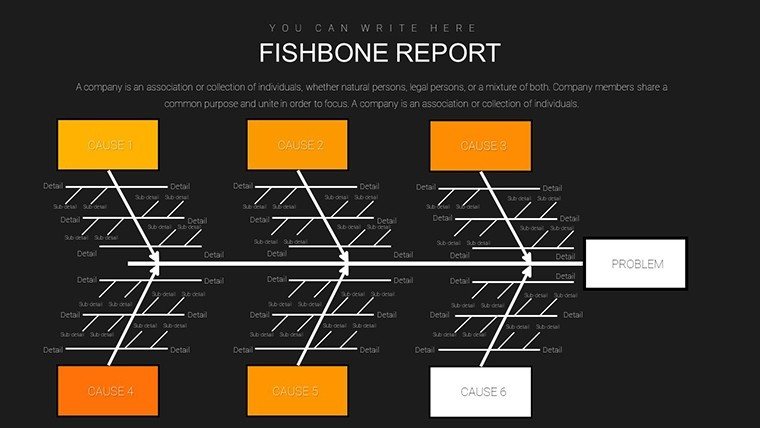
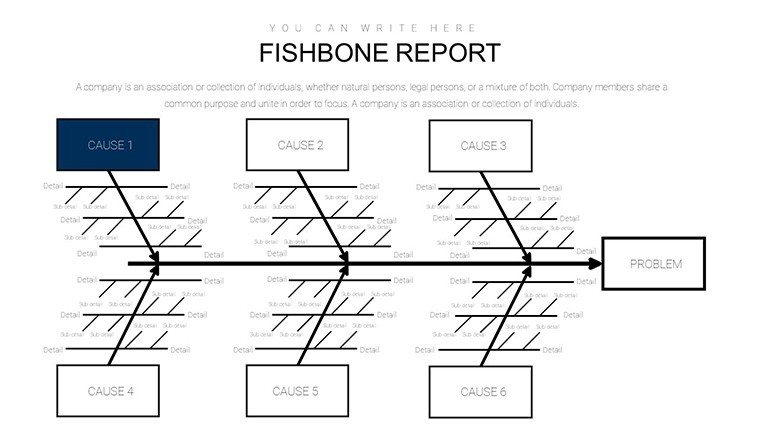
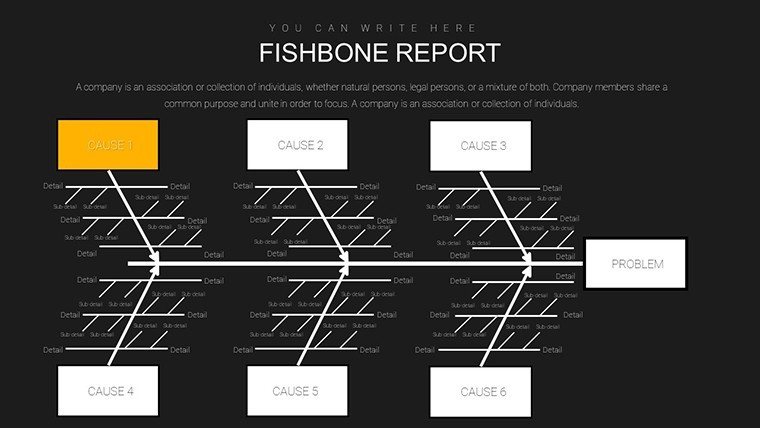
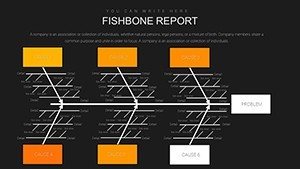
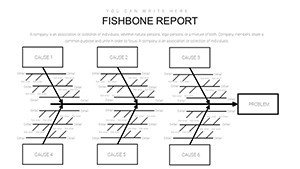
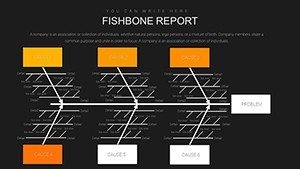
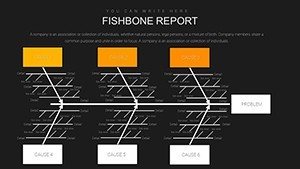
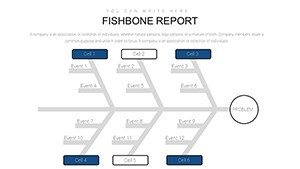
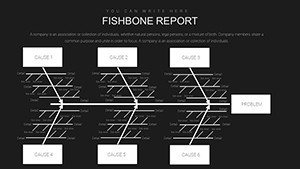
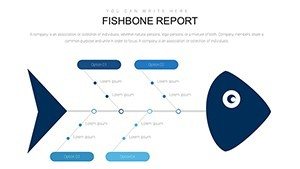
In the intricate landscape of business problem-solving, where issues often hide behind layers of complexity, the Fishbone Diagram - also known as the Ishikawa or cause-and-effect diagram - emerges as a beacon of clarity. Our Fishbone PowerPoint Chart Template empowers analysts, managers, and teams to dissect problems systematically, identifying root causes that lead to effective, lasting solutions. With 26 editable slides tailored for business models, this template is a must-have for consultants, quality control experts, and educators tackling everything from manufacturing defects to operational inefficiencies. Picture unraveling a production delay: categorize causes under manpower, methods, machines, materials, measurements, and environment, turning chaos into actionable insights.
This isn't your average diagram tool; it's a comprehensive kit that simplifies creation while amplifying impact. Fully compatible with PowerPoint (.pptx), it allows seamless edits, ensuring your presentations resonate in high-stakes meetings. Businesses worldwide, inspired by Kaizen principles from Toyota's lean manufacturing, rely on such tools to foster continuous improvement. By providing pre-structured fishbone layouts, this template cuts down preparation time, letting you focus on analysis rather than design, ultimately boosting team collaboration and decision-making.
Essential Features for In-Depth Analysis
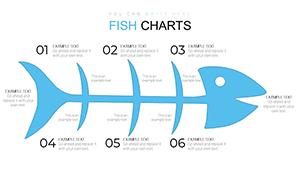
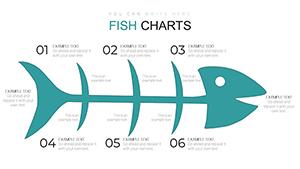
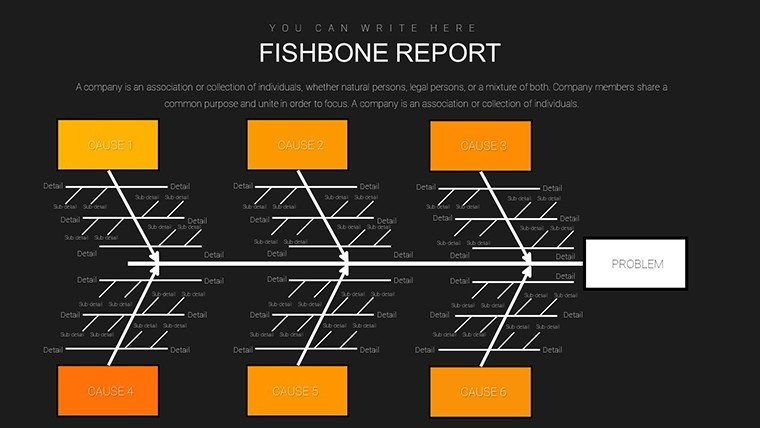
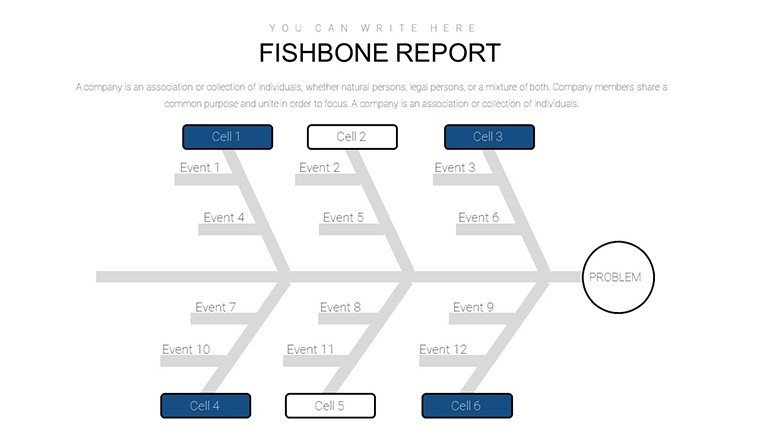
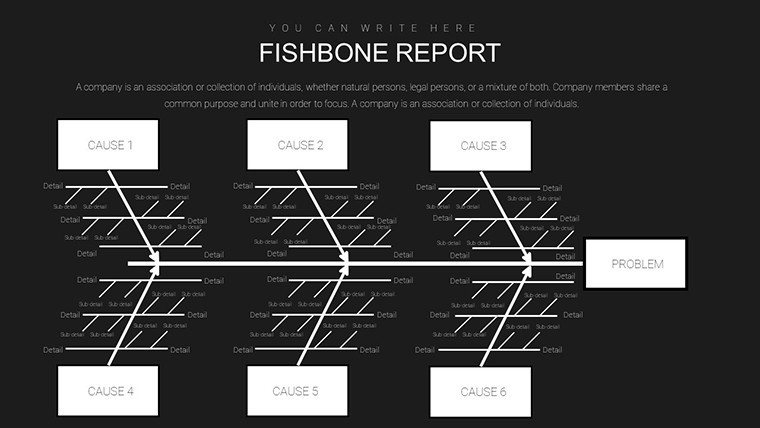
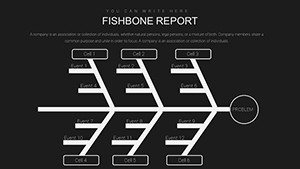
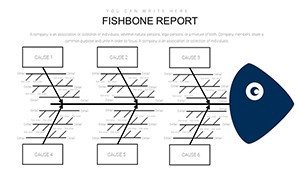
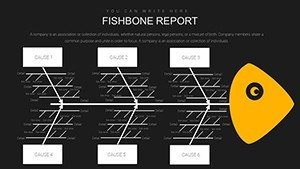
The template's strength lies in its robust features, designed for precision. Core to it are customizable fishbone structures with branching categories, allowing up to six main 'bones' for cause breakdown - adaptable to your specific problem. For example, in a service industry scenario, branches might explore customer feedback loops or process bottlenecks.
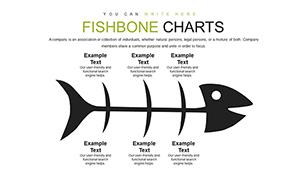
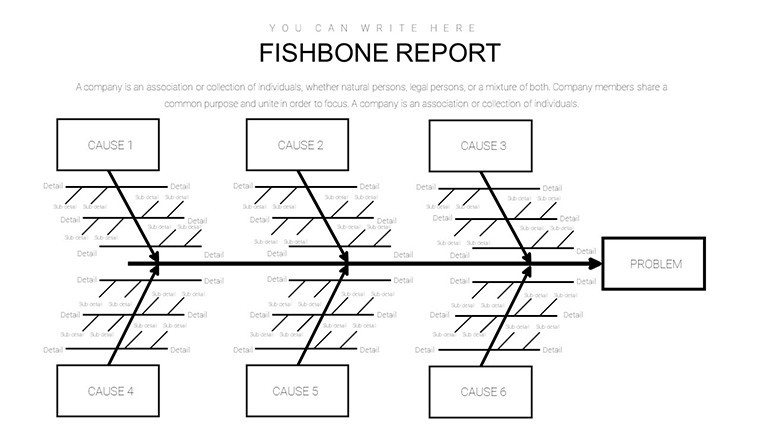
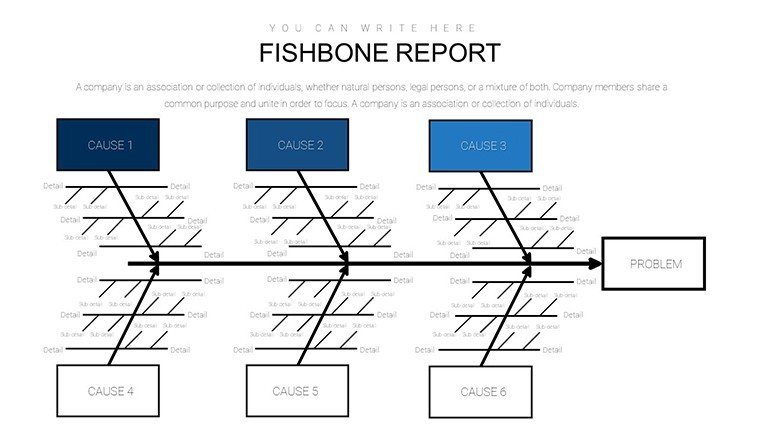
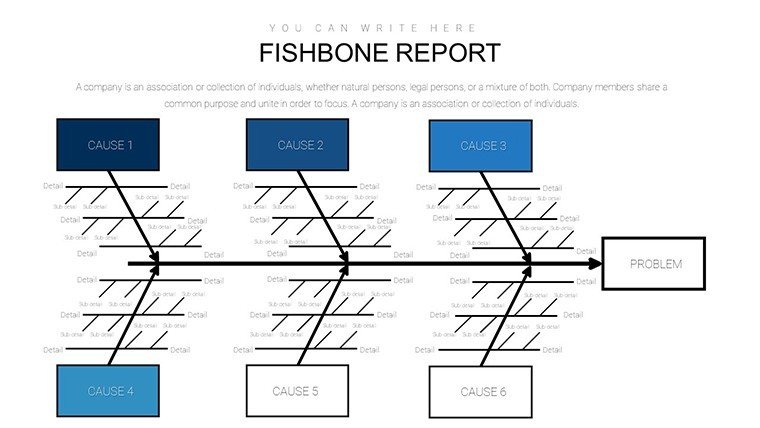
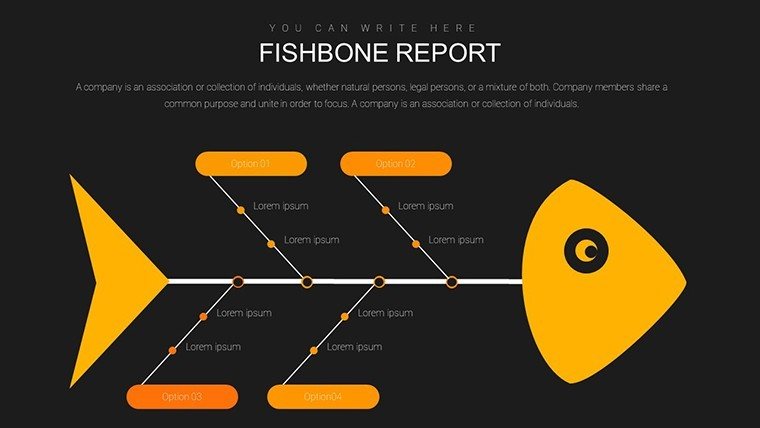
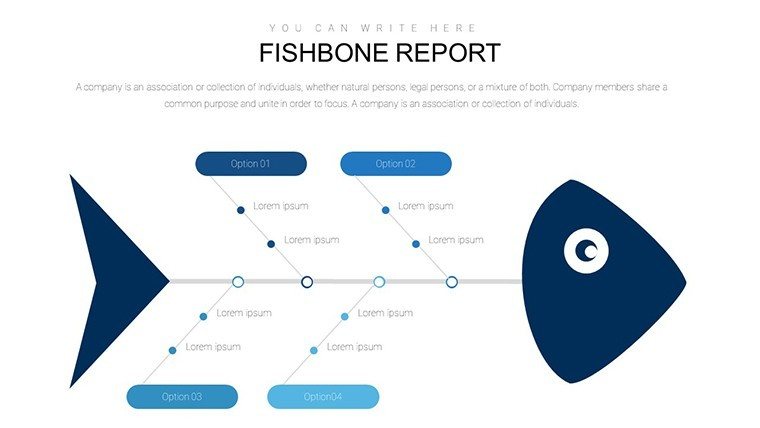
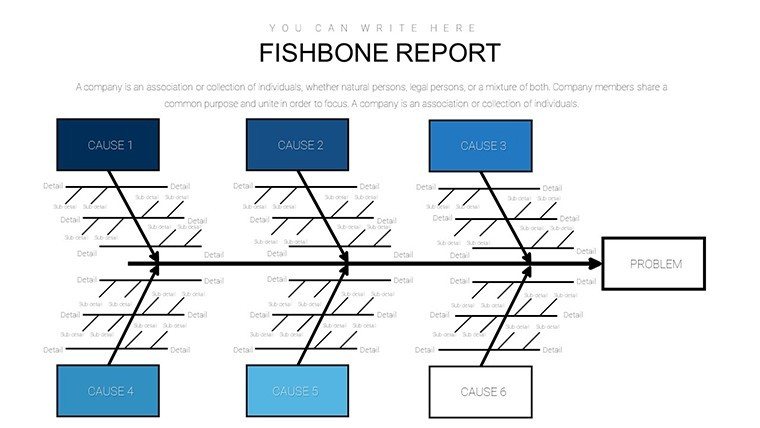
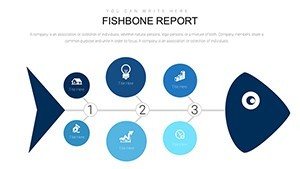
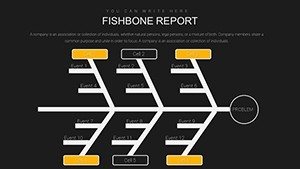
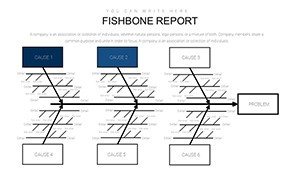
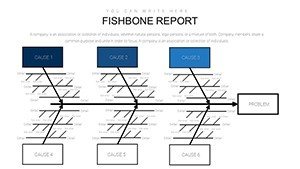
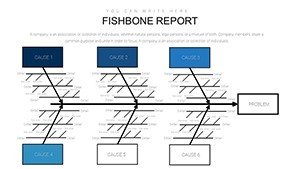
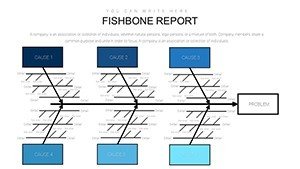
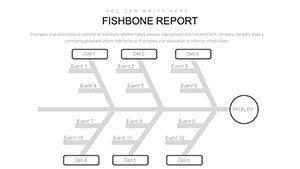
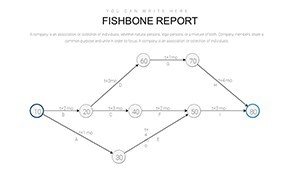
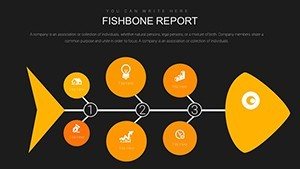
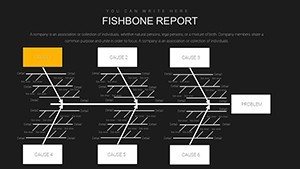
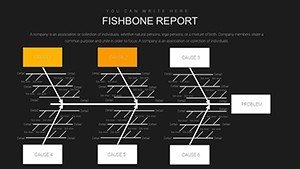
Visual enhancements include color-coded branches for easy differentiation, icons representing categories (e.g., a gear for machines), and text placeholders for detailed notes. Slides vary in complexity: some offer simple linear fishbones for quick overviews, while others provide multi-level hierarchies for deep dives. High-resolution graphics ensure scalability, vital for virtual presentations via Zoom or in-person boardrooms.
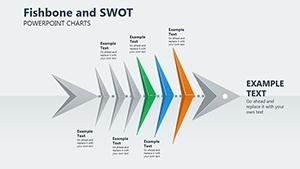
Additional tools like arrow connectors for cause linkages and priority markers (e.g., stars for high-impact causes) add layers of functionality. This aligns with quality management standards like ISO 9001, where root cause analysis is key to certification.
Slide-by-Slide Exploration: Building Your Narrative
Navigating the 26 slides reveals a logical progression. Slides 1-4 introduce the concept: title pages with fishbone overviews, instructional guides on diagram construction, and blank templates for starters. Slide 3, for instance, includes a step-by-step flowchart on how to populate the diagram, drawing from Deming's PDCA cycle.
Core analysis slides (5-18) offer variations: Slide 7 features a classic 6M fishbone (Man, Machine, Method, Material, Measurement, Mother Nature), ideal for manufacturing case studies like reducing assembly line errors. Slide 12 introduces a 4P version (People, Process, Policies, Plant) for service sectors, with editable sub-branches for granular detail.
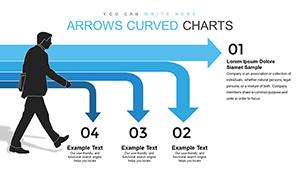
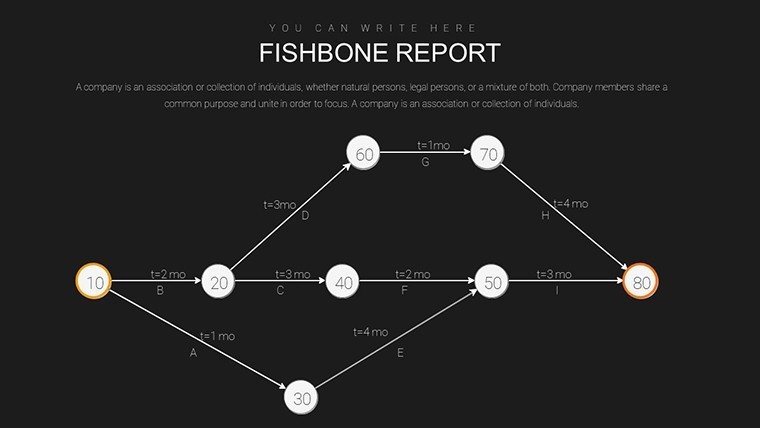
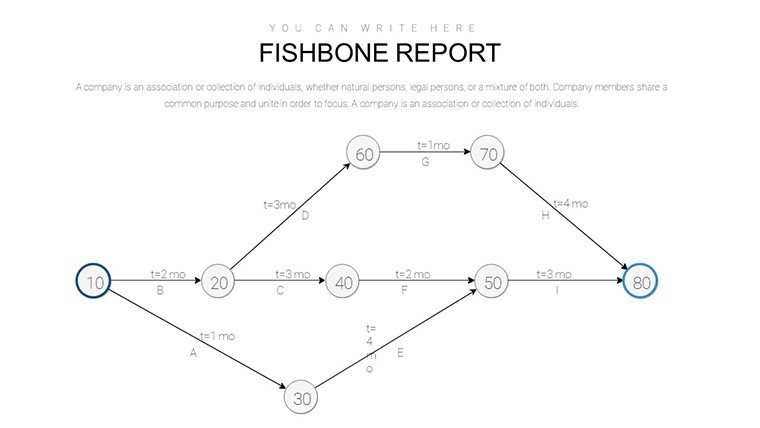
Slides 19-23 focus on solutions: integrate action plans with Gantt-style timelines or responsibility matrices, transforming analysis into execution. For example, Slide 21 could map corrective actions post-cause identification, using bar charts to track progress.
Closing slides (24-26) summarize findings: executive overviews, key takeaways, and Q&A prompts, ensuring your presentation ends on a strong, memorable note.
Practical Use Cases: From Theory to Real Impact
Apply this template across industries for transformative results. In manufacturing, use it to pinpoint defects, as in a hypothetical automotive plant where fishbones revealed supplier material inconsistencies, leading to a 15% quality uplift per ASQ benchmarks.
For healthcare, analyze patient wait times by categorizing under staff, procedures, and facilities - mirroring tools used in Lean Six Sigma projects at hospitals like Mayo Clinic. Business consultants might deploy it in strategy sessions to dissect market entry failures, branching into competitive, regulatory, and internal factors.
Educators can teach problem-solving methodologies, using slides to simulate real-world scenarios like supply chain disruptions during pandemics. In project management, integrate with PMI standards to review post-mortem analyses, fostering lessons learned that prevent future pitfalls.
A case in point: A tech startup used fishbone diagrams in their agile retrospectives, identifying code deployment issues rooted in team communication, resulting in streamlined DevOps processes and faster releases.
Unlocking Benefits: Efficiency Meets Expertise
Beyond visualization, the template delivers tangible benefits. It promotes structured thinking, reducing bias in problem-solving and aligning teams on causes rather than symptoms. This leads to cost savings - studies from McKinsey show root cause tools can cut operational waste by up to 30%.
Applications span from daily stand-ups to annual audits, with its adaptability making it indispensable for remote teams using Microsoft 365 integrations. Trust is built through transparent, data-backed analyses, enhancing your authoritative voice in discussions.
Customization Tips: Tailor for Maximum Effectiveness
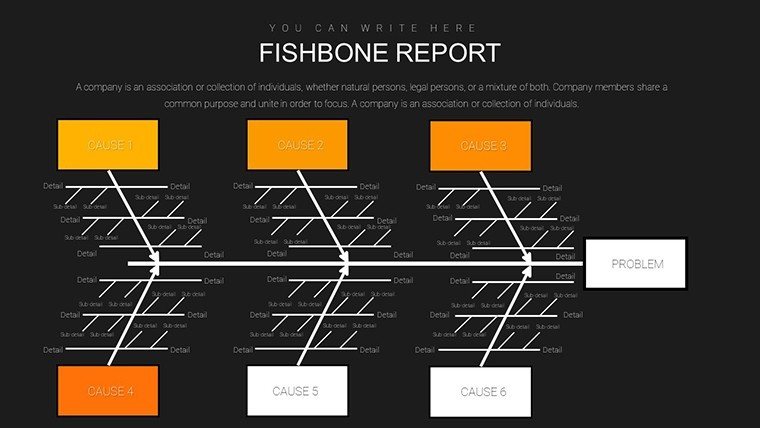
Personalize by aligning colors with your brand - use reds for critical causes to draw attention. Add data links from Excel for dynamic updates, ensuring real-time accuracy.
Incorporate animations: reveal branches sequentially to build suspense during presentations. For accessibility, add descriptive alt text like "Fishbone diagram analyzing production delays."
Workflow integration: Start with brainstorming in tools like Miro, then import to PowerPoint for polishing. Regular updates keep diagrams current, supporting ongoing improvement cycles.
Ready to dissect and conquer your business challenges? Secure this template now and elevate your analytical prowess.
FAQ
What is a Fishbone Diagram used for?
It's a tool for identifying root causes of problems by categorizing potential factors, ideal for business analysis.
How many categories can I add to the fishbone?
Up to six main categories, with unlimited sub-branches, all fully editable.
Is this compatible with older PowerPoint versions?
Yes, it works with PowerPoint 2010 and later, though newer versions offer better features.
Can I integrate data from Excel?
Absolutely - link charts to spreadsheets for automatic updates.
Are there examples included?
Yes, sample slides with pre-filled data for quick learning.
How does this aid in team collaboration?
It provides a visual framework for group discussions, clarifying contributions to issues.