Preventing Sexual Violence PowerPoint Charts: Advocacy and Education Tool


Type: PowerPoint Charts template
Category: Relationship, Silhouettes & People
Sources Available: .pptx
Product ID: PC00879
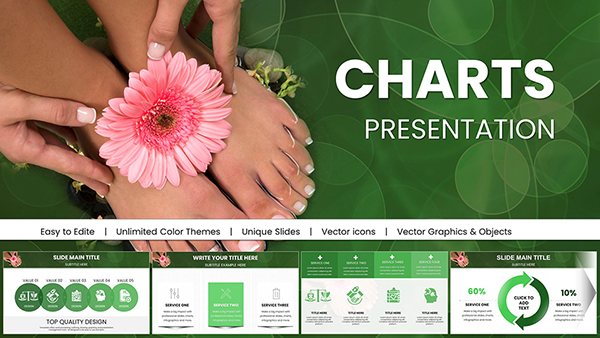
Template incl.: 14 editable slides
When it comes to sensitive topics like preventing sexual violence, the right visuals can amplify voices and spark change. Our Preventing Sexual Violence PowerPoint Charts Template is tailored for professionals in social work, public health, and education, offering 14 editable slides to present data with empathy and clarity. Featuring eye-catching graphs and icons, this template helps illustrate statistics, strategies, and survivor stories without overwhelming your audience. Ideal for conferences, training sessions, or awareness campaigns, it turns raw information into meaningful narratives. Drawing from guidelines by organizations like the National Sexual Violence Resource Center (NSVRC), it ensures your presentations are both authoritative and approachable, fostering discussions that lead to action. Step into a role of influence with tools that respect the gravity of the subject while promoting hope and prevention.
Core Features Enhancing Advocacy Efforts
Built with sensitivity in mind, the template's features prioritize clear, respectful communication. The 14 slides incorporate varied color schemes to suit somber tones, with editable content for personalization.
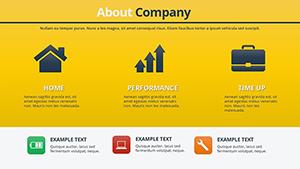
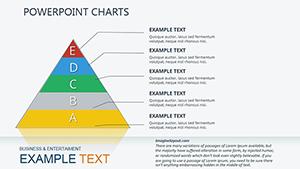
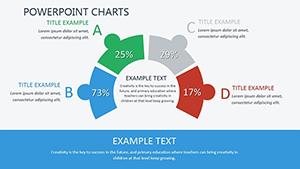
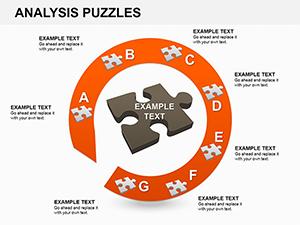
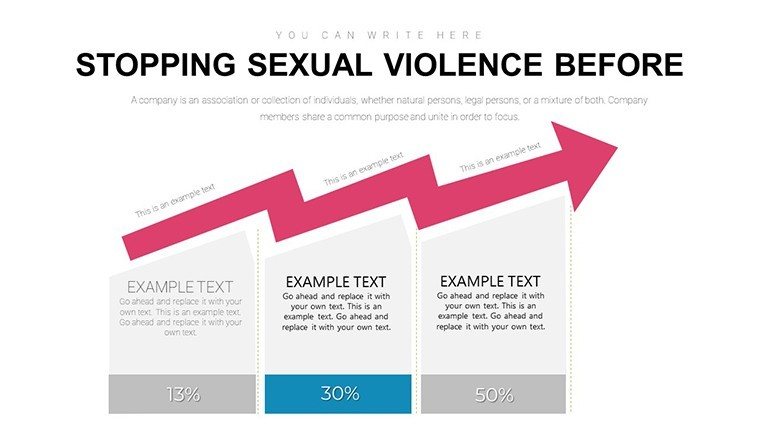
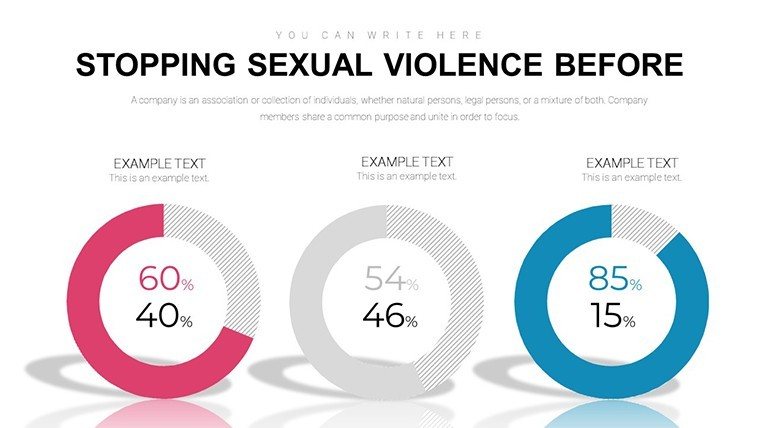
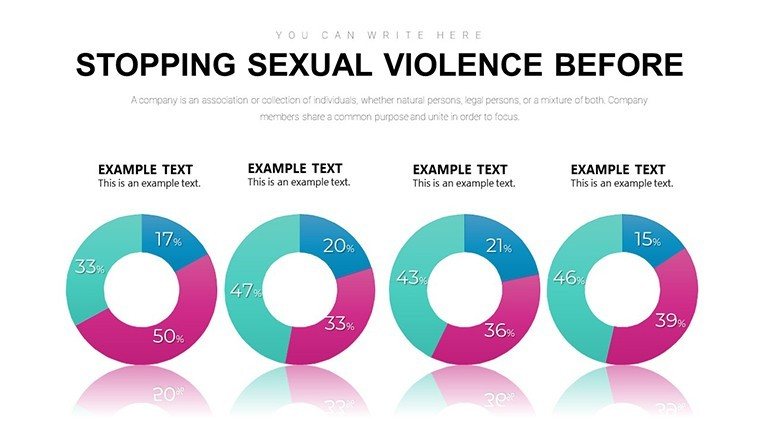
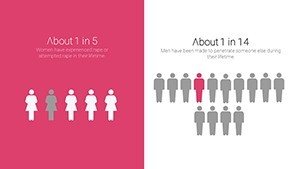
- Impactful Charts and Graphs: Use bar graphs for prevalence stats or pie charts for strategy breakdowns.
- Customizable Visuals: Adjust styles and icons to align with your organization's mission.
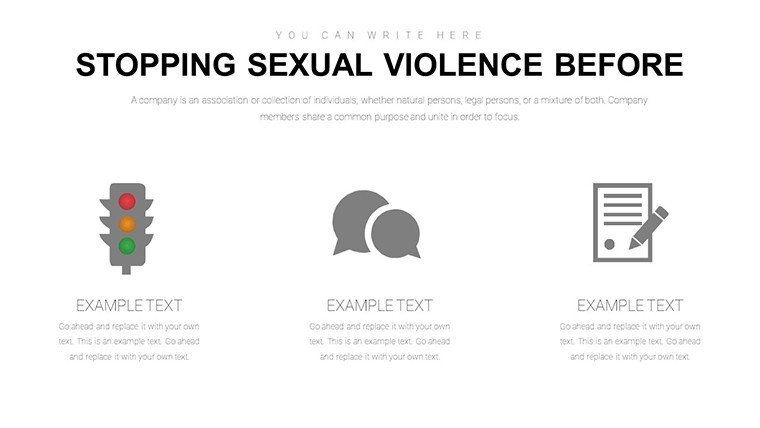
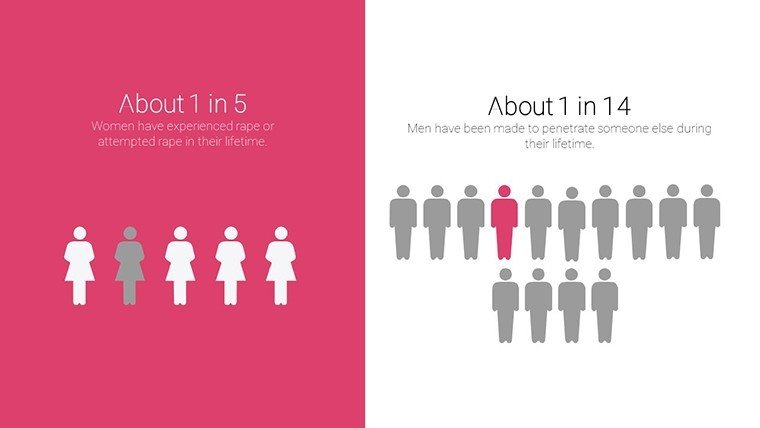
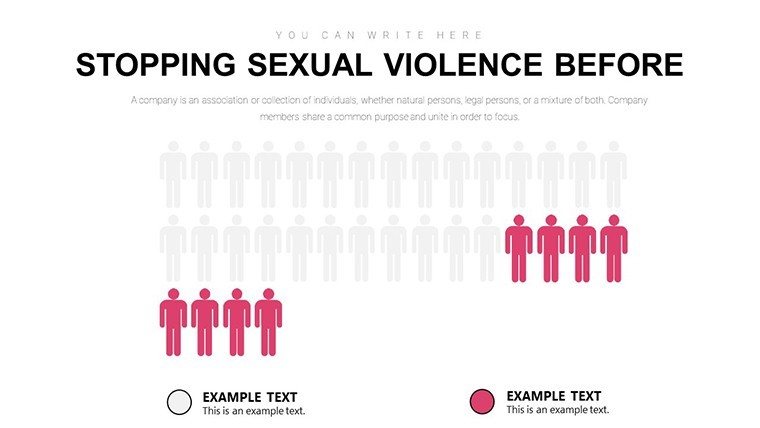
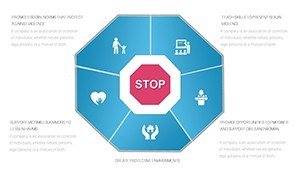
- Engaging Imagery: Silhouettes and relationship-themed elements add depth without graphic content.
- User-Friendly Edits: Quick modifications ensure focus remains on message delivery.
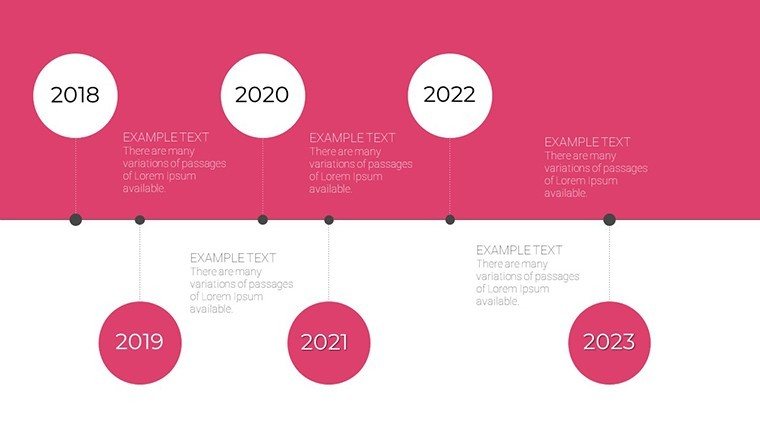
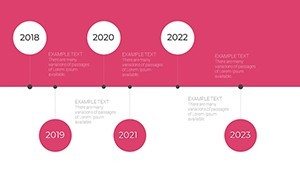
For instance, a line graph tracking policy changes over time can highlight progress, evoking a sense of momentum like a ripple effect in advocacy. This aligns with by referencing real-world applications from NSVRC reports, building trust through evidence-based design.
Practical Applications in Awareness and Training
From non-profits to schools, this template adapts to various settings. Educators use it in classrooms to discuss consent, while advocates present at events to showcase intervention success rates.
In one notable case, a public health organization employed the charts for a community workshop, leading to increased reporting and support-seeking, as per follow-up surveys. For social workers, visualize risk factors in client sessions for tailored prevention plans.
- Define your key data points, such as incidence rates or program outcomes.
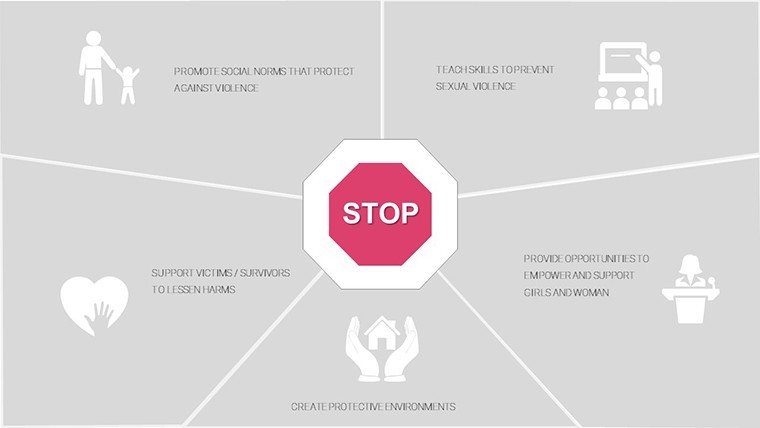
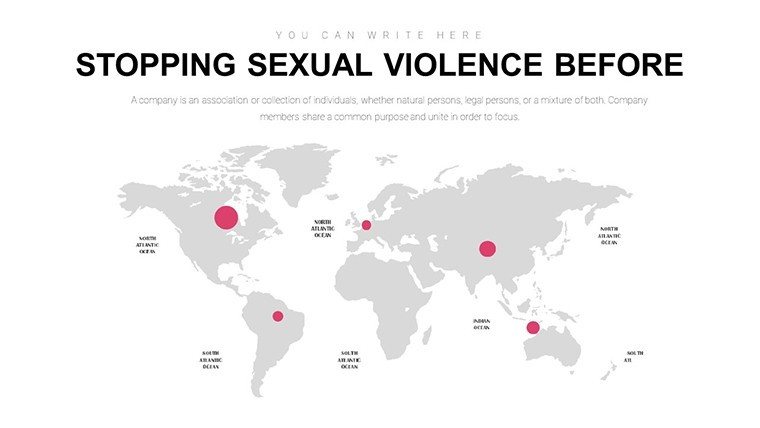
- Choose fitting visuals - e.g., a relationship diagram for community impacts.
- Tailor content with respectful language and sources from credible bodies.
- Deliver with interactive elements to encourage dialogue.
Surpassing standard slides, it includes thematic icons for nuanced storytelling, compatible with PowerPoint and Google Slides for broad accessibility.
Delivering Value Through Empowered Communication
Benefits include heightened audience empathy and retention, crucial for behavior change. Workshops see better participation when visuals clarify complex issues.
A advocacy group used it to map survivor resources, enhancing community trust. Incorporate LSI like "awareness infographics" for better search alignment.
Embrace this template to advance your cause. It's a beacon for change-makers.
Insights for Effective Use
Balance data with stories for emotional connection. Ensure inclusivity in visuals. Integrate into broader campaigns for sustained impact.
In conclusion, this template equips you to fight sexual violence with visual power. Act now and inspire transformation.
Frequently Asked Questions
Are the slides fully editable for sensitive topics?
Yes, allowing careful customization to maintain respect and accuracy.
Is it appropriate for educational settings?
Absolutely, designed for schools and workshops to promote awareness.
How do I incorporate statistics?
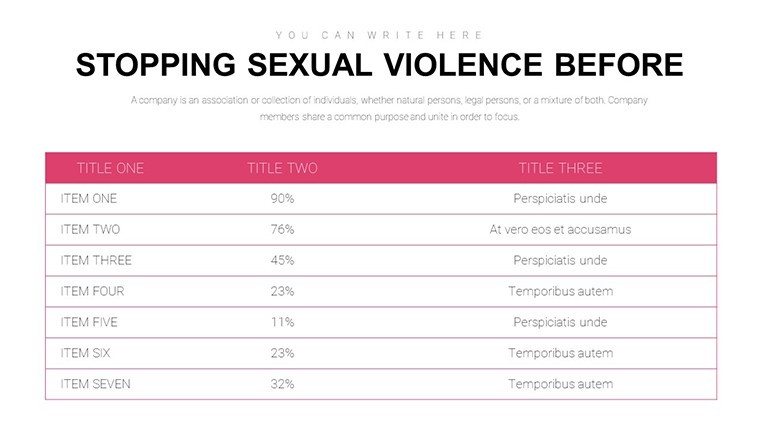
Easily input data into graphs for clear, evidence-based presentations.
Compatible with other tools?
Yes, works with PowerPoint and Google Slides.
What if I need more slides?
You can duplicate and modify existing ones for expansion.