Legitimate Business Success PowerPoint Charts Template: Unlock Professional Excellence


In the fast-paced world of business, where every presentation counts toward sealing deals or inspiring teams, having the right tools can make all the difference. Imagine stepping into a boardroom armed with visually stunning charts that not only convey complex data but also tell a compelling story of success. Our Legitimate Business Success PowerPoint Charts Template is crafted precisely for professionals like you - executives, managers, consultants, entrepreneurs, and educators - who need to communicate ideas with clarity and impact. With 42 fully editable slides, this template blends professional design with effortless customization, allowing you to adapt colors, fonts, and layouts to match your brand's identity. Whether you're showcasing quarterly results, outlining strategic pyramids, or analyzing market trends, these charts transform raw data into persuasive narratives. Designed with real-world business scenarios in mind, it draws from best practices seen in Fortune 500 reports and consulting frameworks, ensuring your presentations stand out. Say goodbye to bland slides and hello to engaging visuals that captivate audiences and drive action.
Key Features That Set This Template Apart
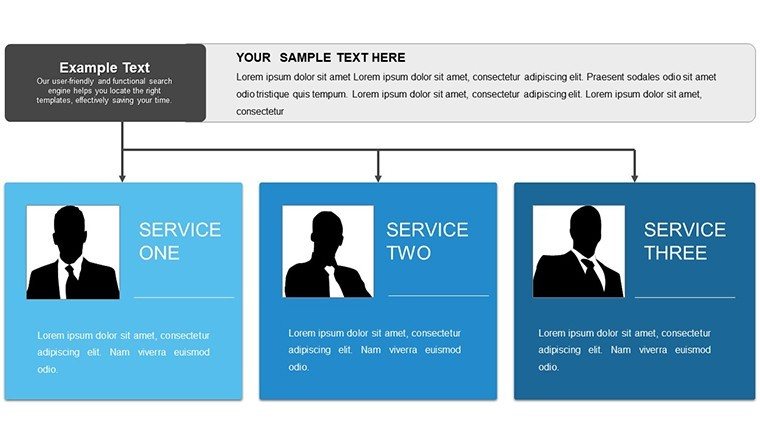
What makes this template a must-have for legitimate business endeavors? It's the thoughtful integration of features that prioritize both aesthetics and functionality. Each of the 42 slides is built on a foundation of clean, sophisticated design principles, incorporating high-contrast colors for readability and subtle animations for emphasis. The template includes a diverse array of chart types: hierarchical pyramids for organizational structures, detailed tables for comparative data, and analytical graphs for trend forecasting. Customization is at the core - users can easily insert their data via placeholders, resize elements without distortion, and even add branded icons from an included library. Compatible with Microsoft PowerPoint and Google Slides, it ensures seamless collaboration across teams. Drawing from industry standards like those in McKinsey consulting decks, these charts help you avoid common pitfalls such as overcrowded slides, instead promoting a balanced layout that enhances comprehension. Professionals appreciate how it saves hours of design time, allowing focus on content strategy rather than formatting woes.
Diving Deeper into Slide Categories
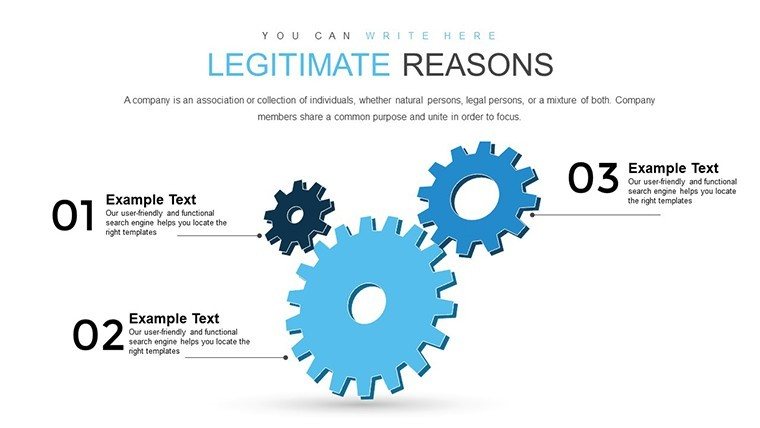
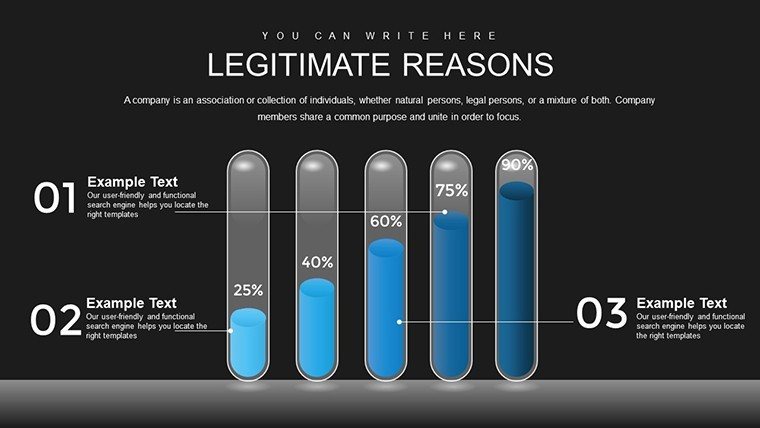
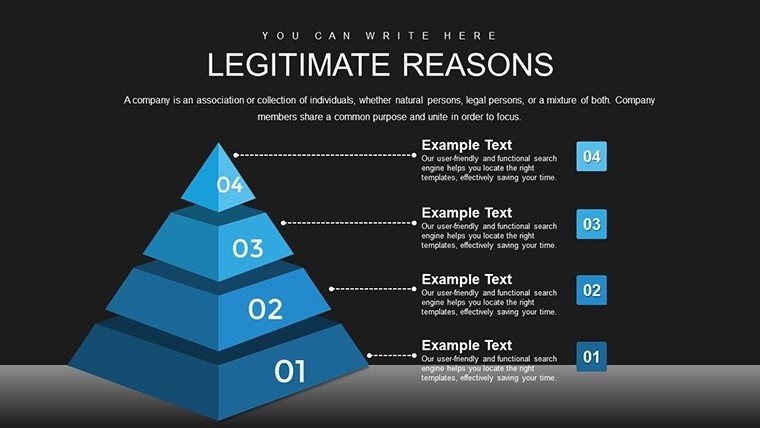
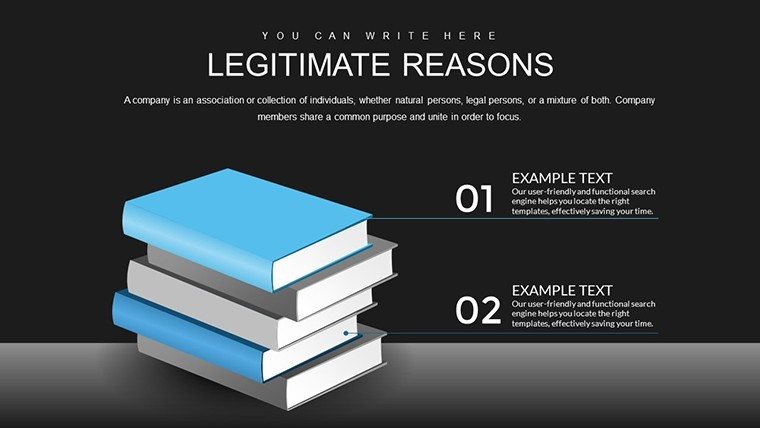
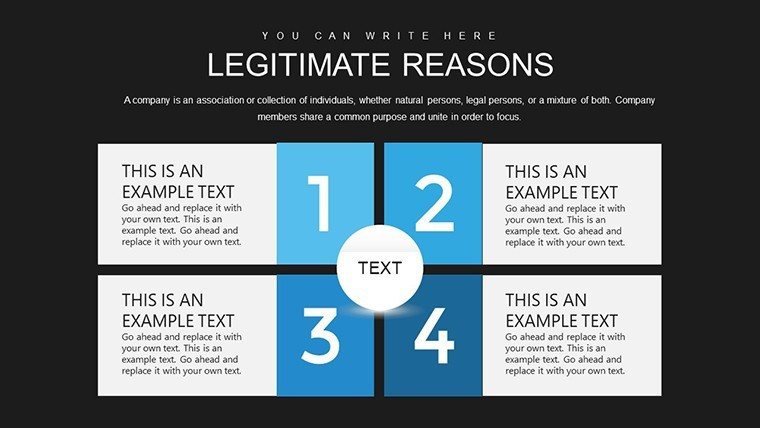
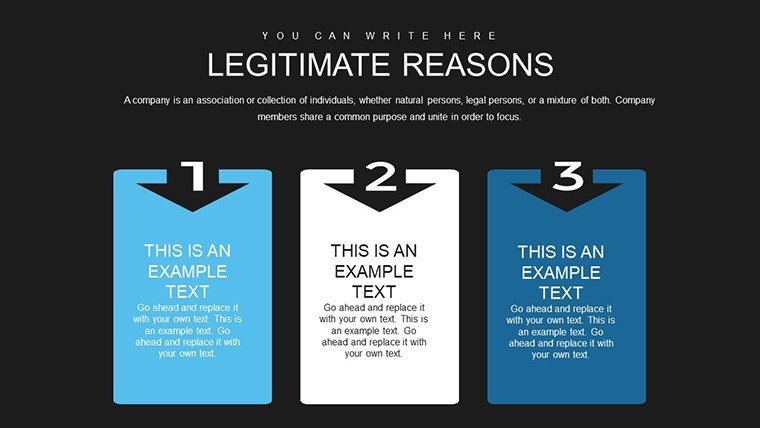
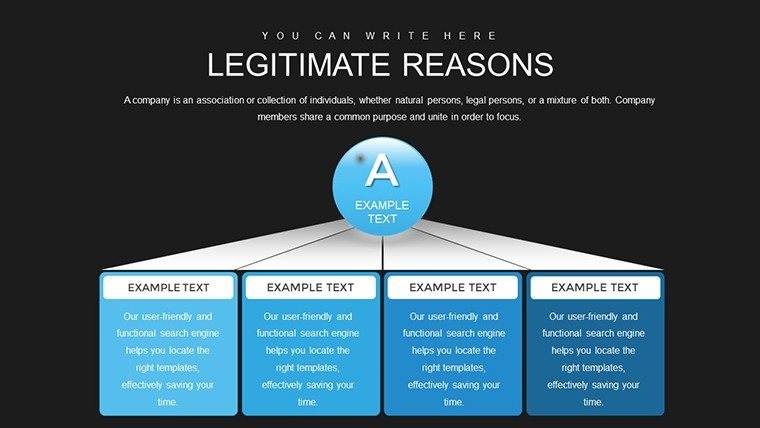
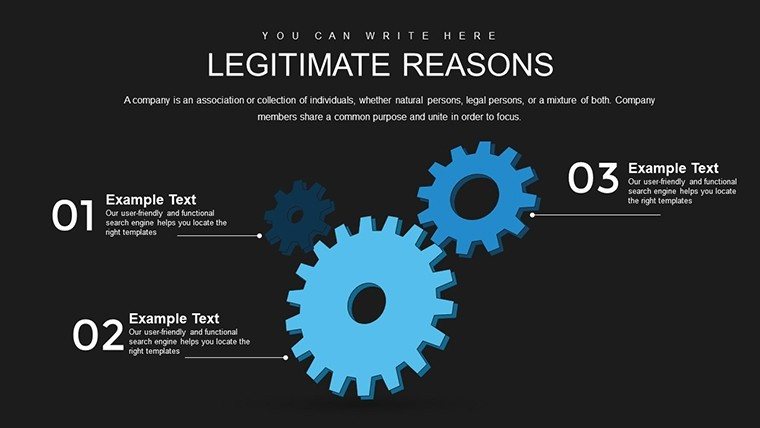
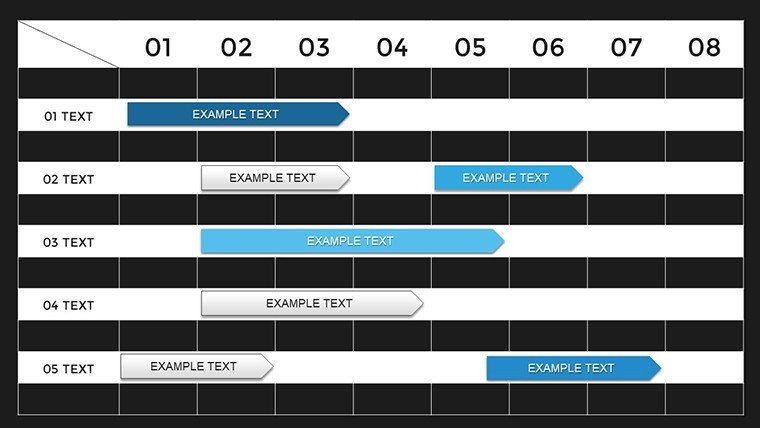
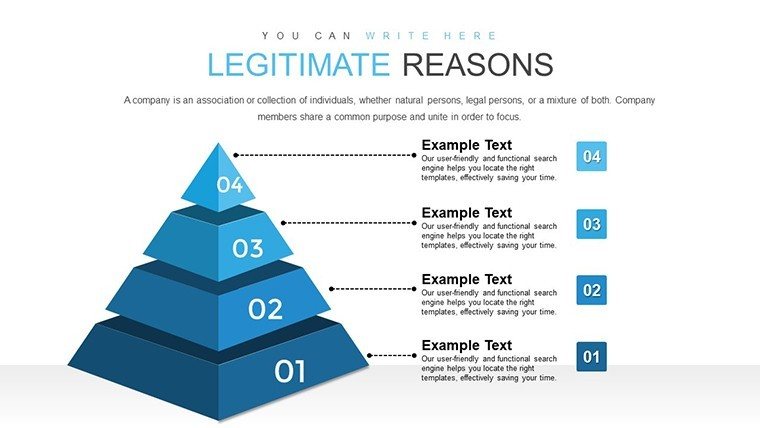
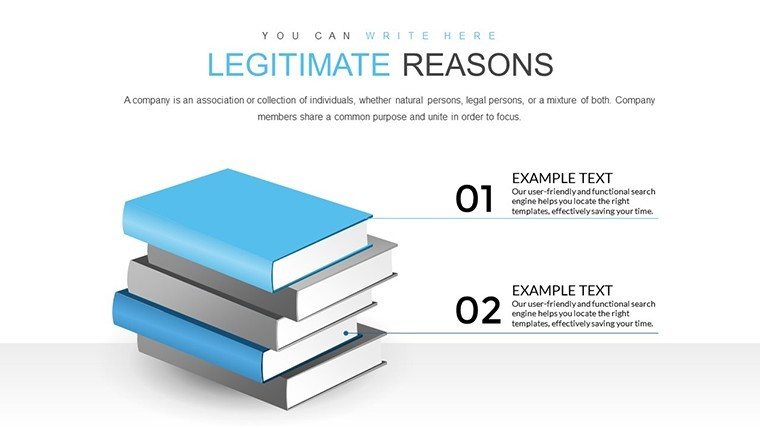
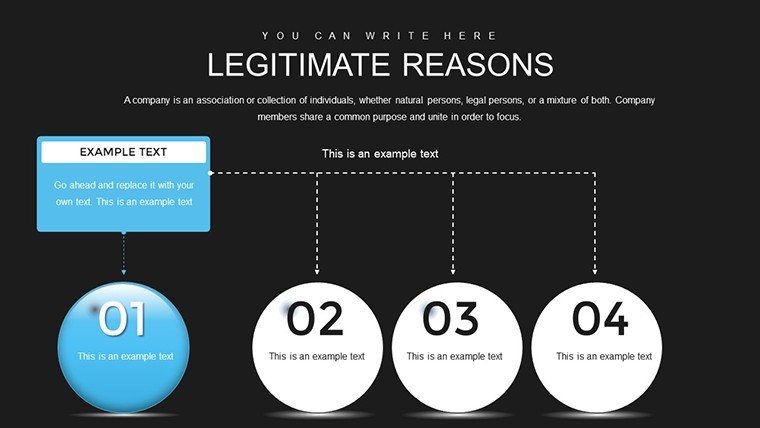
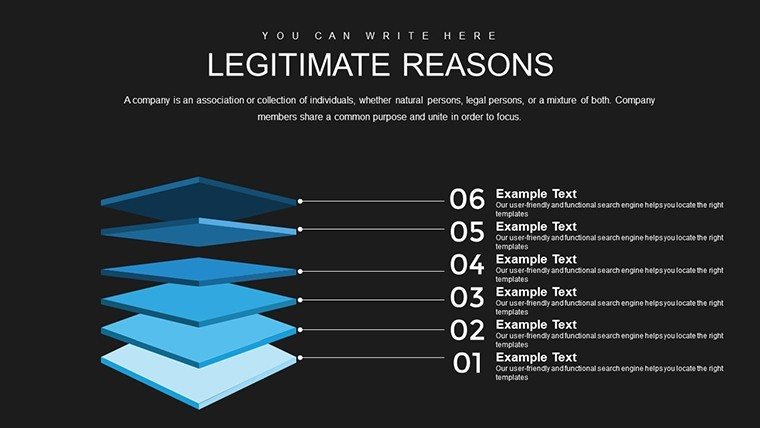
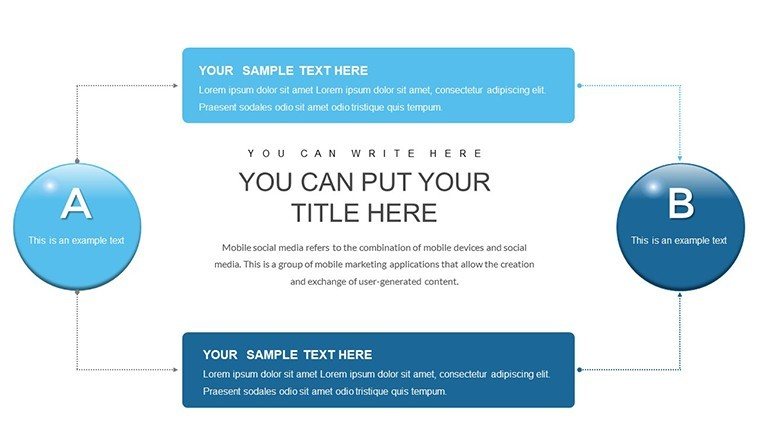
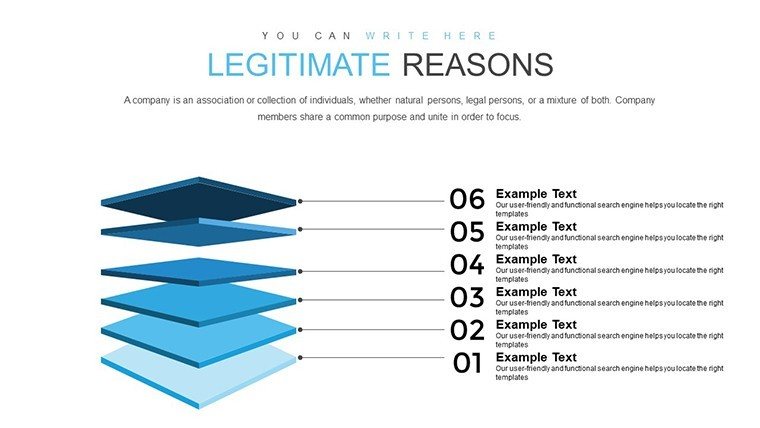
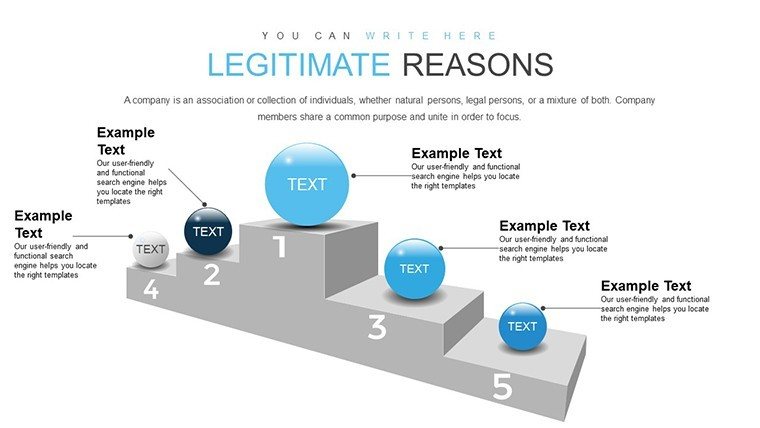
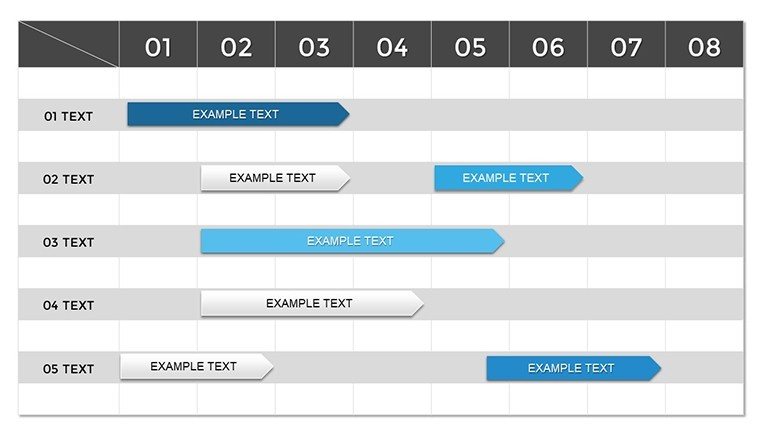
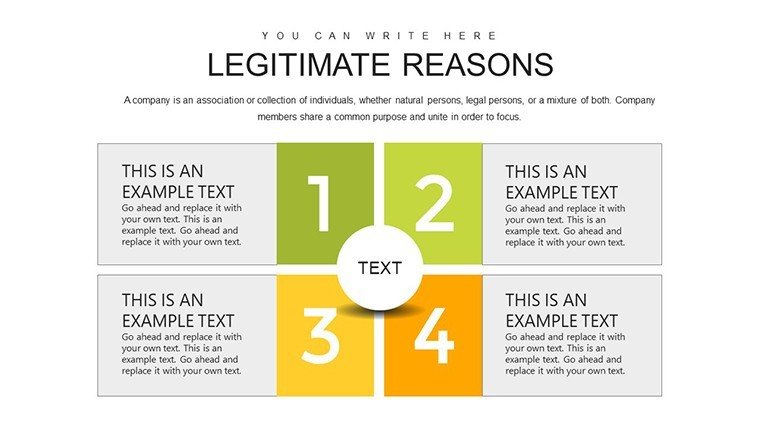
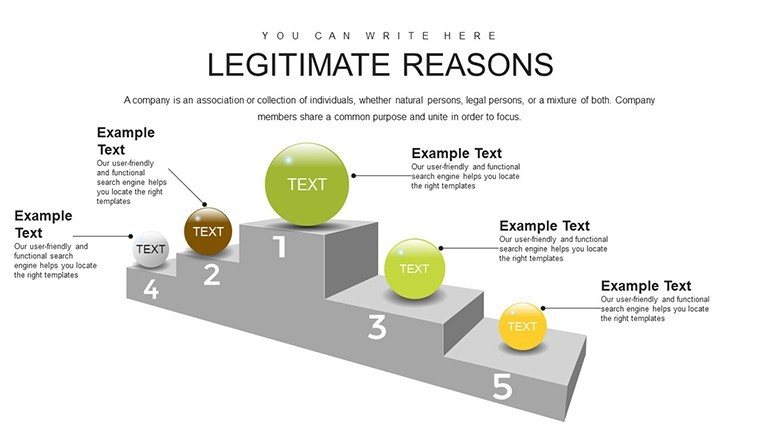
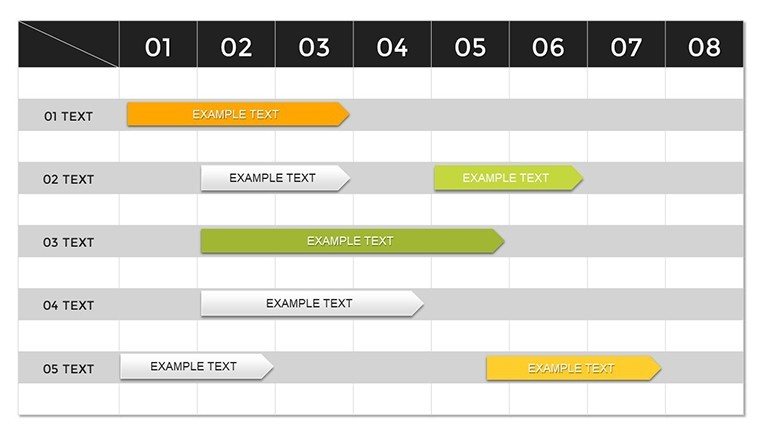
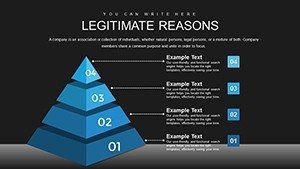
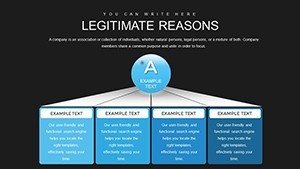
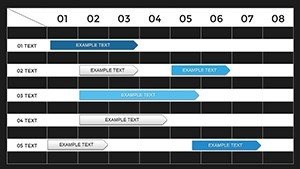
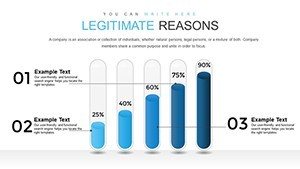
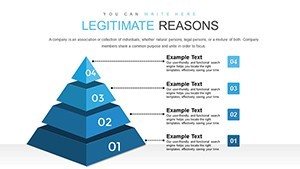
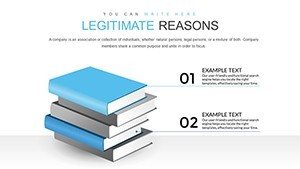
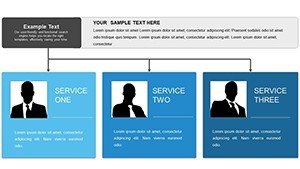
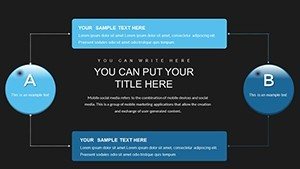
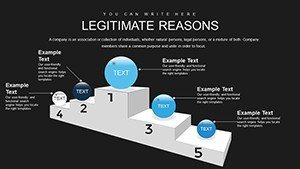
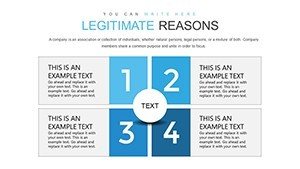
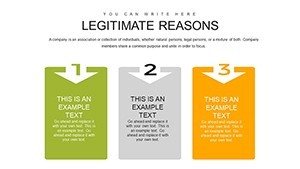
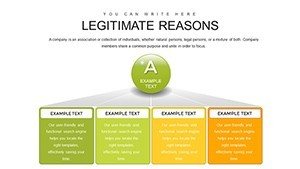
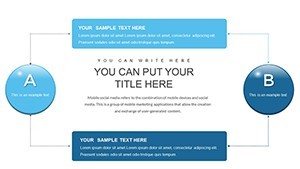
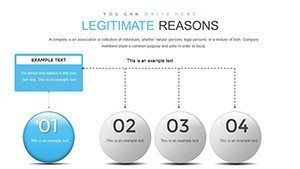
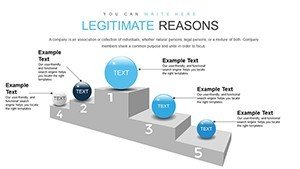
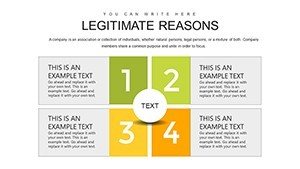
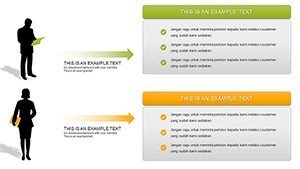
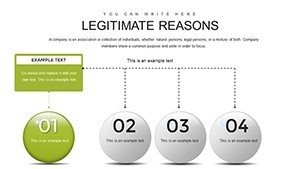
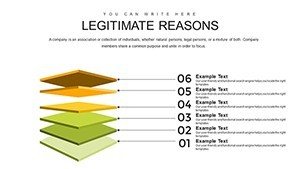
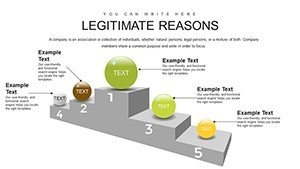
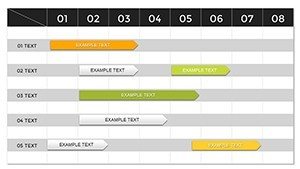
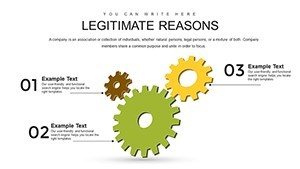
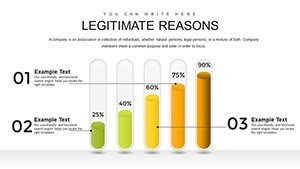
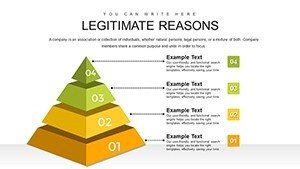
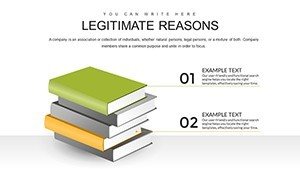
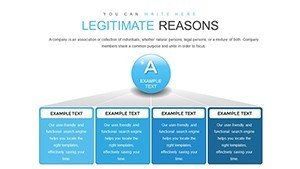
Let's break down the slides to give you a clear picture of how this template supports your business narrative. The first section focuses on pyramid charts, ideal for depicting hierarchies or phased processes. For instance, Slide #1 introduces a basic pyramid with five levels, perfect for outlining business growth stages - from ideation to market dominance. You can customize each layer with text, colors, and icons, such as upward arrows symbolizing progress. Moving to tables, Slides #10-15 offer multi-column formats for data comparison, like revenue breakdowns across quarters. These are equipped with conditional formatting options to highlight key metrics, making it easy to spot trends during live presentations. The analysis segment, spanning Slides #20-30, includes line graphs, bar charts, and pie diagrams tailored for business intelligence. Slide #25, for example, features a SWOT analysis pyramid that integrates textual explanations with visual overlaps, helping consultants present strategic insights effectively. Each slide maintains a consistent theme of professionalism, with ample white space to prevent visual clutter and ensure your message shines through.
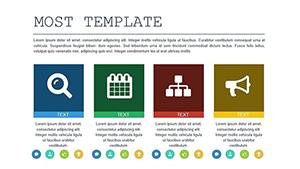
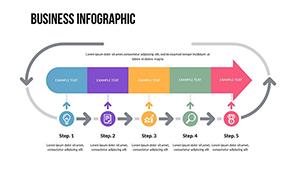
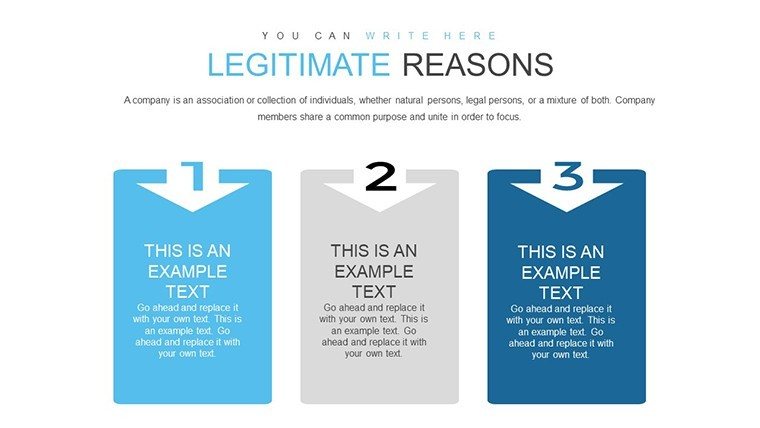
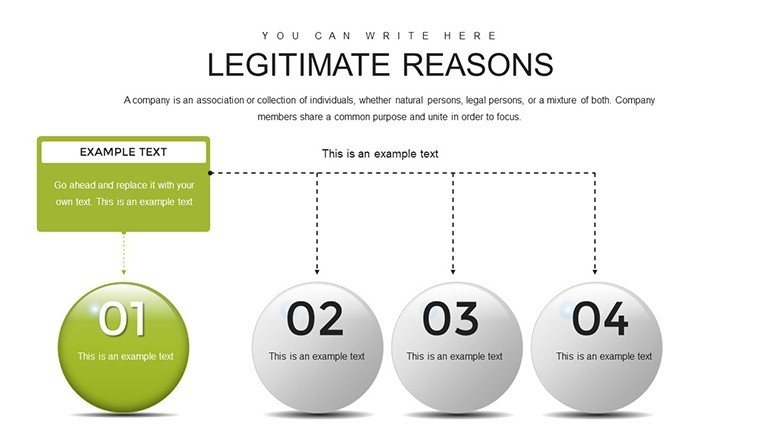
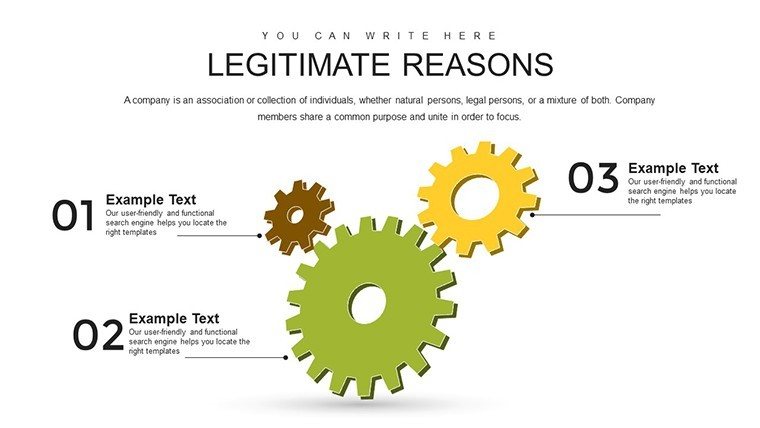
- Pyramid Charts: Visualize step-by-step progressions, such as project milestones or sales funnels, with editable layers for quick adaptations.
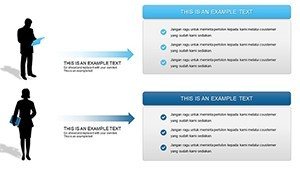
- Table Designs: Present financial data or competitive analyses in grid formats that support sorting and filtering for interactive sessions.
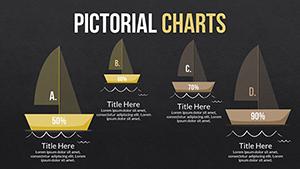
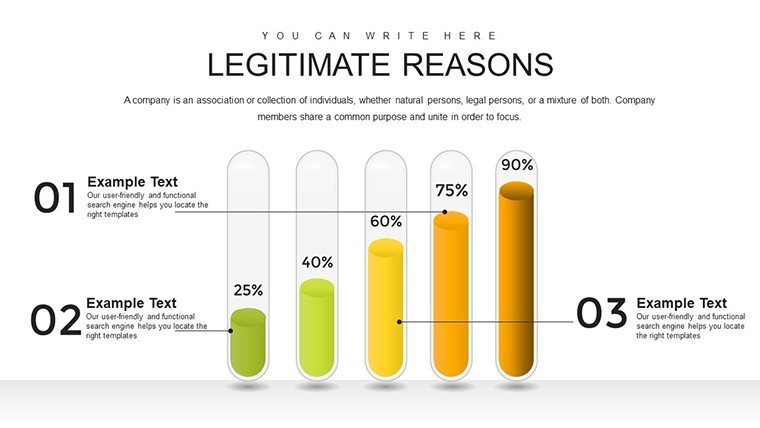
- Analytical Graphs: Use dynamic charts to illustrate KPIs, forecasts, and benchmarks, complete with data labels and trend lines.
Real-World Applications and Benefits
This template isn't just about pretty visuals - it's about delivering tangible benefits in everyday business scenarios. Consider a startup entrepreneur pitching to investors: using the pyramid slides to map out a go-to-market strategy can visually demonstrate scalability, increasing investor confidence. Consultants might leverage the analysis charts to dissect client challenges, drawing parallels to successful case studies like those from Deloitte reports where similar visuals clarified complex audits. For educators in business schools, the tables become tools for teaching comparative economics, engaging students with interactive elements. The benefits extend to time efficiency; what once took days to design now takes minutes, freeing you to refine your delivery. Moreover, by adhering to accessibility standards - such as alt text for charts and high-contrast ratios - this template ensures inclusivity, aligning with modern corporate responsibility. Users report higher engagement rates, with audiences retaining information better through these structured visuals, ultimately leading to better decision-making and business outcomes.
Step-by-Step Guide to Customizing Your Presentation
- Download and Open: Purchase and download the .pptx file, then open it in PowerPoint or Google Slides for immediate access.
- Input Your Data: Replace placeholders in charts and tables with your specific figures, using the built-in editor for seamless integration.
- Personalize Aesthetics: Adjust color schemes to match your brand palette, add logos, and tweak fonts for a polished look.
- Add Interactivity: Incorporate hyperlinks or animations to make slides more engaging during virtual or in-person meetings.
- Review and Present: Preview the deck, make final tweaks, and deliver with confidence, knowing your visuals support your narrative.
Integrating this workflow into your routine can transform how you approach presentations, much like how top firms use templated systems to maintain consistency across global teams.
Tips for Maximizing Impact in Business Presentations
To truly elevate your use of this template, incorporate expert tips drawn from presentation gurus like Nancy Duarte. Start by storytelling: use pyramid charts to build suspense, revealing layers progressively. For tables, employ color coding to guide the eye - red for risks, green for opportunities - enhancing quick comprehension. In analysis slides, always pair visuals with concise narratives; avoid data dumps by focusing on three key takeaways per slide. Consider audience needs: for executives, emphasize bottom-line impacts; for teams, highlight actionable steps. Practice transitions between slides to maintain flow, and use the template's icon library to add thematic flair, like briefcase icons for business success motifs. Finally, test on different devices to ensure compatibility, preventing last-minute glitches. These strategies, honed from real-world applications in high-stakes environments, can turn a good presentation into a memorable one that drives legitimate business success.
Ready to take your presentations to the next level? This Legitimate Business Success PowerPoint Charts Template is your gateway to professional excellence. With its versatile features and user-focused design, it's more than a tool - it's a partner in your success story. Download today and start crafting presentations that inspire and achieve.
Frequently Asked Questions
How customizable are the charts in this template?
The charts are fully editable, allowing you to change data, colors, sizes, and layouts to fit your needs perfectly.
Is this template compatible with Google Slides?
Yes, it works seamlessly with both Microsoft PowerPoint and Google Slides for flexible use.
Can I use this for educational purposes?
Absolutely, educators can adapt the slides for teaching business concepts with engaging visuals.
What file format is provided?
The template comes in .pptx format, ensuring easy access and editing.
Are there any usage restrictions?
No, once purchased, you can use it for unlimited personal or professional presentations.