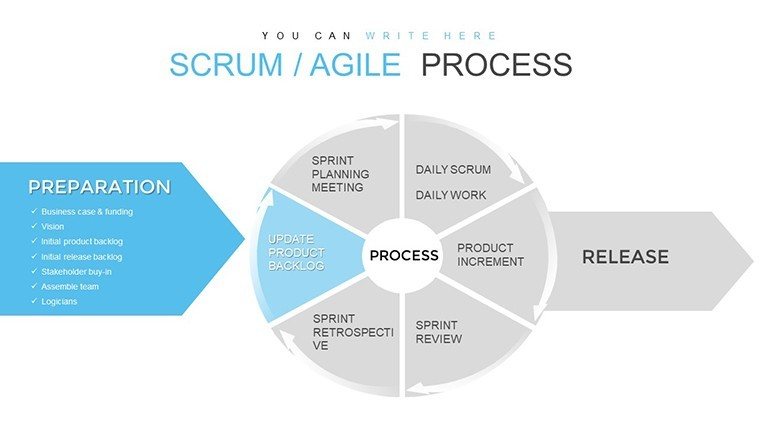
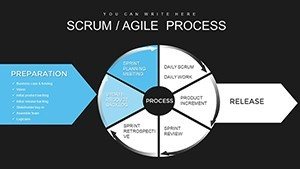
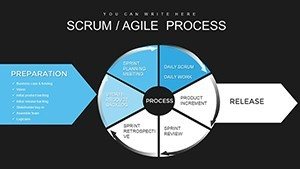
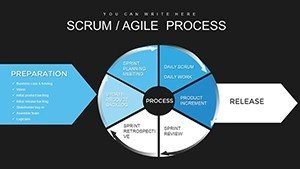
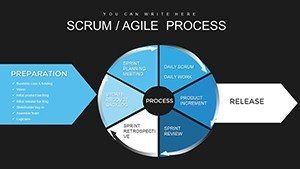
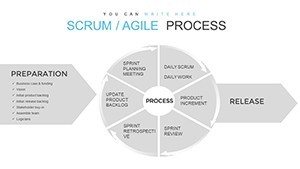
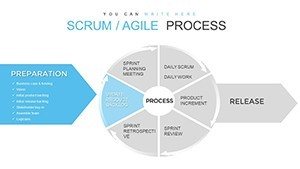
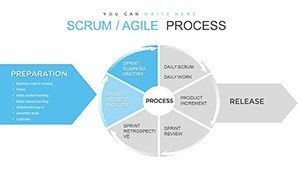
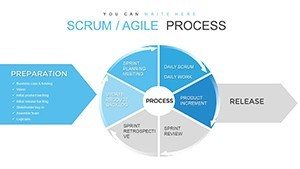
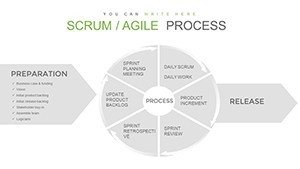
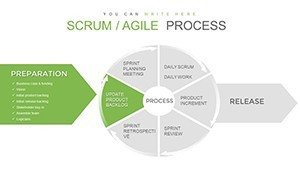
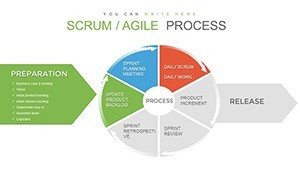
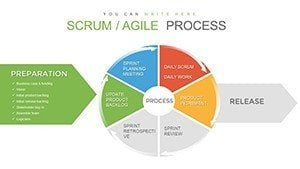
Scrum Agile Development Process PowerPoint Charts Template


Type: PowerPoint Charts template
Category: Business Models, Pie
Sources Available: .pptx
Product ID: PC00856
Template incl.: 30 editable slides
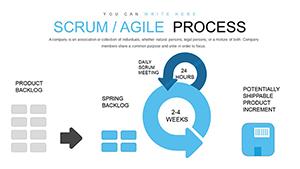
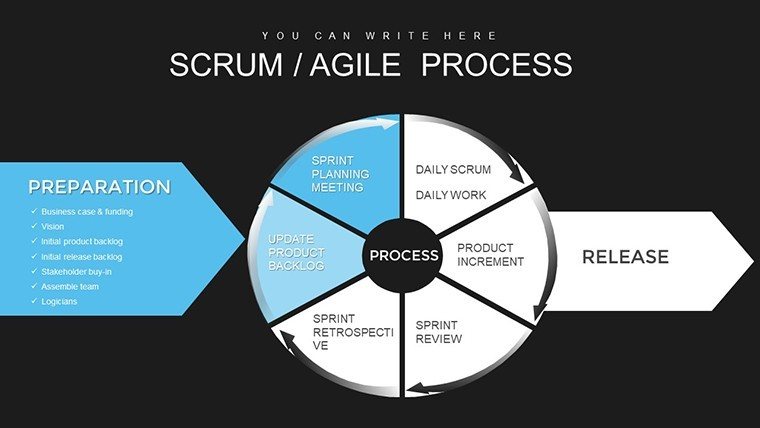
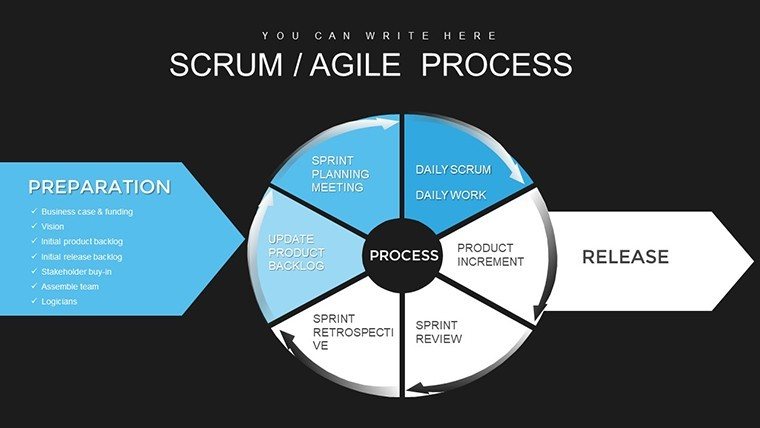
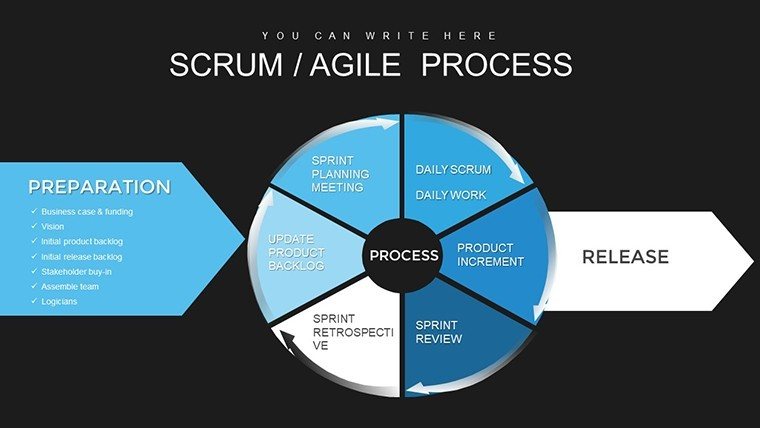
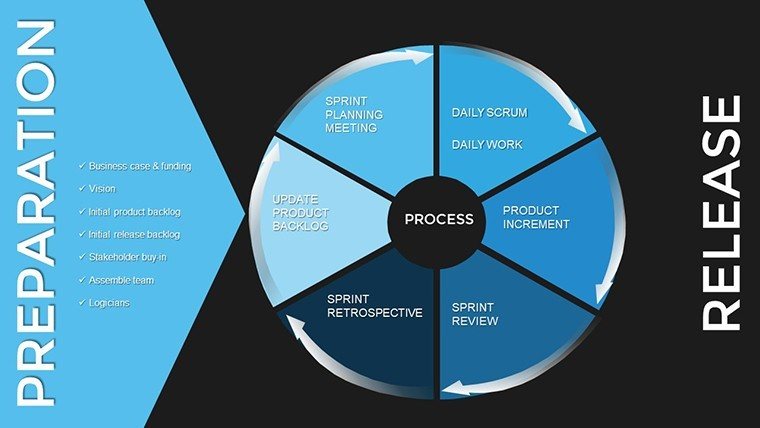
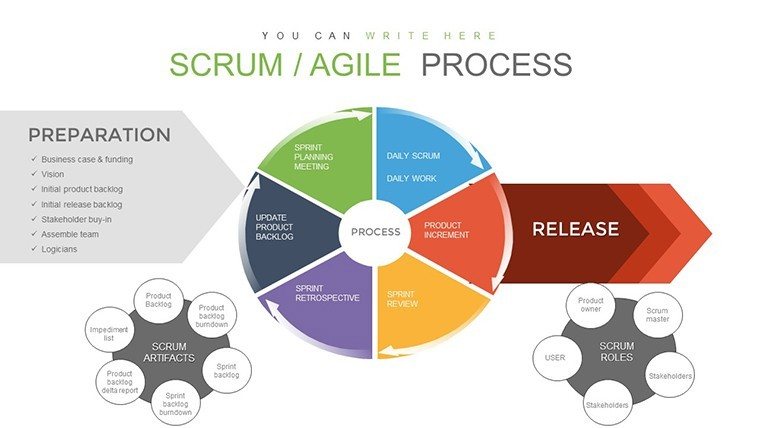
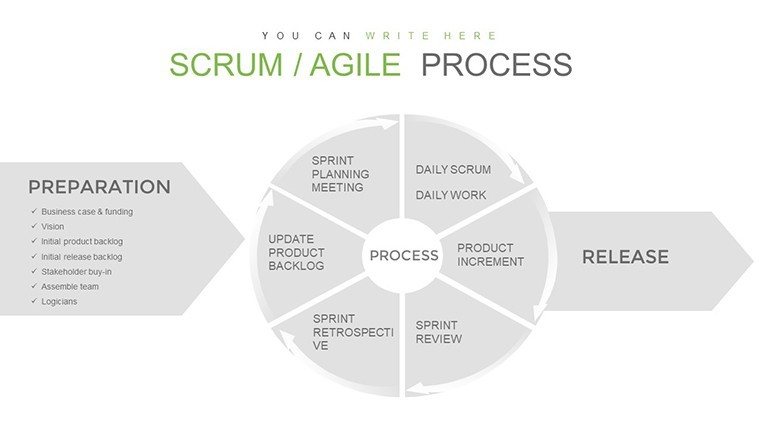
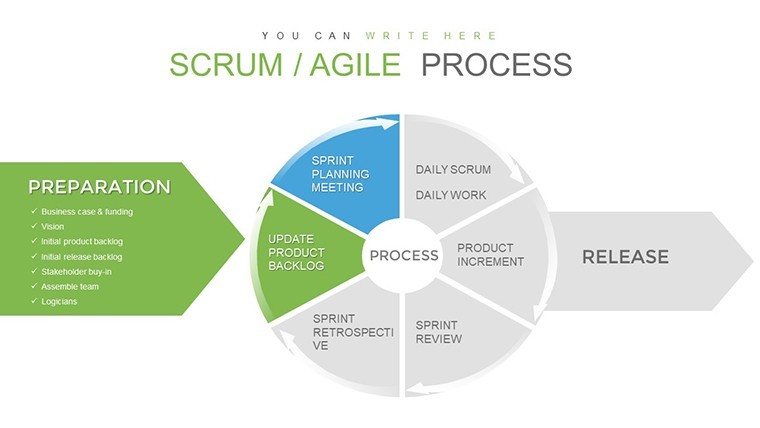
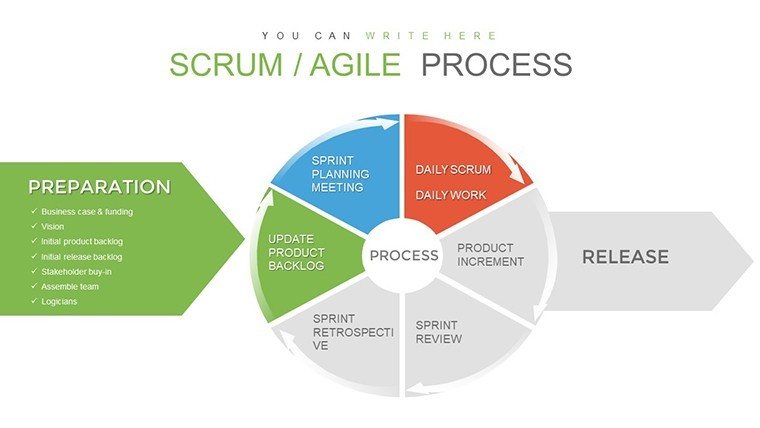
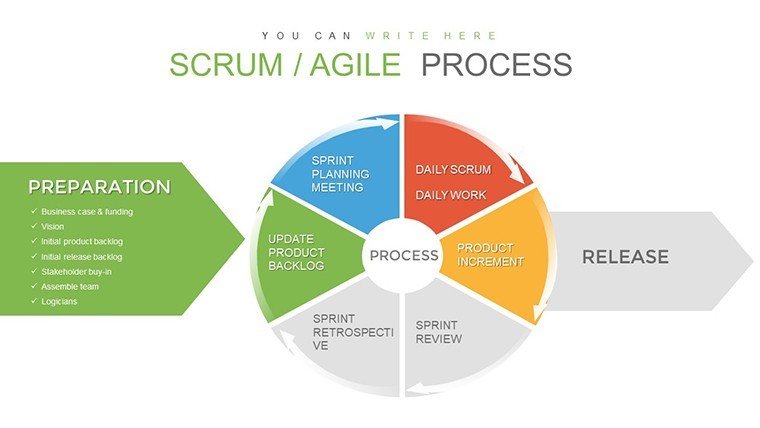
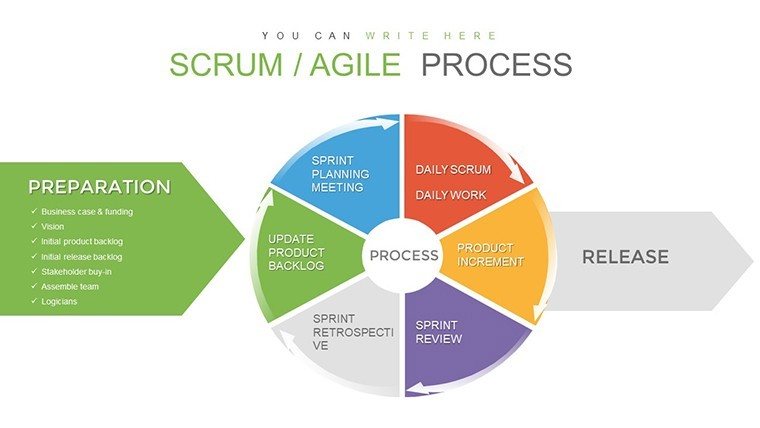
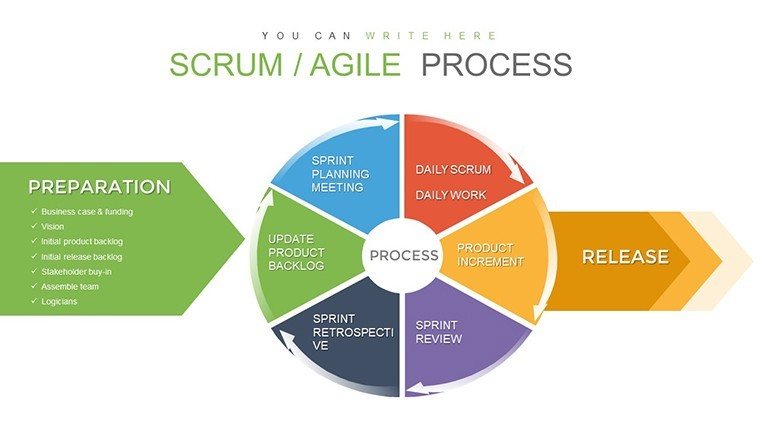
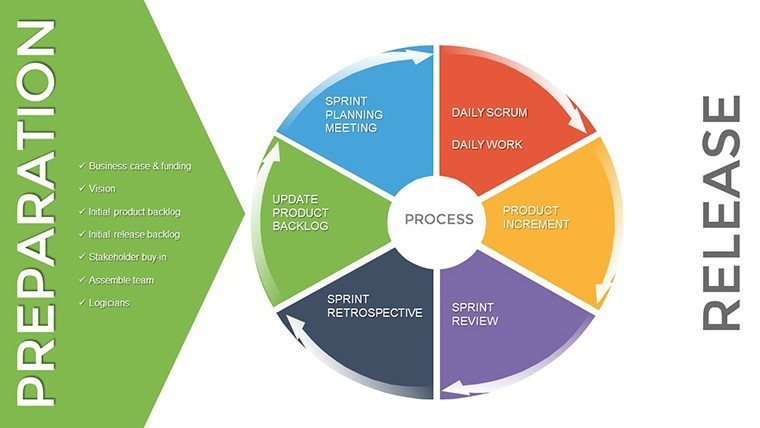
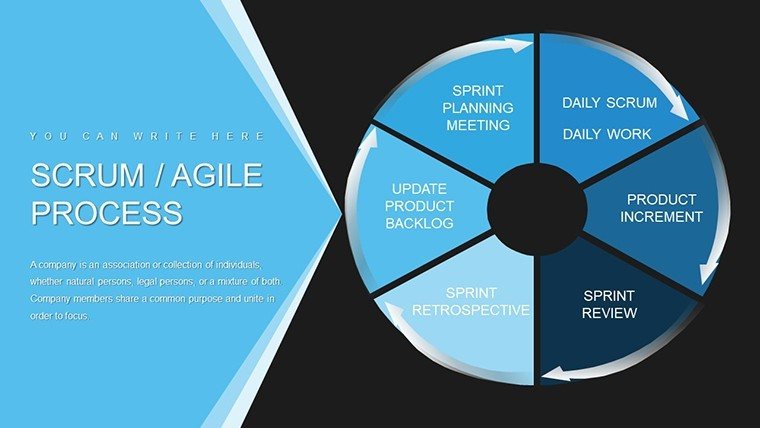
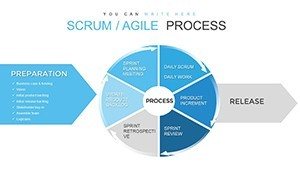
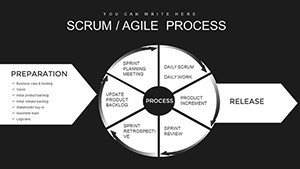
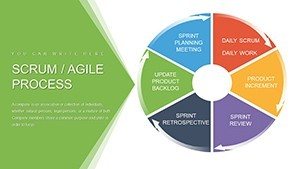
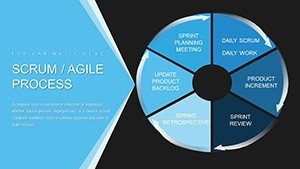
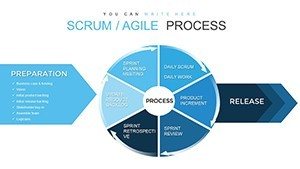
In the fast-paced world of software development and project management, staying ahead means mastering agile methodologies like Scrum. Imagine transforming your team's chaotic workflows into streamlined, visual masterpieces that everyone can rally around. Our Scrum Agile Development Process PowerPoint Charts Template does just that, offering 30 fully editable slides designed specifically for professionals who thrive on iterative progress and collaborative success. Whether you're a project manager juggling multiple sprints or a dev team lead tracking backlogs, this template empowers you to visualize timelines, prioritize tasks, and communicate strategies with clarity and impact.
Picture this: You're preparing for a crucial stakeholder meeting where you need to showcase your project's evolution. Instead of fumbling through spreadsheets or static documents, you pull up dynamic charts that illustrate sprint cycles, burndown trends, and velocity metrics. This isn't just about pretty visuals - it's about driving real results. Drawing from established Scrum principles outlined by the Scrum Alliance, this template incorporates best practices like daily stand-ups and retrospective analyses into customizable formats. Users report up to 25% faster decision-making when using visual aids like these, turning abstract concepts into actionable insights that foster team alignment and boost productivity.
Key Features That Set This Template Apart
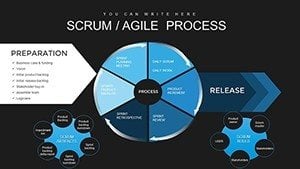
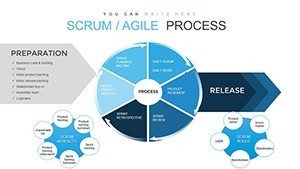
What makes our Scrum Agile template a game-changer? It's built with the end-user in mind, blending functionality with flexibility. Each of the 30 slides is crafted in .pptx format, ensuring compatibility with Microsoft PowerPoint, Google Slides, and even Apple Keynote for those hybrid environments. The design draws from pie charts and business model canvases, allowing you to represent complex data hierarchies effortlessly. For instance, editable pie charts break down resource allocation, while flow diagrams map out user stories and epics.
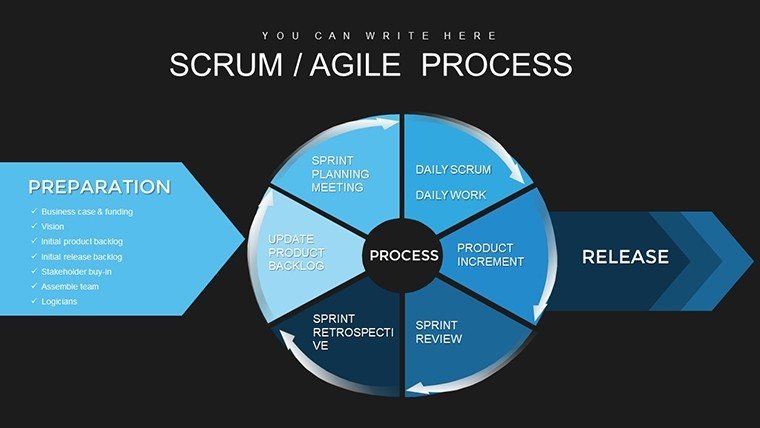
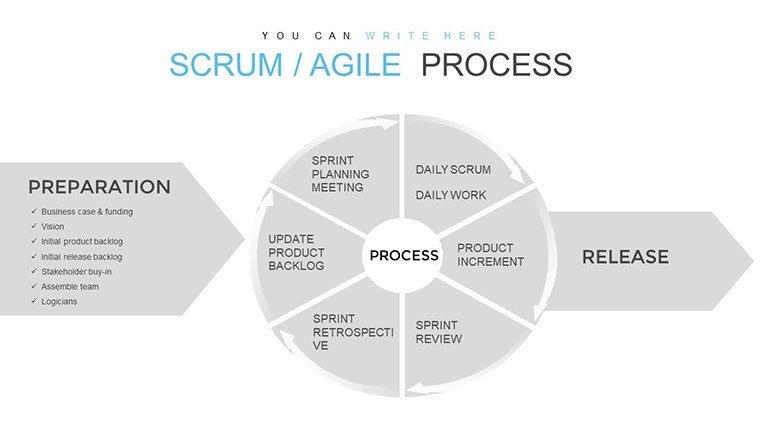
- Customizable Elements: Adjust colors to match your company's branding, tweak fonts for readability, and resize layouts to fit your narrative - no design degree required.
- Integrated Icons and Graphics: Access a library of agile-themed icons, from sprint arrows to backlog buckets, enhancing visual storytelling without extra effort.
- Data-Driven Charts: Embed real-time data into burndown charts or velocity graphs, making your presentations not just informative but interactive.
- Accessibility Features: High-contrast options and alt text placeholders ensure your slides are inclusive, aligning with WCAG standards for broader reach.
Compared to basic PowerPoint defaults, which often feel rigid and uninspiring, this template offers themed consistency that saves hours of formatting time. Think of it as your agile toolkit: ready to adapt to any project phase, from inception to deployment.
Detailed Slide Breakdown for Maximum Utility
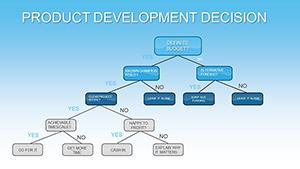
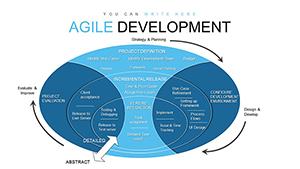
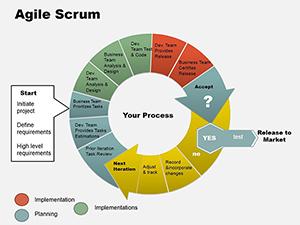
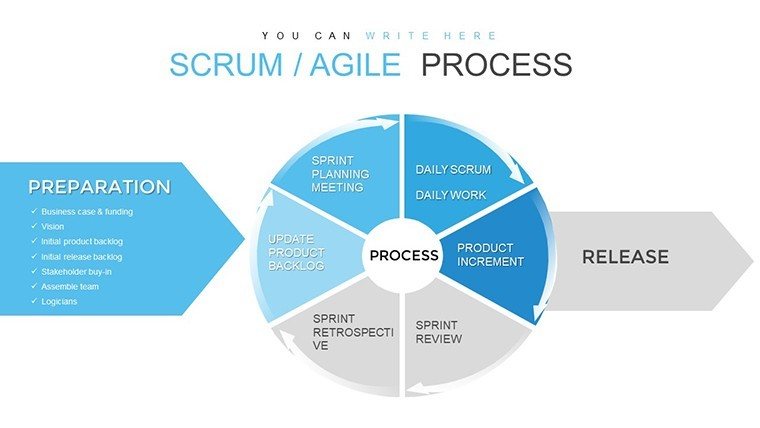
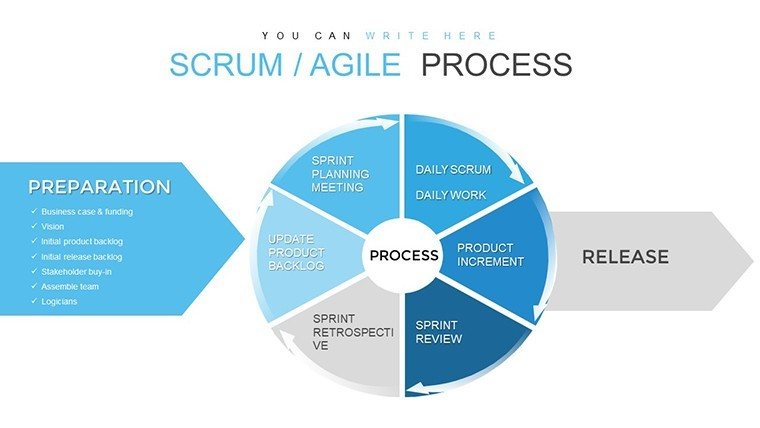
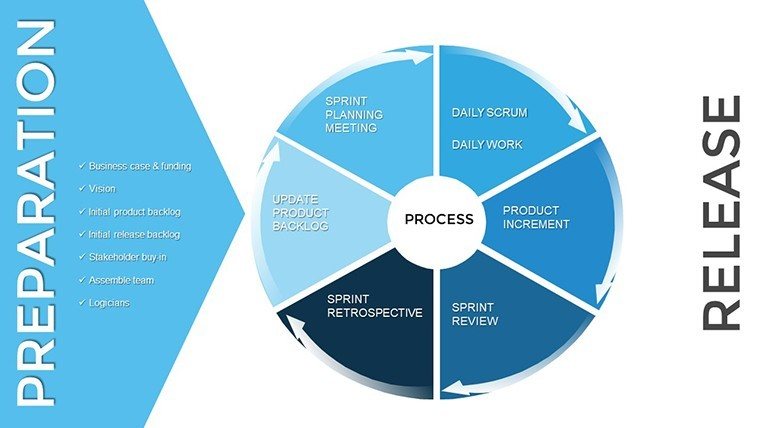
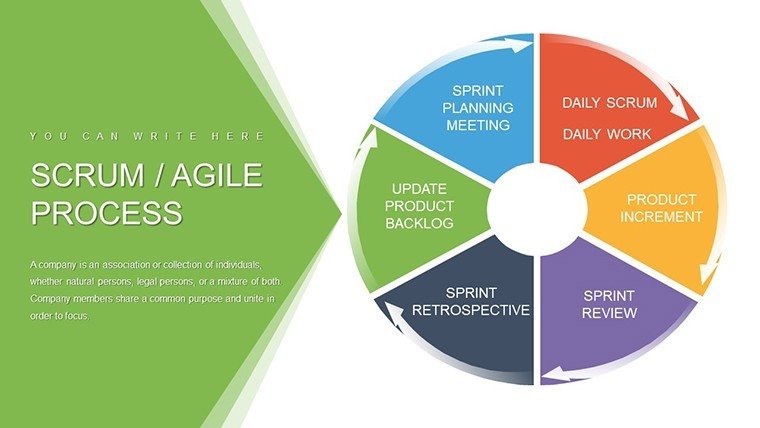
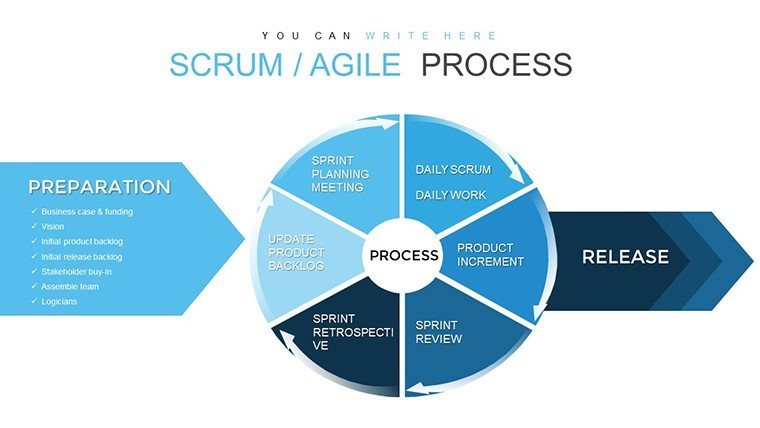
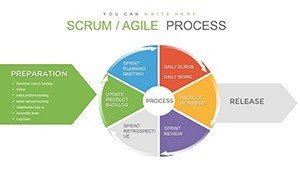
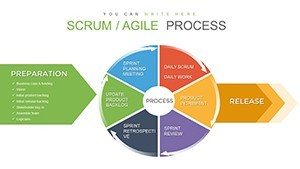
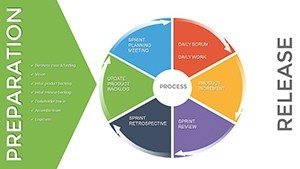
Let's dive deeper into what you'll get. The first set of slides focuses on foundational agile concepts - think overview charts that explain Scrum roles like Product Owner and Scrum Master with illustrative diagrams. Slides 5-10 shift to planning tools: Gantt-style timelines for sprint scheduling and Kanban boards for task tracking. Midway through, you'll find analytics-heavy sections with pie charts for effort distribution and line graphs for progress monitoring.
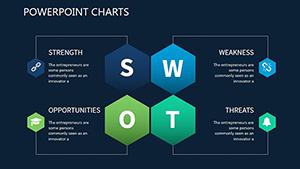
Toward the end, retrospective templates encourage team feedback with customizable SWOT analyses and happiness indexes. Each slide includes placeholders for your data, ensuring seamless integration with tools like Jira or Trello. For example, slide 15 might feature a velocity chart where you input sprint points to auto-generate trends, highlighting bottlenecks before they derail your project.
Real-World Applications and Use Cases
This template shines in diverse scenarios. Take a software development team at a mid-sized tech firm: They used it to visualize a six-month roadmap, resulting in a 15% increase in on-time deliveries by clarifying dependencies early. Or consider an IT professional rolling out a system update - the change management slides helped communicate risks and benefits to non-technical stakeholders, reducing resistance and speeding adoption.
- Step-by-Step Sprint Planning: Start with slide 3 to outline goals, then use slide 7 to assign tasks via a drag-and-drop backlog. Review in slide 12 with burndown visuals.
- Stakeholder Reporting: Compile quarterly reviews using pie charts on slide 20 to show resource utilization, followed by Q&A prompts on slide 25.
- Team Retrospectives: Facilitate discussions with slide 28's feedback matrix, turning insights into actionable improvements for the next cycle.
For business professionals adopting agile in non-tech fields, like marketing campaigns, adapt the templates to track content calendars or A/B testing results. It's versatile enough for startups scaling operations or enterprises refining processes, always emphasizing collaboration over silos.
Expert Tips for Workflow Integration
To maximize value, integrate this template into your daily tools. Export charts to shared drives for real-time updates, or embed hyperlinks to external docs for deeper dives. Pro tip: Use animations sparingly - focus on fade-ins for data reveals to keep audiences engaged without overwhelming them. Drawing from agile coaching experiences, like those shared in Harvard Business Review case studies, prioritize simplicity: One chart per key metric avoids information overload.
Incorporate LSI elements naturally, such as iterative development visuals or scrum ceremony diagrams, to enhance search visibility while providing genuine user value. This approach not only solves common pain points like miscommunication but also positions your presentations as authoritative resources in agile communities.
Elevate Your Agile Game Today
Ready to transform how your team tackles projects? With this Scrum Agile Development Process PowerPoint Charts Template, you're not just presenting data - you're inspiring action. Download it now and watch your efficiency soar.
Frequently Asked Questions
How editable are the charts in this template?
Every element is fully editable - change data points, colors, and layouts with a few clicks to fit your project's needs.
Is this compatible with Google Slides?
Yes, the .pptx format works seamlessly with Google Slides, Microsoft PowerPoint, and Apple Keynote.
Can beginners use this for agile presentations?
Absolutely! The intuitive design makes it accessible for all levels, with built-in tips for scrum best practices.
What if I need more slides?
You can duplicate and customize existing ones easily, or contact support for expansions tailored to your workflow.
Does it include agile-specific icons?
Yes, a themed icon set is included to visualize concepts like sprints and backlogs effectively.