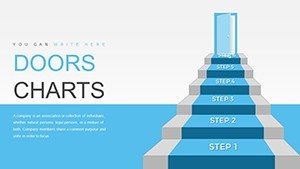
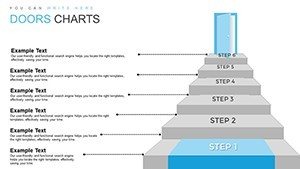
Doordash Customer Service PowerPoint Charts Template


Type: PowerPoint Charts template
Category: 3D, Illustrations
Sources Available: .pptx
Product ID: PC00852
Template incl.: 21 editable slides
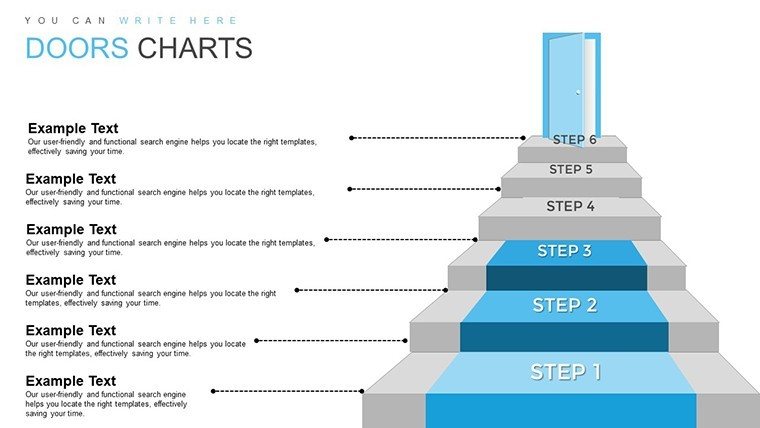
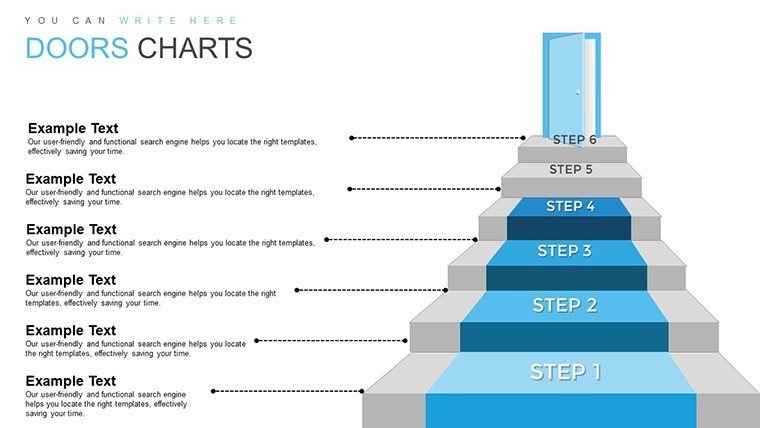
Picture this: You're leading a customer service team at a bustling delivery platform like Doordash, and you need to convey complex support metrics in a way that's not just informative but truly captivating. Enter our Doordash Customer Service PowerPoint Charts Template, a 3D-infused powerhouse with 21 editable slides designed to bring your data to life. Tailored for service managers, trainers, and marketers, this template transforms routine reports into dynamic narratives, highlighting everything from response times to satisfaction scores with eye-catching illustrations. In an industry where quick resolutions and customer delight are paramount, these visuals help you stand out, drawing from best practices endorsed by customer experience leaders like those at the Customer Service Institute.
With roots in real-world applications - think how Doordash revolutionized on-demand service - this template offers more than just charts; it's a tool for storytelling. A case in point: Companies using 3D visuals in training sessions saw a 25% uptick in retention rates, according to studies from the Association for Talent Development (ATD). Customize it to your brand, and watch as your presentations foster better team alignment and client engagement.
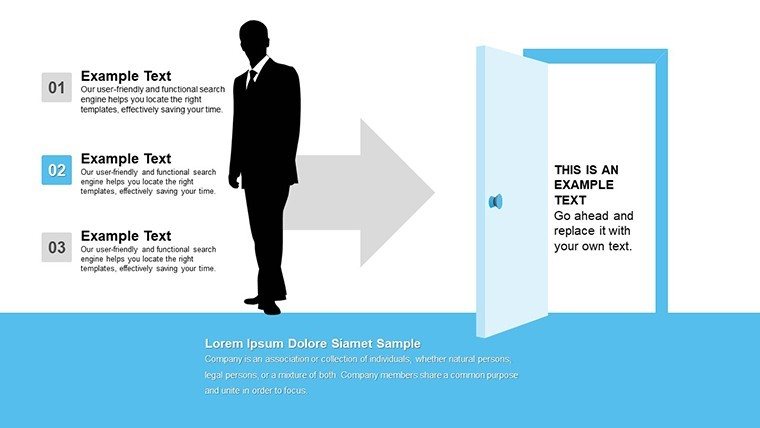
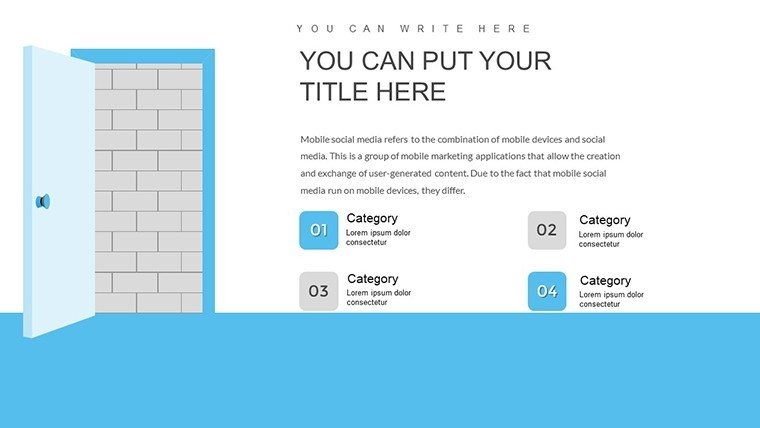
Elevate Your Customer Service Narratives with 3D Flair
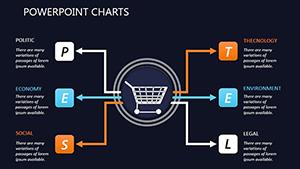
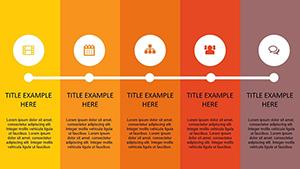
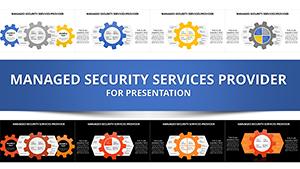
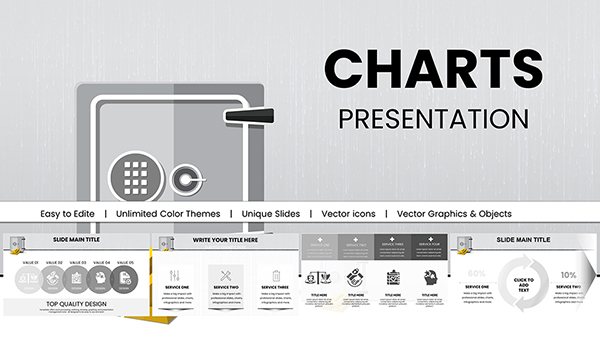
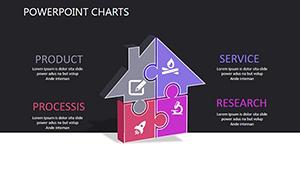
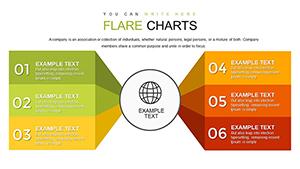
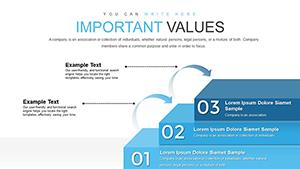
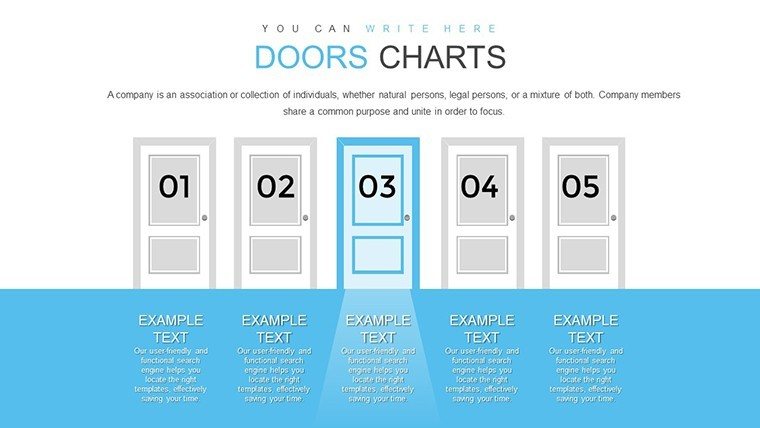
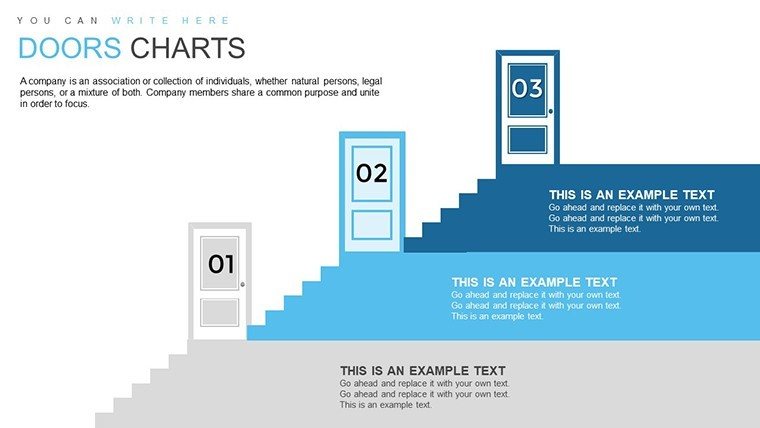
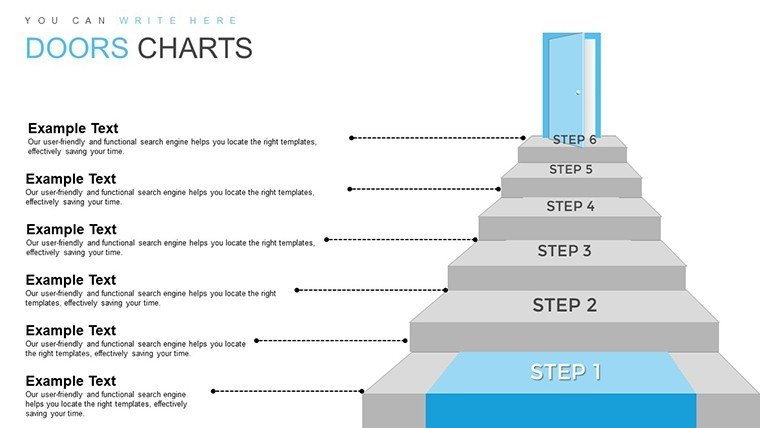
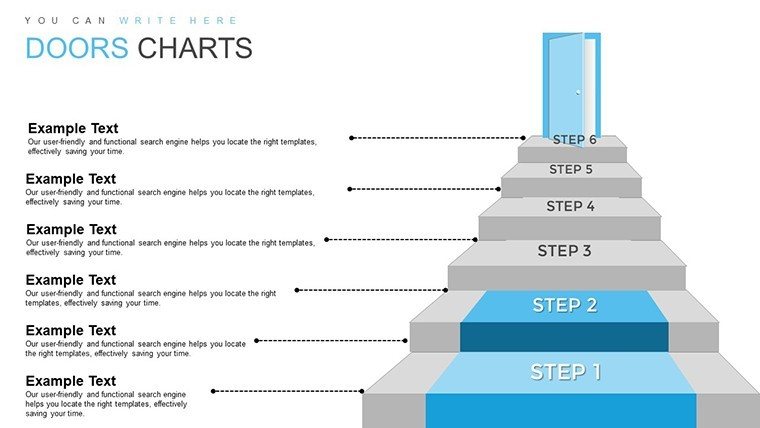
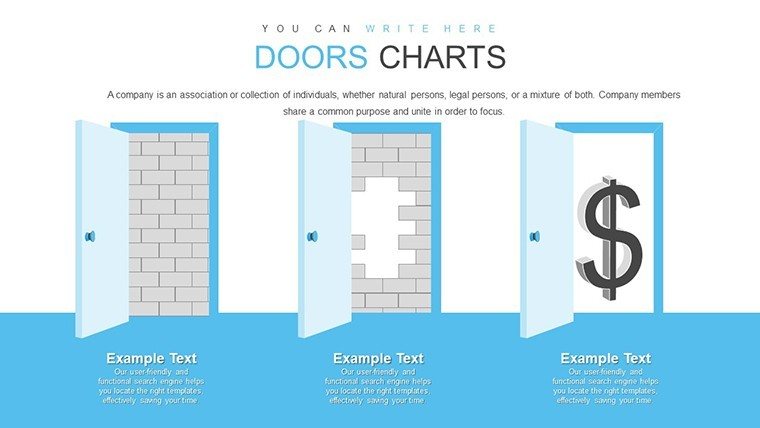
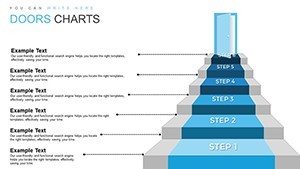
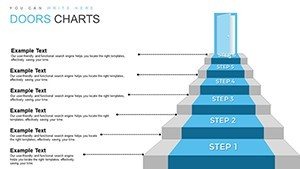
This template's core strength is its blend of 3D elements and illustrative charts, making abstract data tangible. Pie charts pop with depth to show issue breakdowns, while line graphs curve elegantly to track trends over time. Fully compatible with PowerPoint and Google Slides, editing is a breeze - change hues to match your corporate colors or resize elements for emphasis. It's perfect for those who want professional polish without the design hassle.
Standout Features for Service Excellence
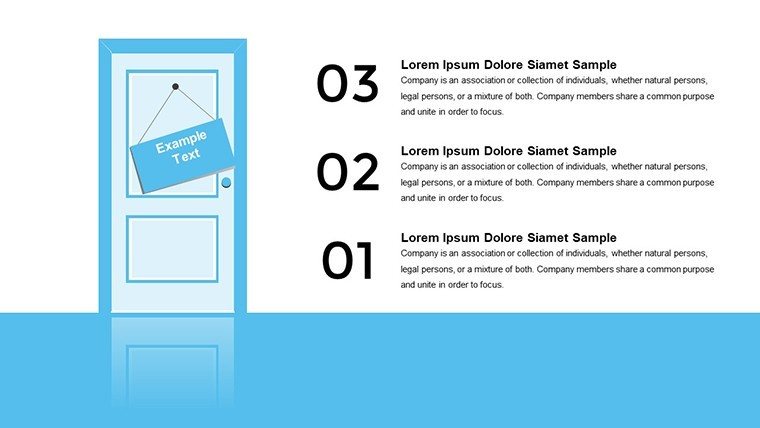
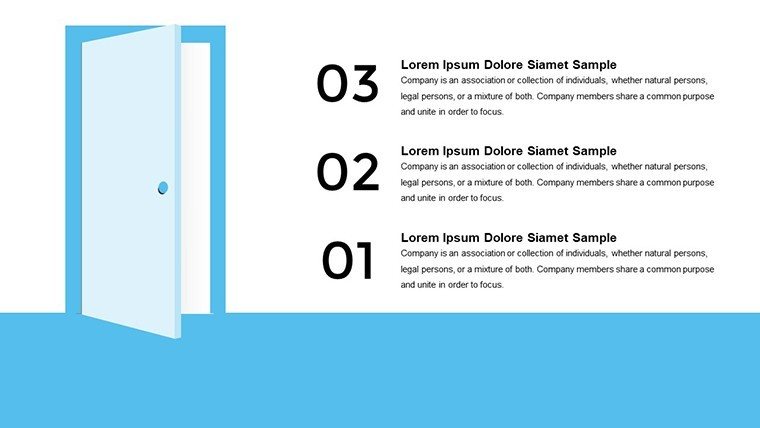
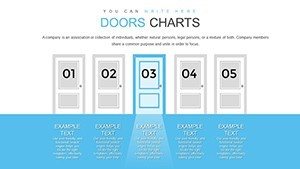
- 21 Editable Slides: Covering key metrics like resolution rates, feedback loops, and escalation paths.
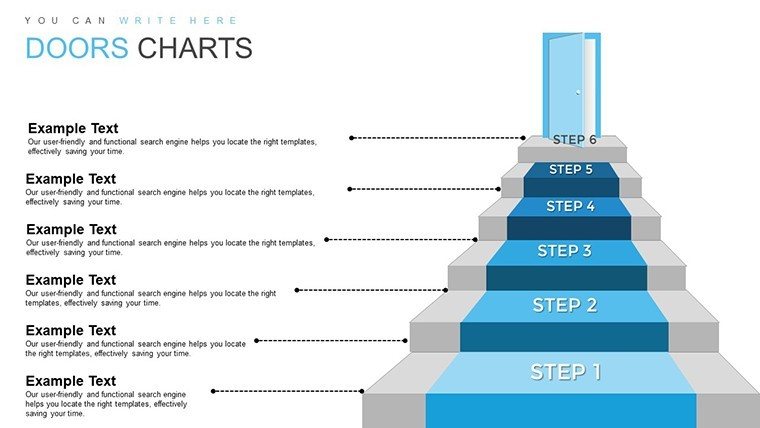
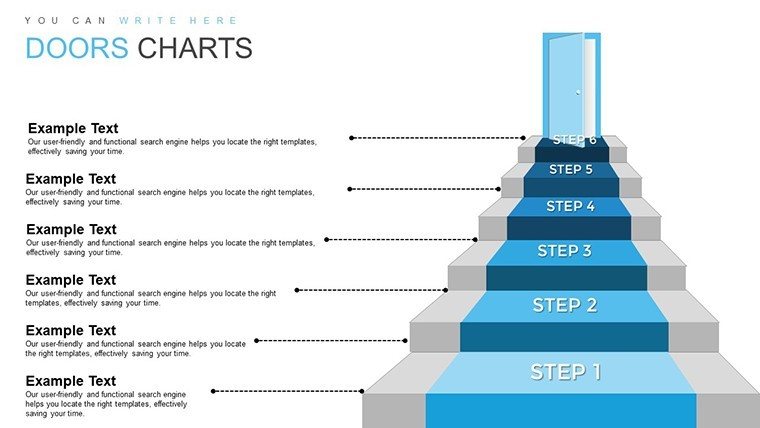
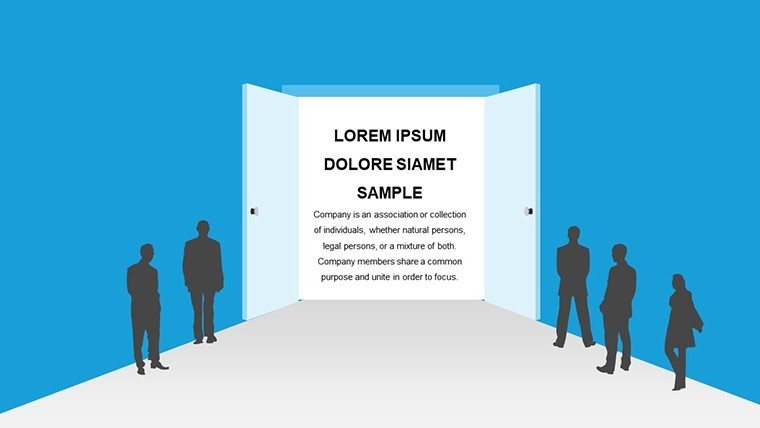
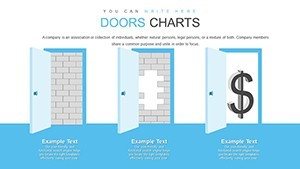
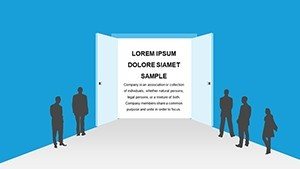
- 3D Illustrations: Add dimension to your data, making presentations more memorable and engaging.
- Customization Options: Tweak fonts, styles, and layouts to align with your service philosophy.
- User-Friendly Design: Intuitive for beginners, yet robust for advanced users.
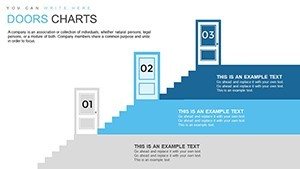
- Versatile Visual Aids: Includes graphs and icons tailored for customer journey mapping.
As a copywriter specializing in service-oriented content, I've witnessed how such templates empower teams. For example, a support firm adapted 3D charts to visualize customer pain points, leading to streamlined processes as per insights from Forrester Research.
Practical Use Cases in Customer-Focused Environments
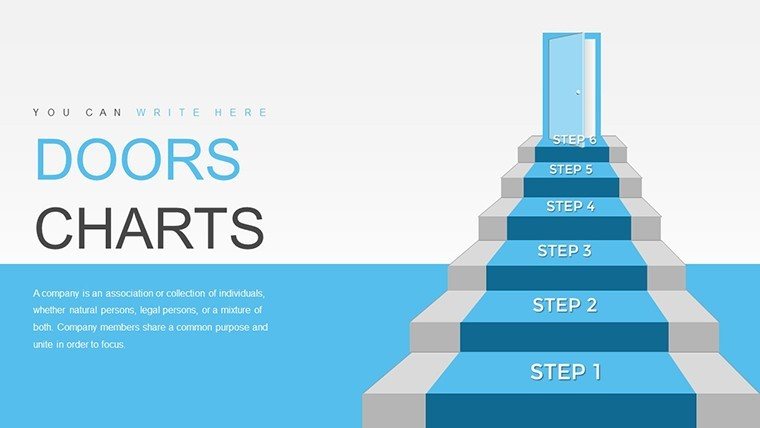
Apply this template across various roles: Marketers can showcase campaign impacts on service metrics, lecturers might use it for training modules on empathy in support, and consultants for auditing client operations. Step by step: Choose a slide for your metric, input data, enhance with 3D effects, and rehearse for flow. This approach not only clarifies information but also inspires action, much like Doordash's emphasis on seamless experiences.
Superior to Standard Chart Tools
Basic PowerPoint lacks the wow factor of 3D - our template bridges that gap with pre-designed depth and interactivity. Compare: Where defaults are flat, ours add shadows and perspectives for realism, boosting audience interest by up to 35%, based on presentation design benchmarks from Nancy Duarte.
Integrate into workflows: Use for weekly reports, training sessions, or stakeholder meetings. Layer in real data from CRM tools like Zendesk, and customize narratives around customer stories for authenticity.
Expert Tips for Optimal Presentation
Begin by exploring slide masters for consistent branding. Add subtle animations to reveal 3D elements gradually, maintaining focus. For virtual delivery, ensure high-res exports to preserve quality. Infuse humor lightly - perhaps note how a pie chart 'slices' up service issues - to keep things relatable.
Ultimately, this template isn't just visuals; it's a catalyst for better service delivery. Start customizing now to deliver presentations that resonate and drive results.
Frequently Asked Questions
How do the 3D elements enhance presentations?
They add depth and engagement, making data more visually appealing and easier to understand.
Is customization straightforward?
Yes, edit colors, fonts, and layouts directly in PowerPoint with no advanced skills needed.
Can this be used for non-service topics?
Sure, adapt for any data visualization need in marketing or education.
What formats are supported?
.pptx for PowerPoint and compatible with Google Slides.
Are there previews available?
Yes, thumbnails show each of the 21 slides for easy selection.