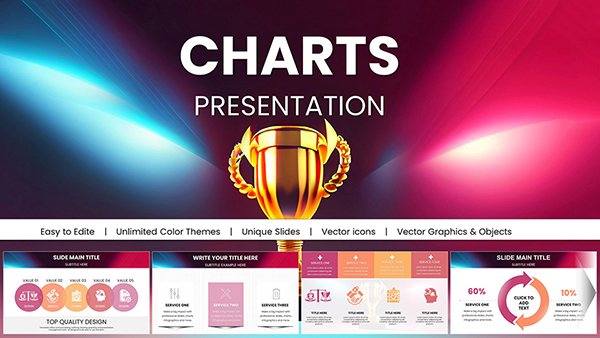
Leader PowerPoint Charts Template for Presentation


Type: PowerPoint Charts template
Category: Relationship
Sources Available: .pptx
Product ID: PC00827
Template incl.: 26 editable slides
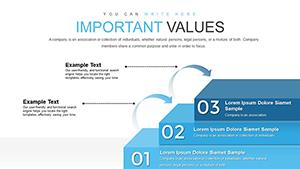
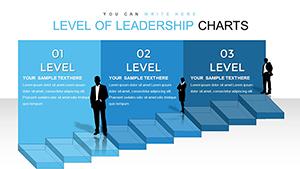
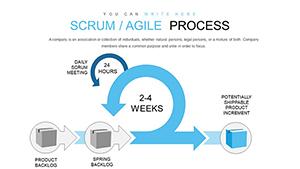
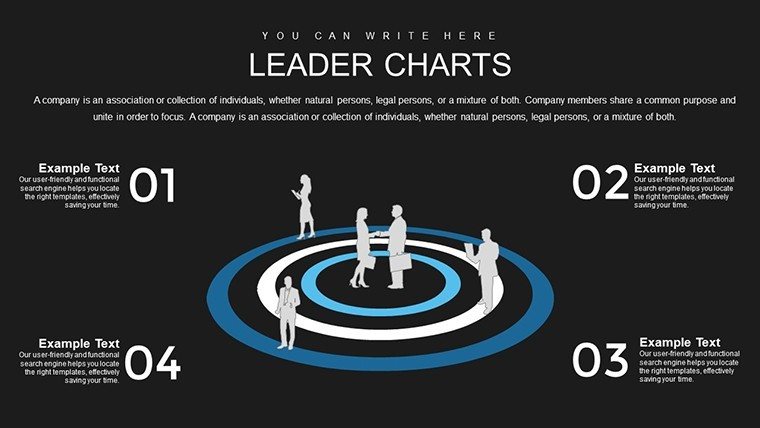
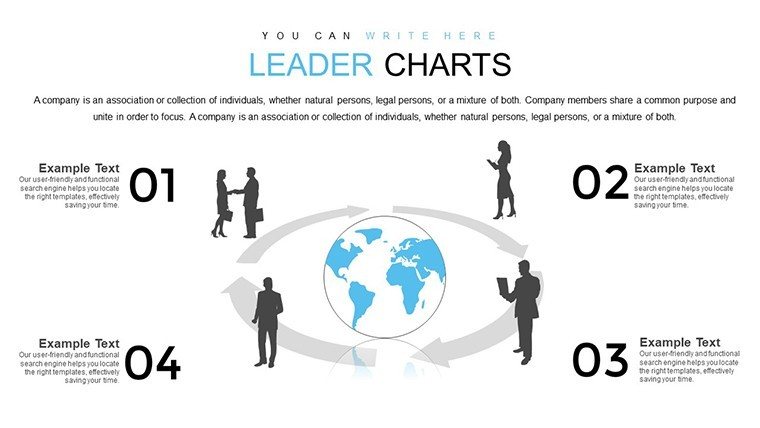
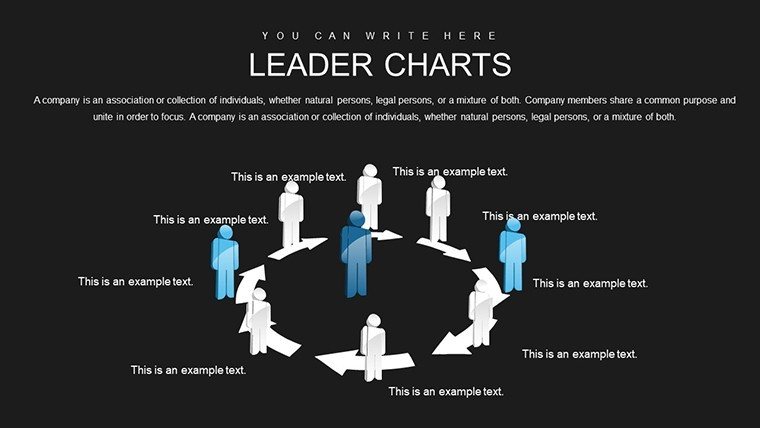
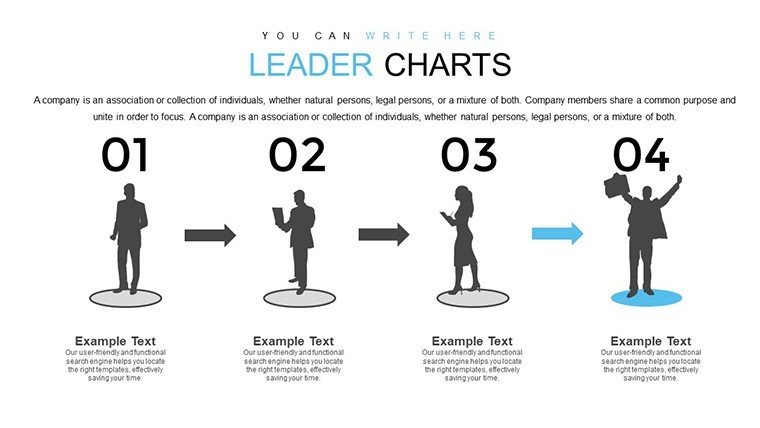
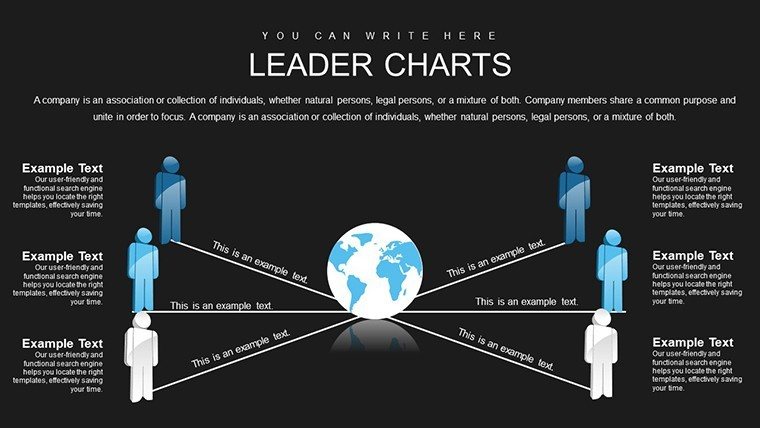
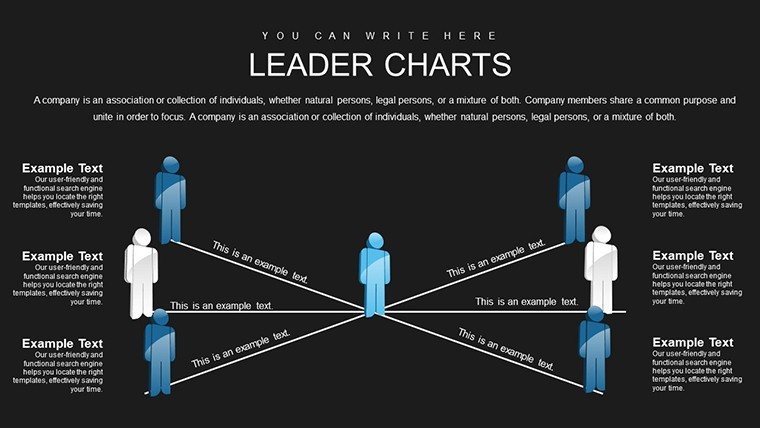
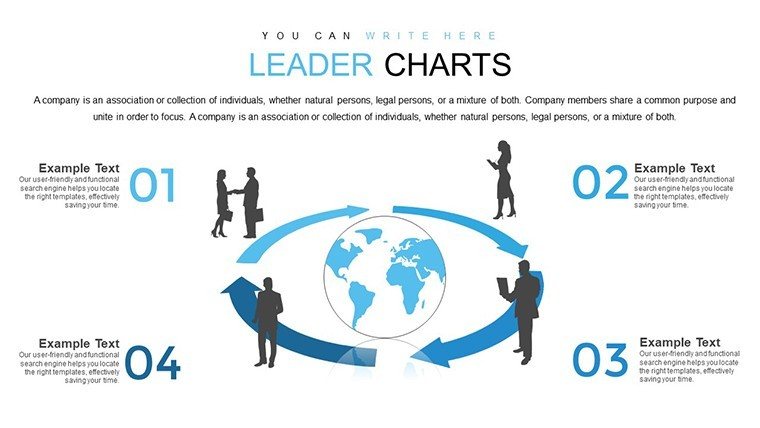
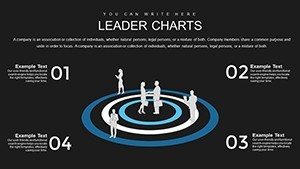
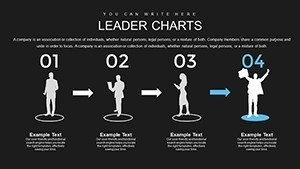
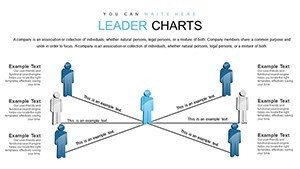
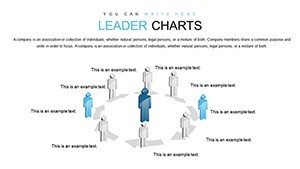
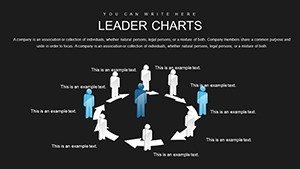
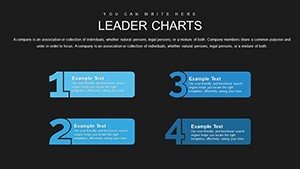
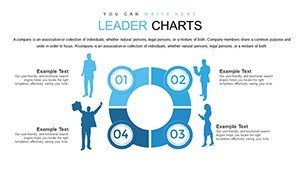
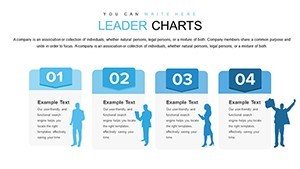
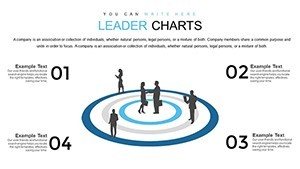
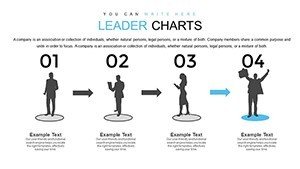
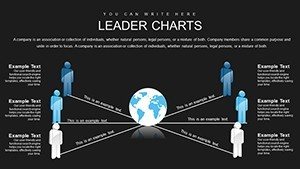
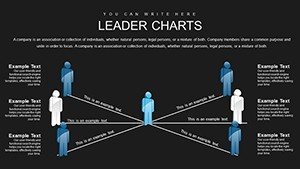
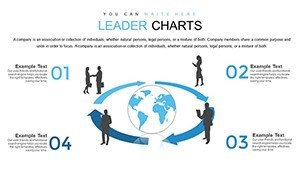
Leadership demands not just vision but the ability to communicate it effectively. Enter our Leader PowerPoint Charts Template, a powerhouse of 26 editable slides designed to help you lead conversations with data-backed confidence. From bar graphs illustrating growth metrics to pie charts breaking down team allocations, this template turns abstract ideas into tangible visuals. Tailored for executives, educators, and speakers, it bridges the gap between information and inspiration, ensuring your message lands with authority.
Why settle for mundane slides when you can command attention? Compatible with PowerPoint and Google Slides, these charts offer sleek designs that adapt to your style. In a boardroom setting, visualize strategic plans; in a classroom, simplify statistics for eager minds. Even in creative fields like architecture, where leading a design review involves charting project hierarchies, this template provides the tools to assert leadership without overwhelming complexity. The outcome is presentations that motivate, fostering collaboration and driving results.
Core Features That Set Leaders Apart
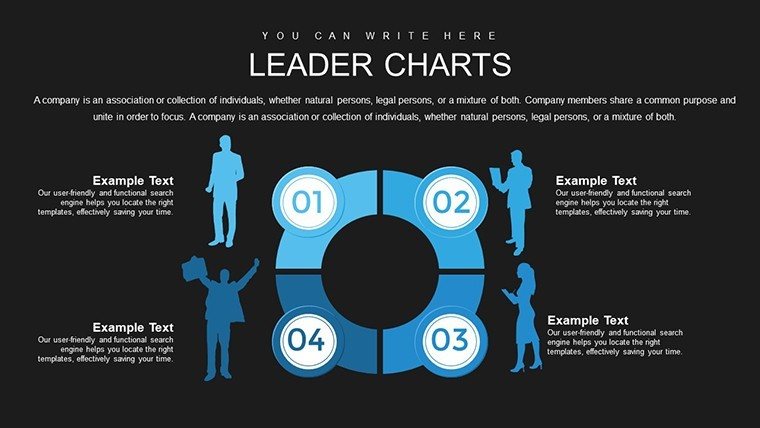
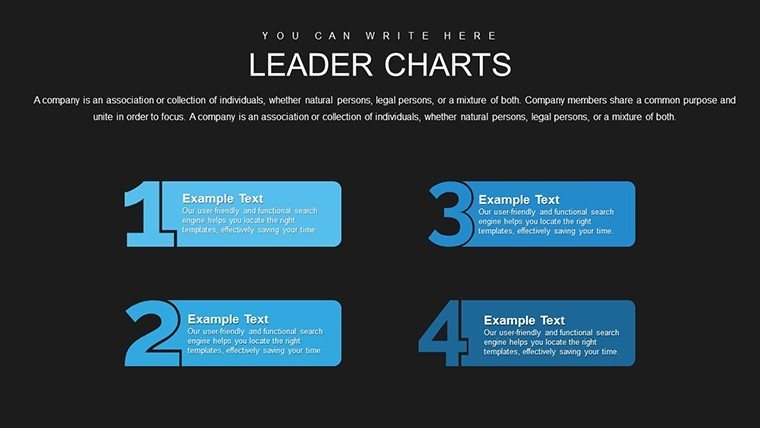
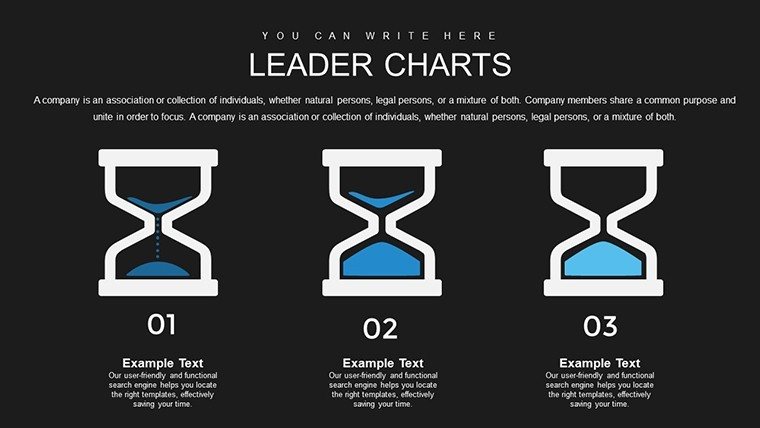
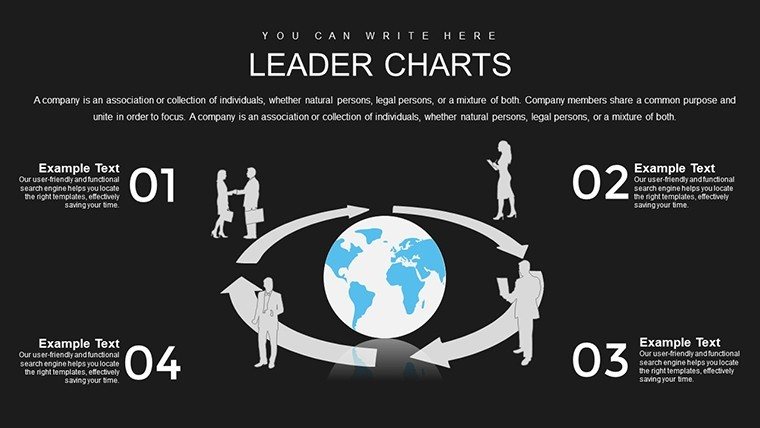
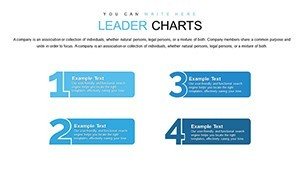
Explore the robust toolkit within these 26 slides. Slide 2 might feature a dynamic bar graph for performance tracking, while slide 15 offers scatter diagrams for correlation analysis. Every chart is editable, allowing font changes, color schemes, and layout tweaks to align with your branding.
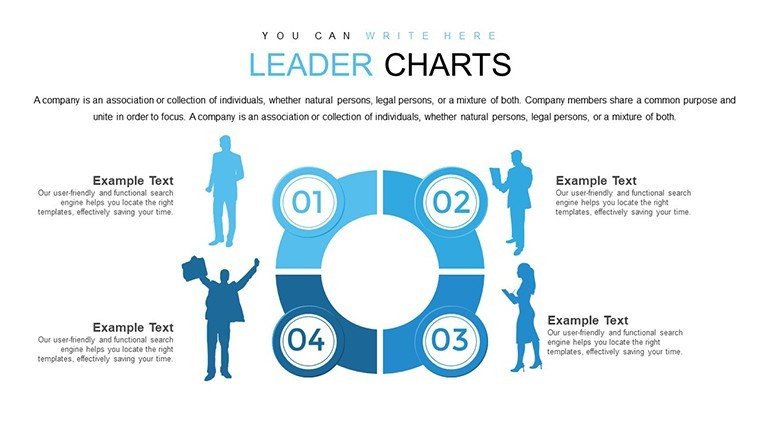
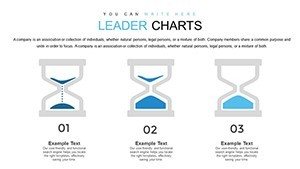
- Diverse Graph Options: Bars, pies, lines, and scatters cover all data needs.
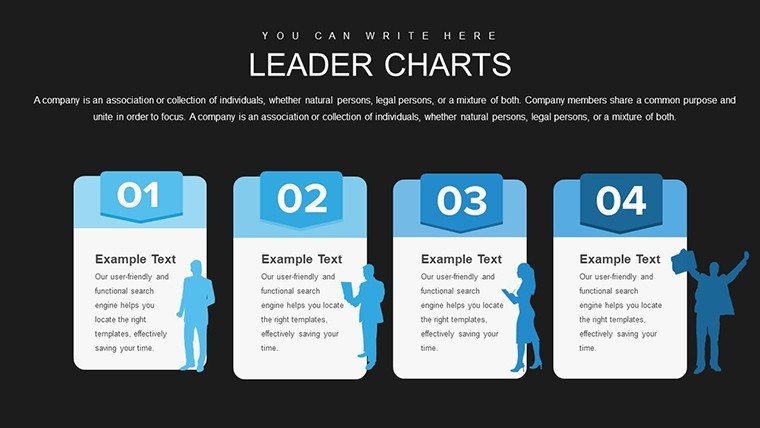
- User-Friendly Interface: Drag-and-drop simplicity for quick edits.
- Professional Polish: High-resolution elements ensure crisp visuals on any screen.
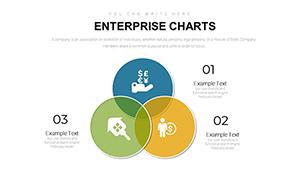
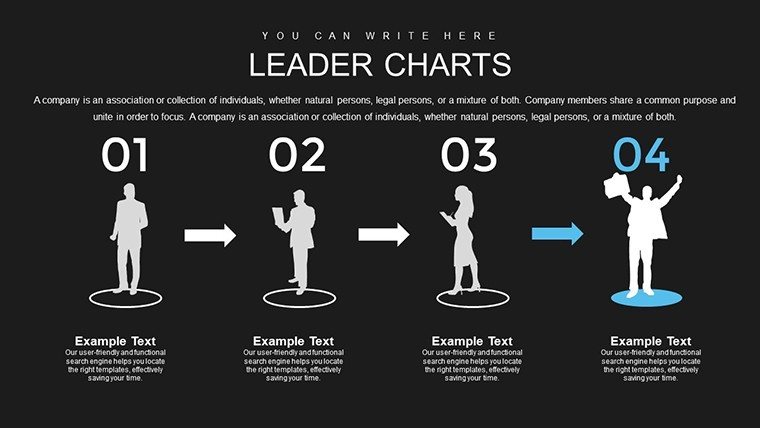
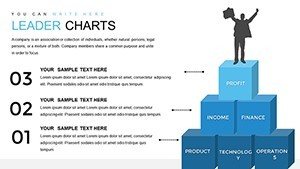
- Icon Integration: Leadership-themed icons like trophies or arrows enhance narratives.
Unlike default PowerPoint charts, ours include layered effects for depth, making your data pop in ways that engage rather than bore. It's like having a design assistant at your fingertips.
Practical Use Cases for Everyday Leaders
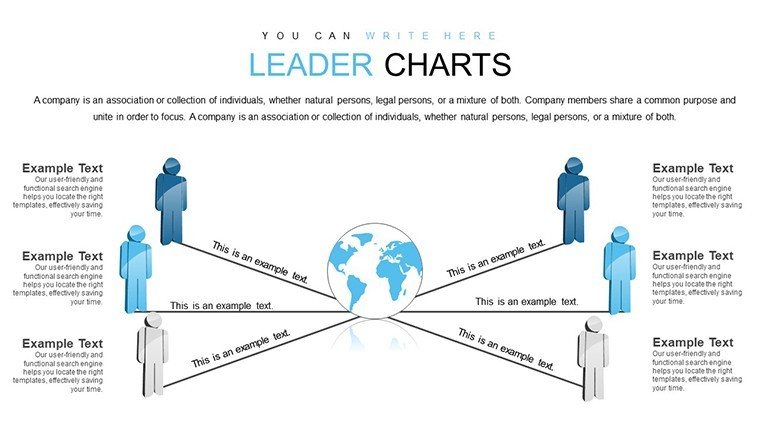
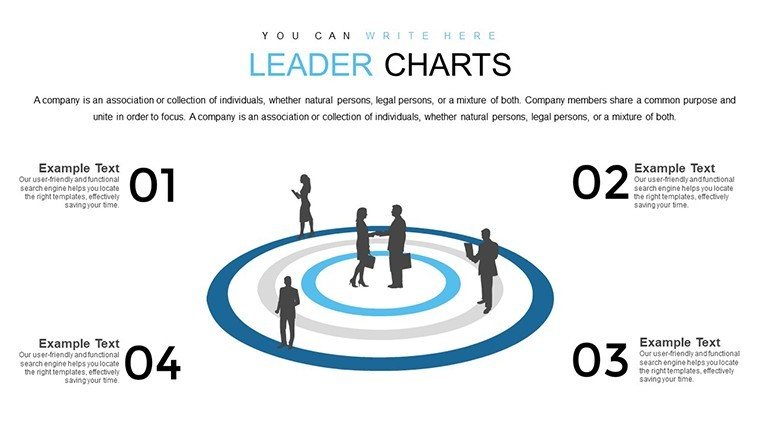
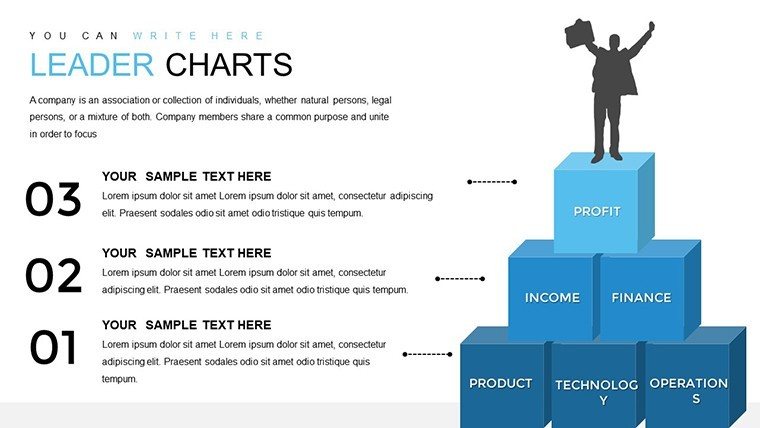
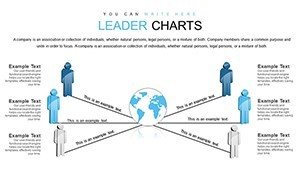
Envision an architecture firm leader using these charts in a client meeting. Slide 8's pie chart divides budget allocations per project phase, referencing AIA guidelines for transparent costing, building client trust and securing approvals. Educators can chart student progress trends, sparking discussions on improvement strategies.
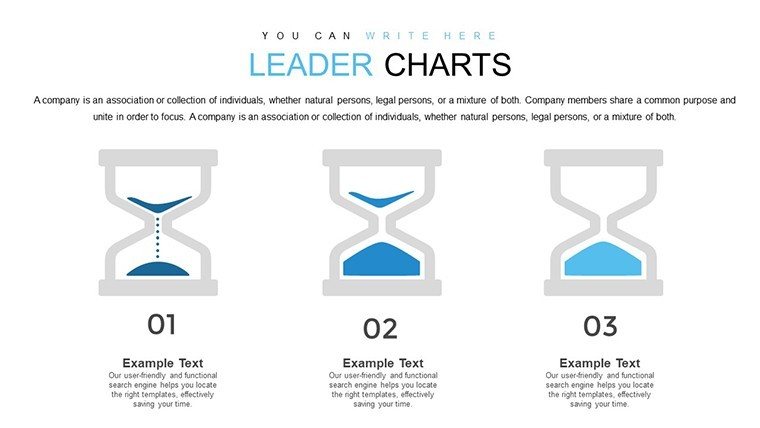
Public speakers leverage line plots to show career trajectories, inspiring audiences with real journeys. The benefits? Enhanced persuasion - studies show visuals increase retention by 65%. This template saves design time, letting you focus on leading the dialogue.
Customizing for Maximum Leadership Impact
- Acquire the Template: Download instantly post-purchase.
- Choose Your Chart: Select from 26 based on data type.
- Populate with Data: Input figures; auto-adjust features handle the rest.
- Refine Visuals: Add animations or hyperlinks for interactivity.
- Deliver with Confidence: Practice with speaker notes embedded.
Integrate with tools like Zoom for virtual leadership sessions. Tip: For architecture leaders, incorporate blueprint icons to contextualize data, making abstract metrics feel grounded in reality.
Design Strategies to Amplify Your Voice
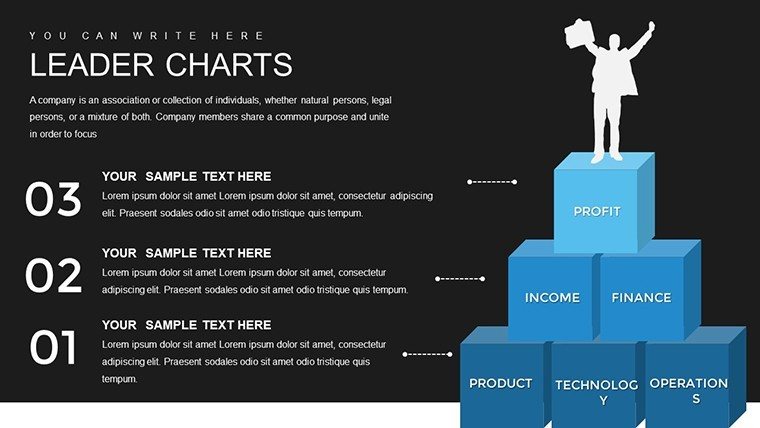
Employ hierarchy in your slides - bold titles for emphasis, subtle shades for backgrounds. Draw from leadership principles like those in Simon Sinek's works, using charts to illustrate 'why' behind the 'what.' A speaker once used this template for a TED-style talk, boosting engagement scores notably.
Such applications highlight the template's trustworthiness in professional circles.
The Edge of Leading with Data
What distinguishes this from competitors? Its focus on leadership-oriented visuals, enabling nuanced storytelling. For standards like PMI in project management, charts provide evidentiary support. Embrace this tool to lead more effectively.
Step up your game - download this template now and inspire your next audience with unparalleled clarity.
Frequently Asked Questions
What chart types are included?
A variety: bars, pies, lines, scatters, all fully editable.
Does it support team collaboration?
Yes, via Google Slides or shared PowerPoint files.
Are the designs mobile-friendly?
Absolutely, high-res elements scale perfectly.
Can I add custom icons?
Easily - import your own for personalization.
Is there a refund policy?
Check our terms; satisfaction is key.
How do animations work?
Pre-set options; customize timing as needed.