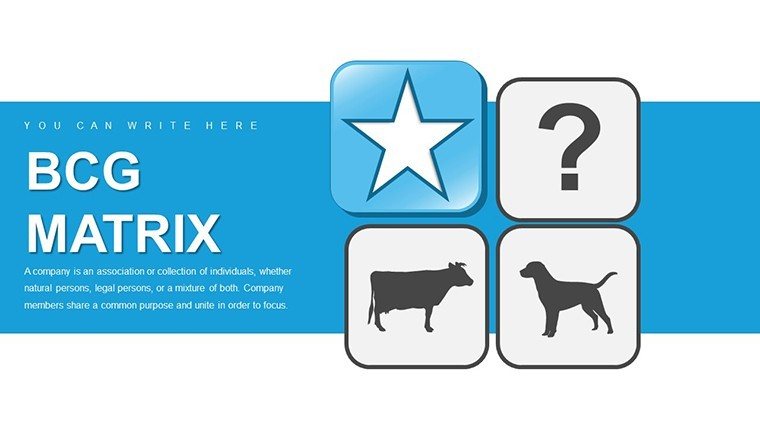
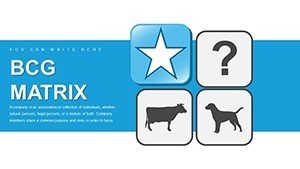
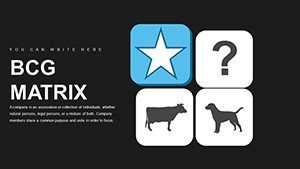
BCG Matrix PowerPoint Charts Template for Strategy


Type: PowerPoint Charts template
Category: Business Models, Tables
Sources Available: .pptx
Product ID: PC00807
Template incl.: 26 editable slides
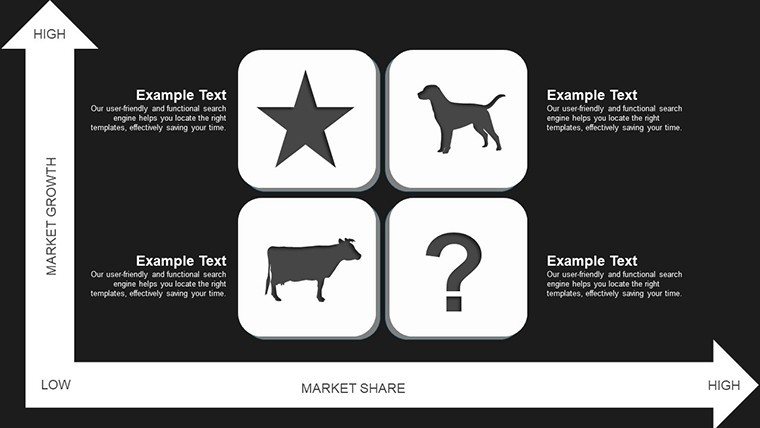
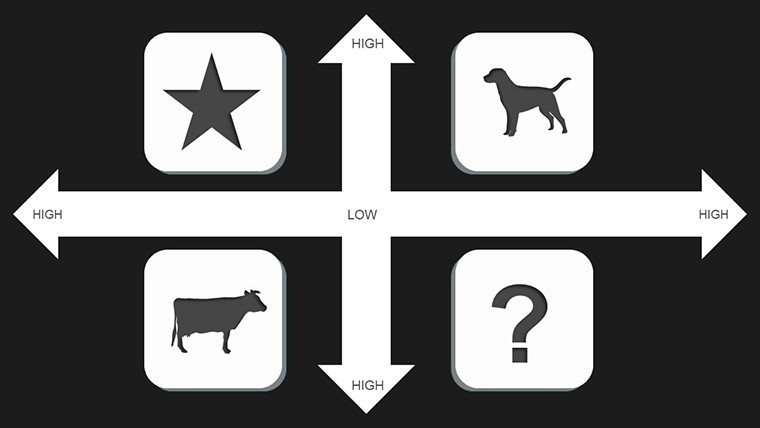
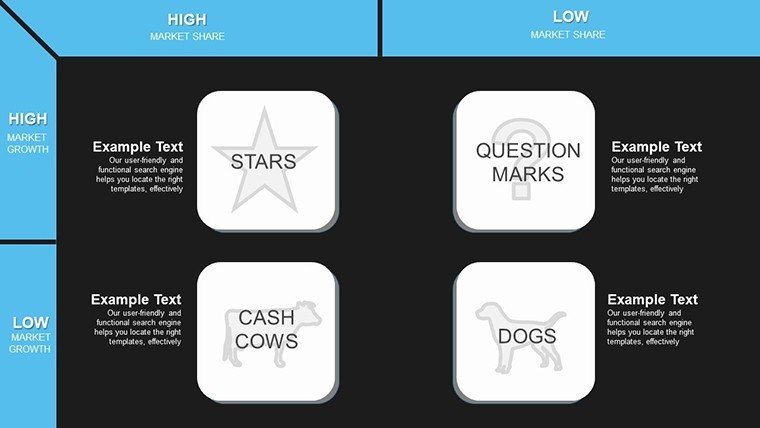
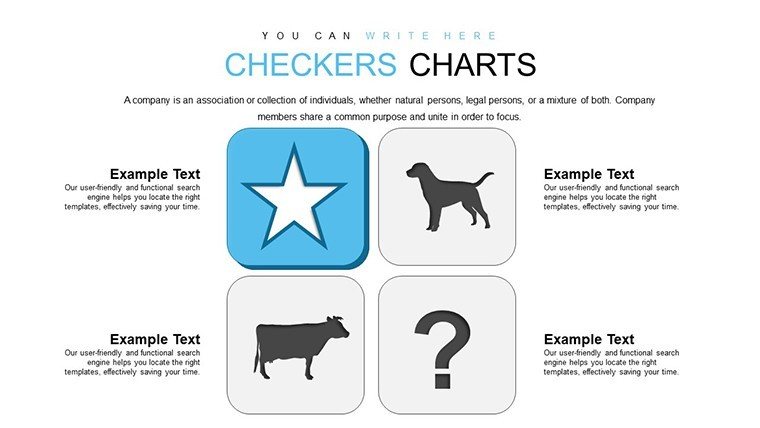
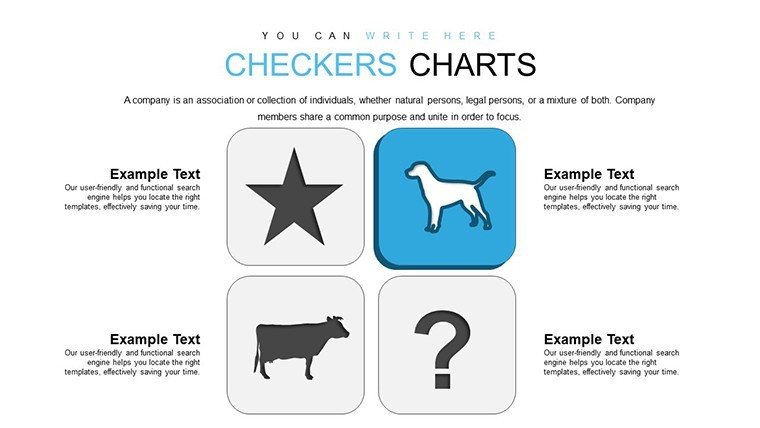
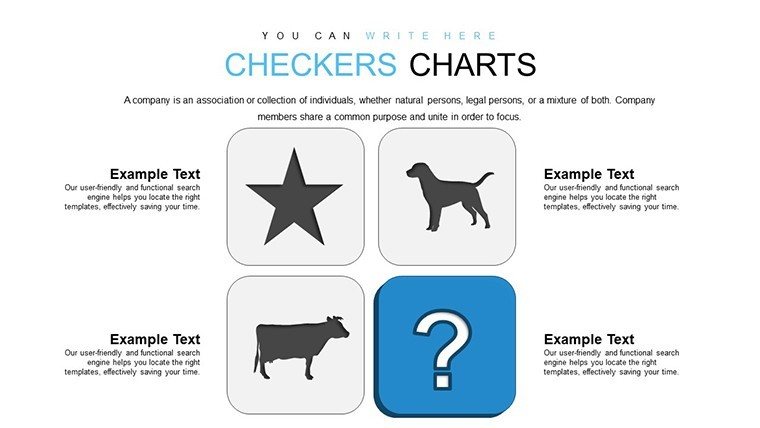
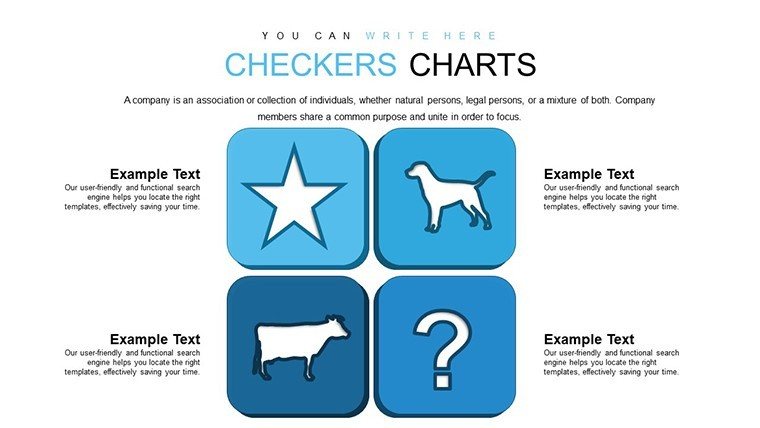
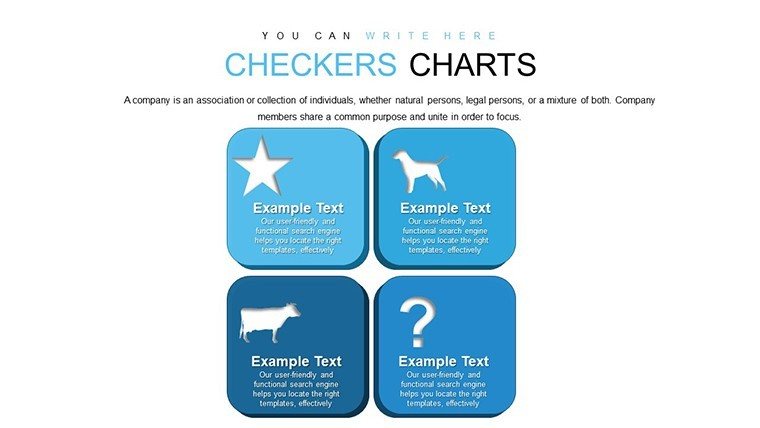
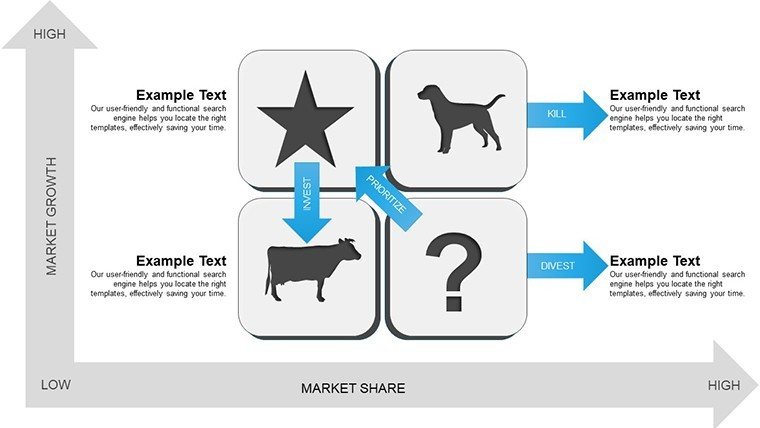
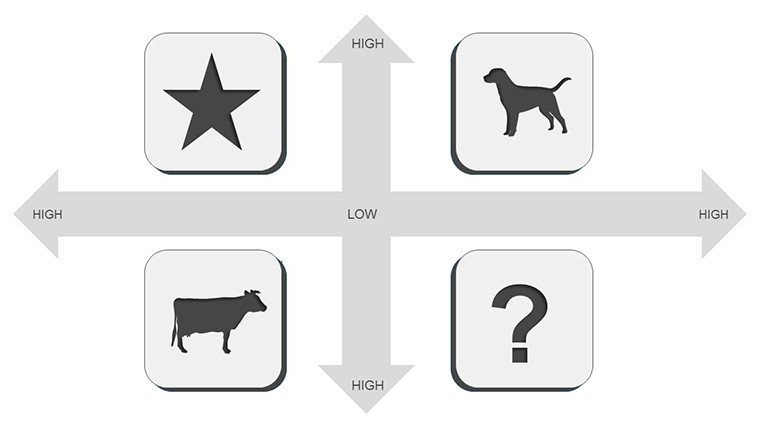
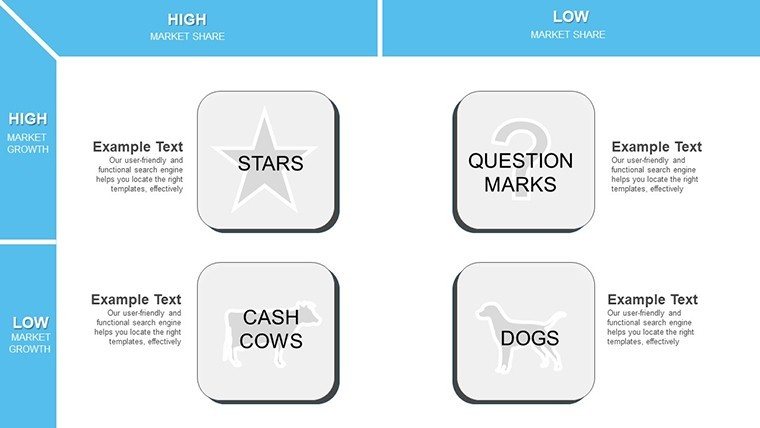
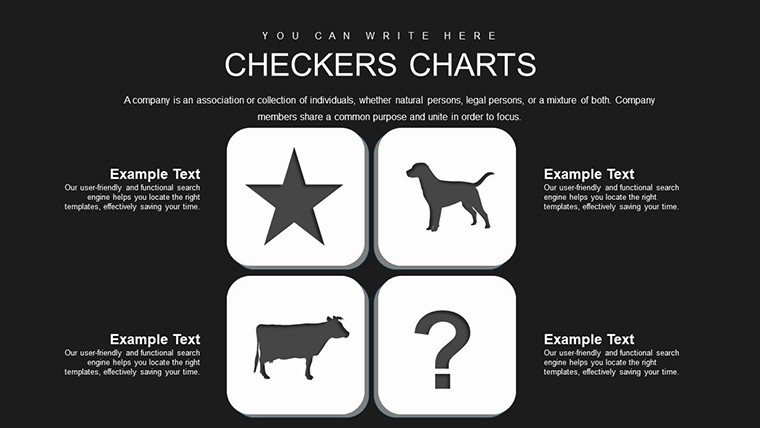
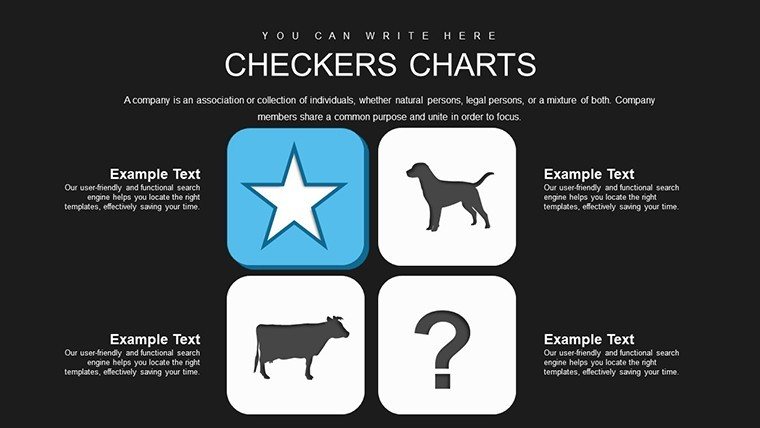
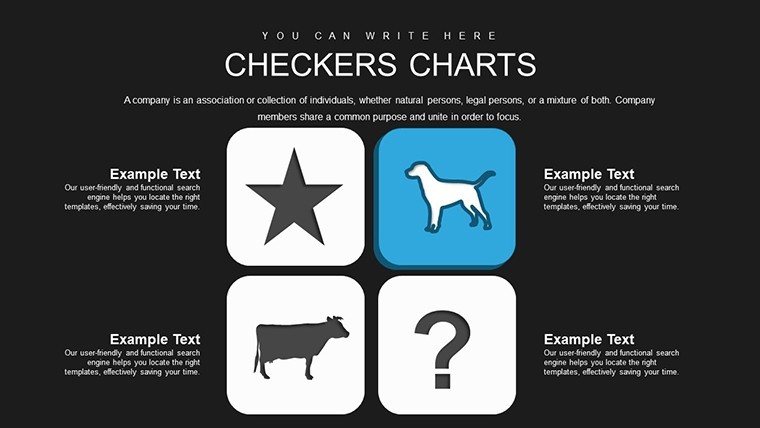
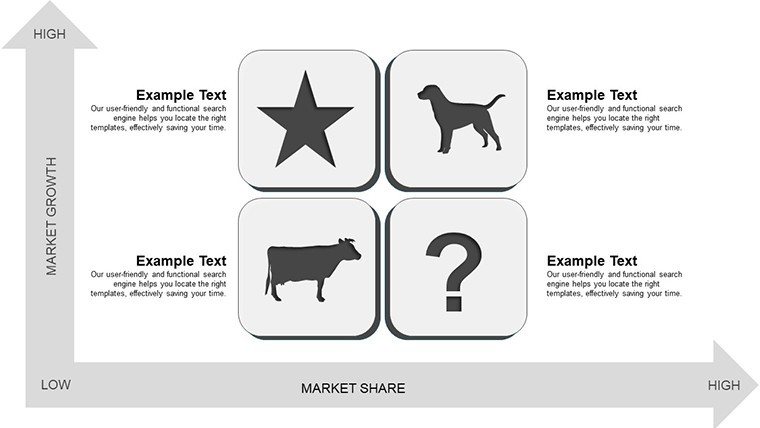
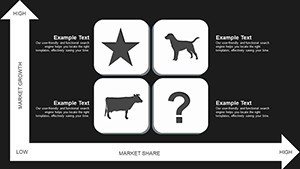
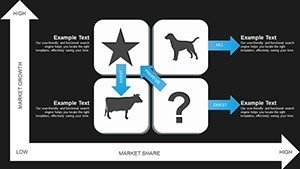
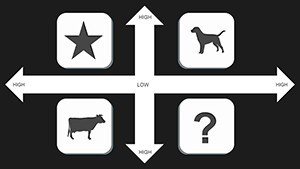
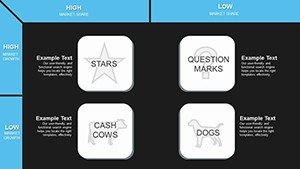
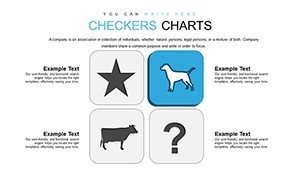
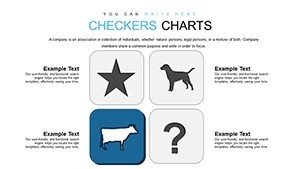
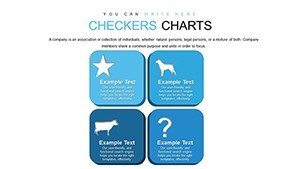
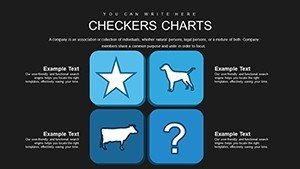
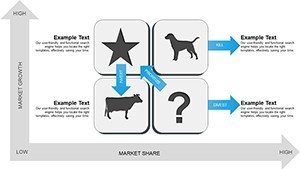
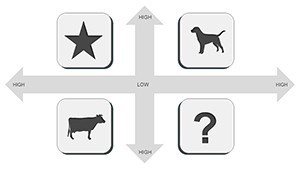
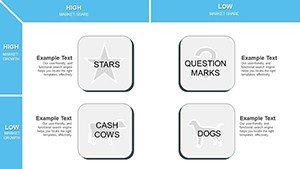
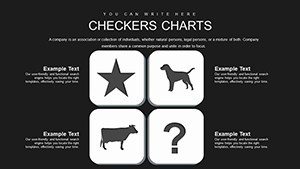
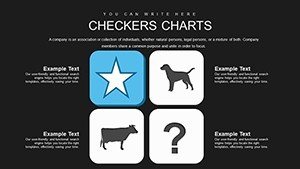
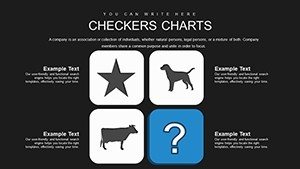
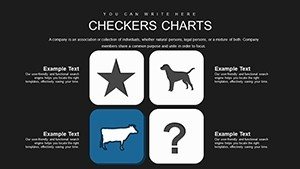
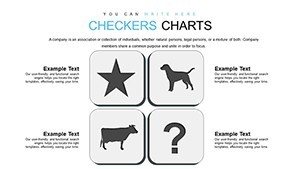
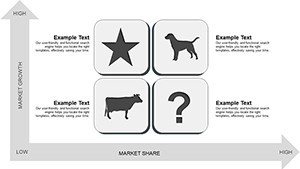
Picture this: You're in a high-stakes meeting, unveiling a strategy that could redefine your company's trajectory. Our BCG Matrix PowerPoint Charts Template equips you with the visuals to make that happen. Focused on the classic Growth-Share Matrix, this set of 26 editable slides helps categorize products into Stars, Cash Cows, Question Marks, and Dogs, providing a clear lens for resource allocation. Tailored for business analysts, consultants, and executives, it bridges the gap between data and decision-making, compatible with PowerPoint and easily adaptable to Google Slides.
Inspired by Boston Consulting Group's timeless framework, this template draws on proven strategic tools used by Fortune 500 companies like Procter & Gamble in portfolio management. The advantages are manifold: pinpoint investment opportunities, mitigate risks, and foster sustainable growth. For example, in tech sectors, it can map software products' market positions, guiding shifts from legacy systems to innovative apps.
Essential Features for Strategic Mastery
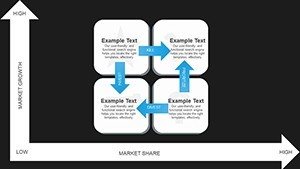
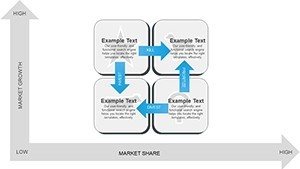
This template's core lies in its data-driven design, where charts update automatically with your inputs, saving precious time during prep. Explore customizable quadrants with adjustable axes for market growth and share, plus color-coded bubbles for intuitive interpretation. Fonts and schemes adapt to your branding, ensuring consistency in investor pitches or internal reviews.
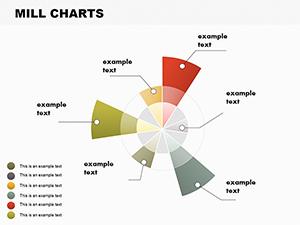
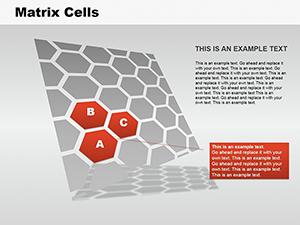
- Dynamic Quadrant Layouts: Pre-built matrices with drag-and-drop placement for products or units.
- Visual Enhancements: Gradient fills and shadows for a professional polish, enhancing readability.
- Integration Capabilities: Pull data from spreadsheets, ideal for real-time scenario planning.
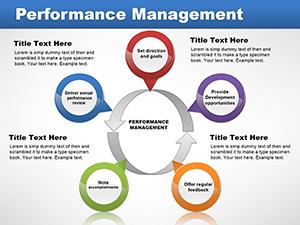
- Annotation Tools: Built-in callouts and legends to explain strategies without overcrowding slides.
These elements align with strategic best practices from experts like Michael Porter, emphasizing competitive analysis. Users often see improved decision speed, as per Harvard Business Review insights on visual aids in strategy sessions.
In-Depth Slide Overview and Editing Guide
The slides progress logically: Introductory overviews define the BCG model, followed by blank templates for custom builds. Slide 10, for instance, includes a multi-product matrix with sample data, where you can swap in your metrics like revenue shares. Advanced slides incorporate trend lines for forecasting, useful in annual planning.
Editing is straightforward - select a bubble, input values, and watch the chart adjust. Tip: Use contrasting colors for quadrants to highlight priorities, and add animations to reveal categories one by one for dramatic effect in presentations.
Practical Use Cases Across Industries
From marketing managers assessing campaign ROIs to educators teaching business fundamentals, this template adapts effortlessly. In consulting, apply it to client audits, as seen in McKinsey case studies where BCG matrices revealed divestment needs. For startups, visualize product roadmaps, balancing high-growth ventures against stable earners.
Consider a retail example: Plot store brands on the matrix to decide expansions or closures, incorporating market data from sources like Nielsen. In education, simplify complex theories for MBA students, fostering discussions on real cases like Apple's product evolution.
Incorporate it into your workflow by starting with data collection in tools like Tableau, then exporting to PowerPoint. Rehearse with notes view to anticipate questions, turning your presentation into a strategic dialogue.
Advanced Tips for Maximum Impact
Elevate further by combining with SWOT analyses on companion slides, creating holistic strategy decks. For trustworthiness, reference industry benchmarks - think integrating Gartner data for tech matrices. This approach has helped firms like Unilever optimize portfolios, per public reports.
Ultimately, our BCG Matrix template is your ally in navigating business complexities. Seize the strategic advantage - download and refine your approach now.
Frequently Asked Questions
What makes this BCG Matrix template unique?
It features auto-updating charts and customizable visuals tailored for professional strategy sessions.
Can I use it for non-business purposes?
Yes, educators and students adapt it for academic analyses and teaching.
How do I input my own data?
Edit directly in the chart placeholders or link to external spreadsheets.
Is it compatible with older PowerPoint versions?
Yes, works from PowerPoint 2010 onward with full functionality.
Are there examples included?
Sample data is provided on several slides to guide your customization.