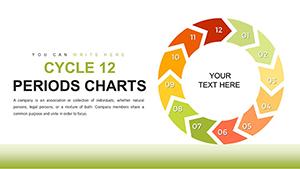
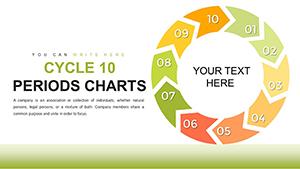
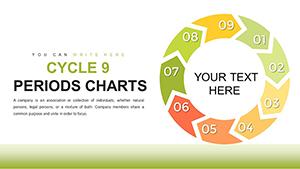
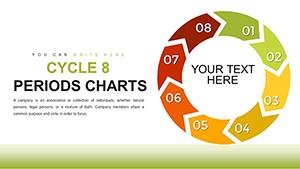
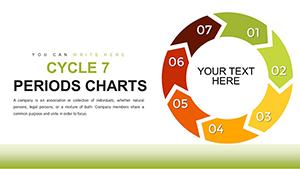
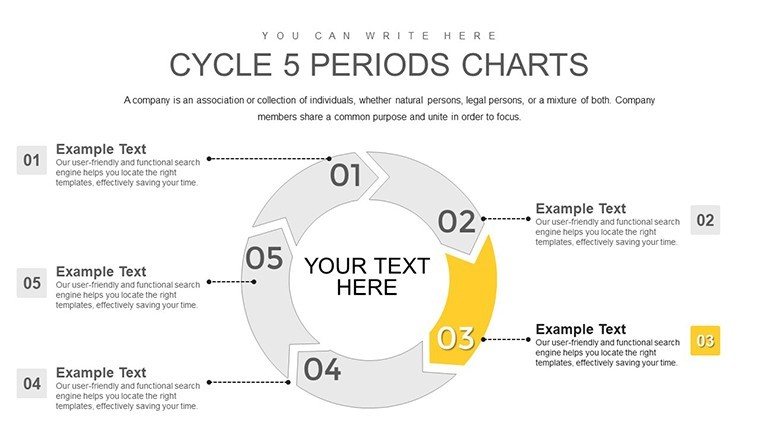
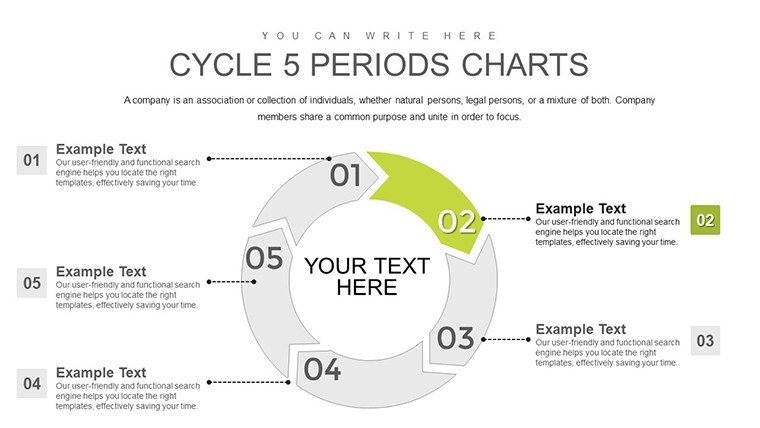
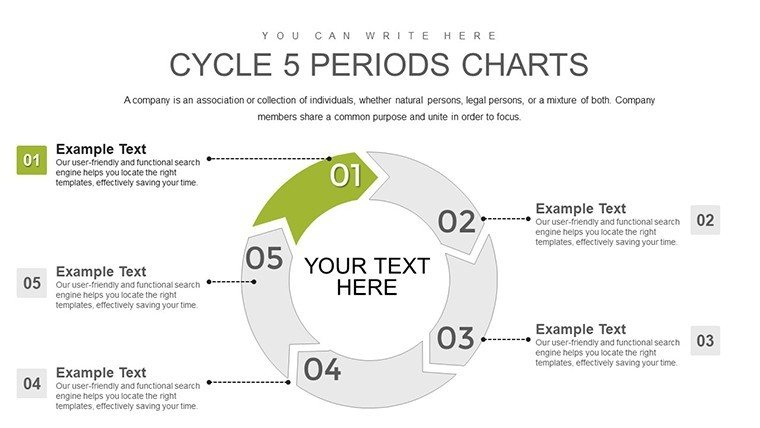
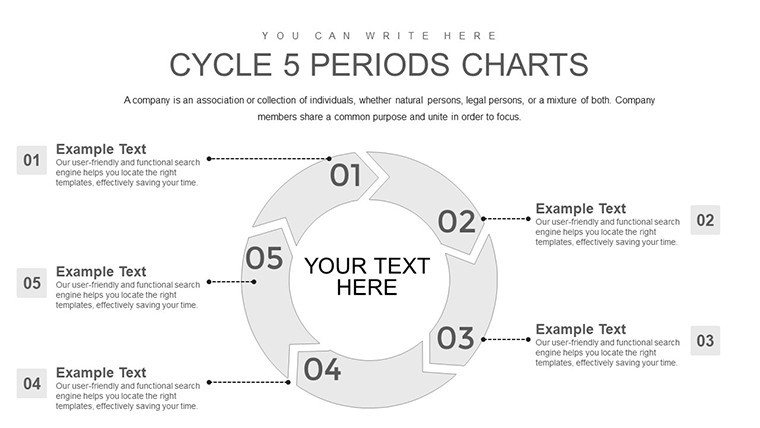
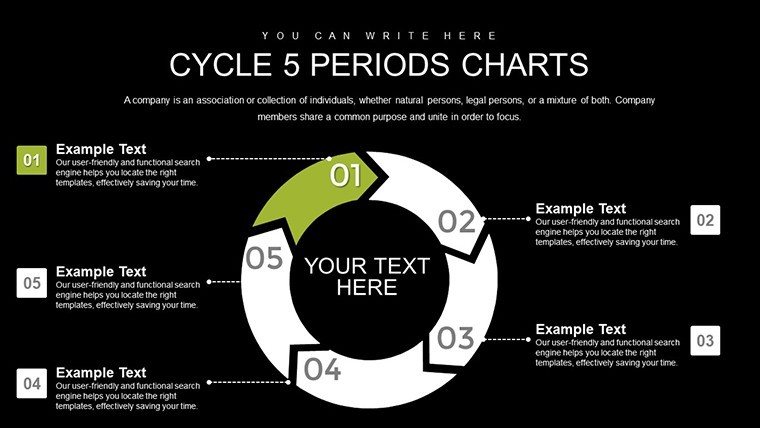
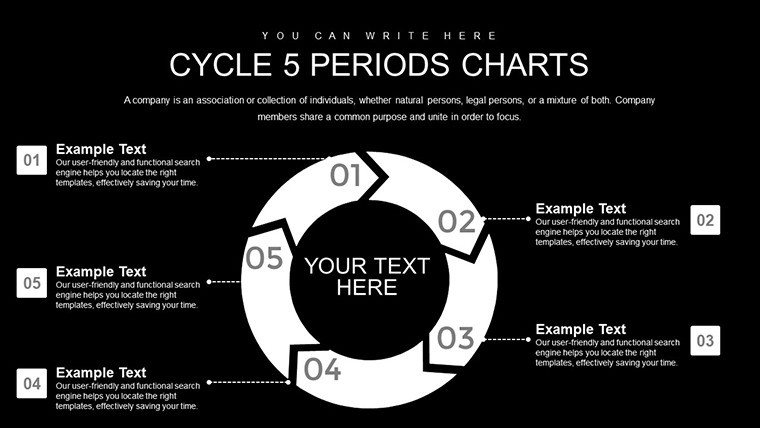
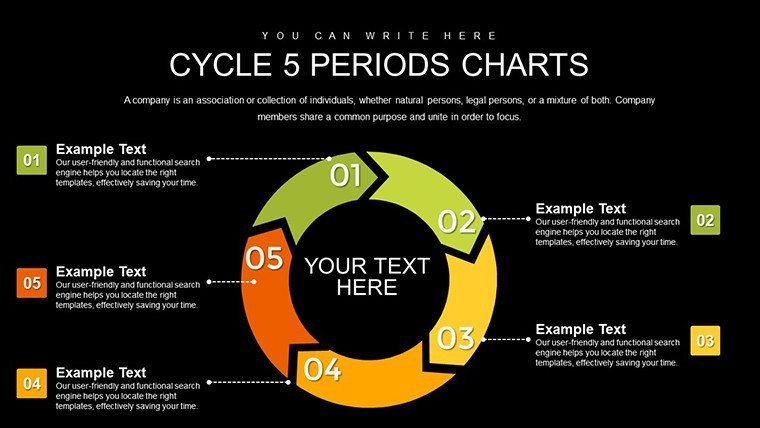
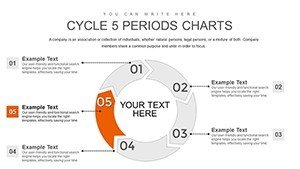
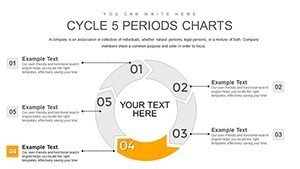
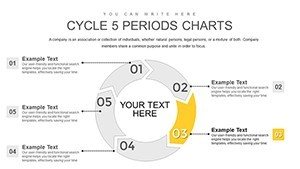
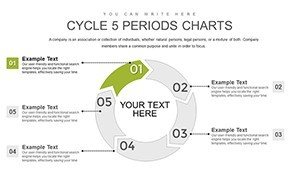
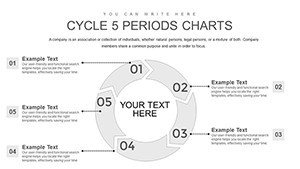
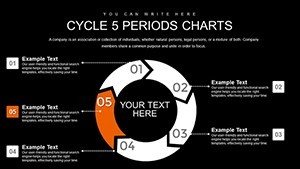
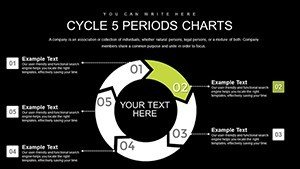
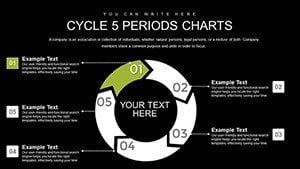
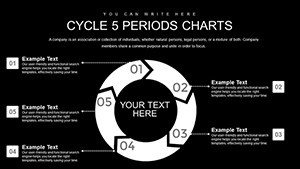
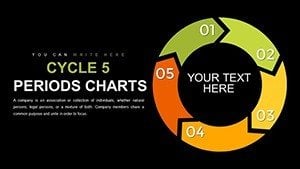
5-Period Architecture Cycle Charts PowerPoint Template


Type: PowerPoint Charts template
Category: Cycle
Sources Available: .pptx
Product ID: PC00768
Template incl.: 16 editable slides
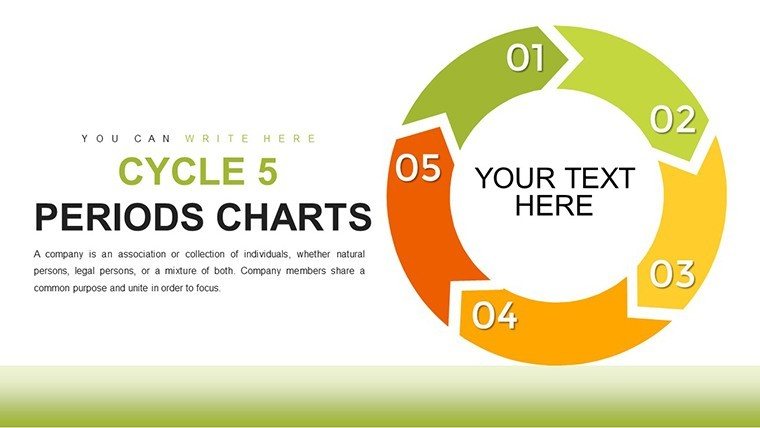
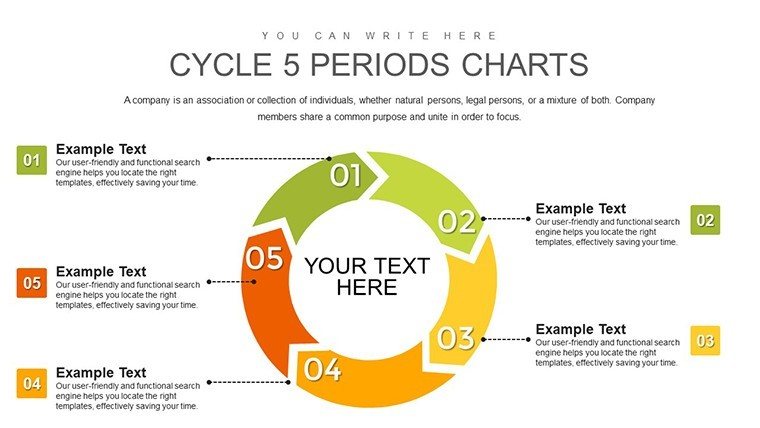
Imagine transforming your architectural presentations from mundane data dumps into captivating narratives that win clients and awards. Our 5-Period Architecture Cycle Charts PowerPoint Template is designed specifically for architects, urban planners, and design professionals who need to illustrate project lifecycles with clarity and flair. With 16 fully editable slides, this template empowers you to showcase the standard five phases of architectural design - schematic design, design development, construction documents, bidding, and construction administration - in a visually engaging cycle format. Whether you're pitching to stakeholders for a sustainable high-rise or presenting a renovation timeline to a community board, these charts help bridge the gap between complex concepts and audience understanding. Drawing from AIA guidelines on project phases, this tool ensures your visuals align with industry standards, boosting your credibility and saving hours of custom design work. Say goodbye to generic bar graphs and hello to dynamic cycles that highlight interdependencies, milestones, and iterative processes in your projects.
Unlock the Power of Visual Storytelling in Architecture
In the fast-paced world of architecture, where every detail counts, presenting your project cycles effectively can make or break a deal. This template's 5-period structure mirrors the core AIA-defined phases, allowing you to map out everything from initial concept sketches to final site inspections. Picture this: You're in a client meeting for a mixed-use development. Instead of flipping through static slides, you reveal a sleek cycle chart that rotates through the five periods, each segment bursting with customizable icons representing site analysis, regulatory approvals, and material selections. The audience leans in, grasping how your design evolves iteratively - much like the award-winning Guggenheim Museum Bilbao, where Frank Gehry's fluid cycles of ideation and refinement led to iconic results. Our template isn't just about aesthetics; it's about efficiency. Fully compatible with PowerPoint and Google Slides, you can tweak colors to match your firm's branding, adjust data points for specific project metrics like budget allocations or timeline adjustments, and integrate real-time updates for collaborative reviews.
Key Features That Set This Template Apart
- Versatile Chart Types: Beyond basic cycles, include hybrid bar-pie-line integrations to show quantitative data like cost breakdowns across periods.
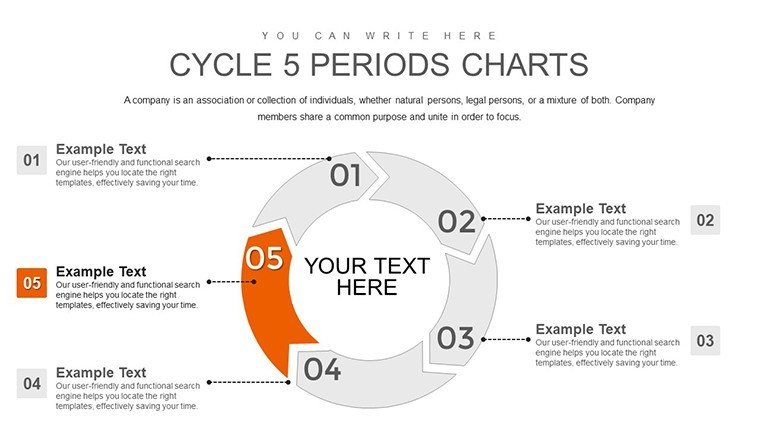
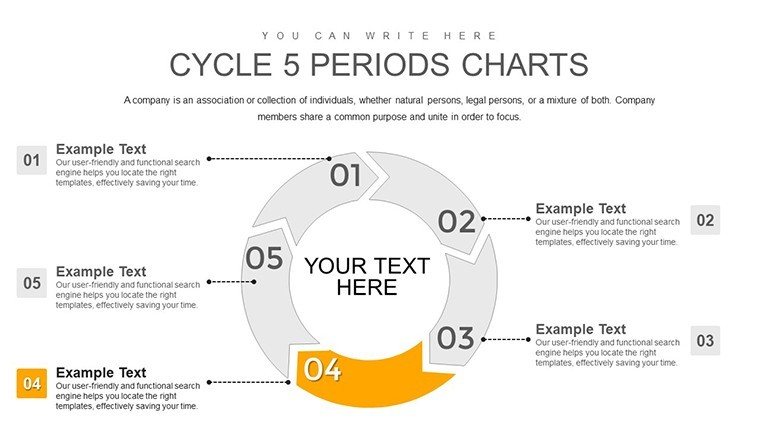
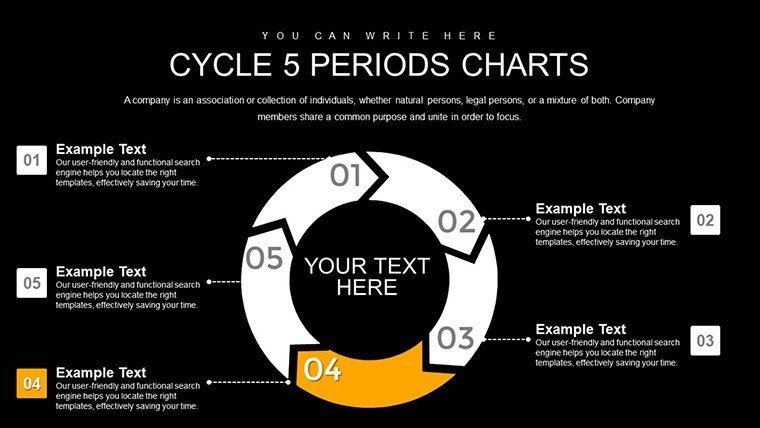
- High Customizability: Edit every element - fonts, shapes, animations - with drag-and-drop ease, ensuring your charts reflect unique project nuances, such as eco-friendly material cycles in LEED-certified builds.
- Professional Modern Design: Clean lines and subtle gradients inspired by contemporary architecture, making your slides look like they came from a top firm like Zaha Hadid Architects.
- 16 Editable Slides: From overview cycles to deep-dive period breakdowns, plus bonus infographics for risk assessments or stakeholder mappings.
- Seamless Integration: Drop into existing decks without reformatting, perfect for appending to proposal documents or RFP responses.
These features address common pain points in architectural presentations, like overwhelming audiences with too much text or failing to convey process flows. By using this template, you'll demonstrate expertise in AIA's basic services, from schematic explorations to construction oversight, positioning your firm as a thought leader.
Real-World Applications in Architectural Projects
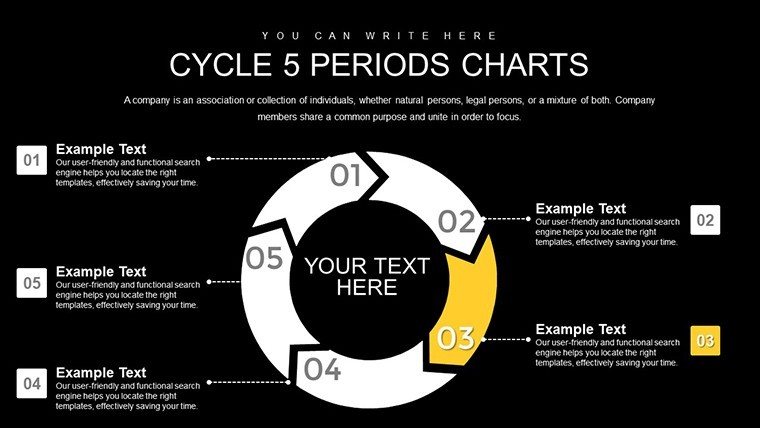
Let's dive into how this 5-period cycle template shines in practice. Consider a urban revitalization project, similar to the High Line in New York, where phases cycle through community input, design iterations, permitting, construction, and post-occupancy evaluations. Start with Slide 1: An overarching cycle diagram labeling each period with key deliverables - site surveys in Period 1, 3D renderings in Period 2. Then, use subsequent slides for zoomed-in views: Period 3's construction documents could feature embedded Gantt-like sub-charts for subcontractor timelines. For educational purposes, architects teaching at institutions like Harvard's GSD can adapt these for lectures on design methodologies, illustrating how cycles accommodate feedback loops essential in adaptive reuse projects. In corporate settings, integrate data from tools like Revit or AutoCAD, populating charts with metrics on energy efficiency cycles, ensuring compliance with standards like those from the International Building Code. This template also excels in client workshops, where you can animate transitions between periods to simulate project progression, fostering buy-in and reducing revision cycles.
Step-by-Step Guide to Customizing Your Cycles
- Import and Setup: Open in PowerPoint, select your brand palette, and import project data via Excel links for auto-updates.
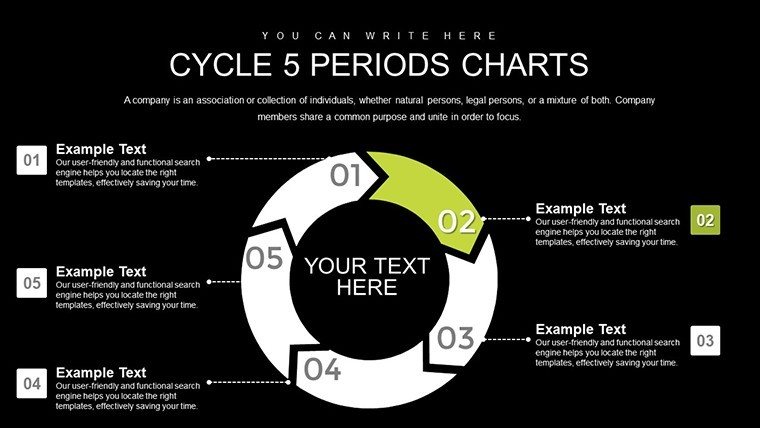
- Map Phases: Assign AIA phases to the five periods - e.g., Schematic Design as Period 1 with brainstorming icons.
- Add Data Layers: Overlay metrics like cost per phase or sustainability scores, using pie segments within cycles for multi-dimensional views.
- Enhance with Visuals: Insert project-specific images, such as blueprints or renderings, with alt texts for accessibility.
- Animate and Present: Apply subtle rotations to emphasize cyclical nature, then rehearse for smooth delivery.
This workflow not only streamlines preparation but also enhances collaboration. Share editable versions with team members for input on period transitions, mimicking real iterative design processes seen in firms like Foster + Partners.
Why This Template Outperforms Basic PowerPoint Tools
Standard PowerPoint charts often fall flat in conveying the non-linear aspects of architecture projects, where phases overlap or loop back. Our template's advanced cycle designs handle this elegantly, with connectors showing dependencies - like how design development feeds back into schematics for refinements. Compared to free alternatives, it offers premium elements: themed icons for architectural elements (beams, blueprints), gradient fills evoking building facades, and data-driven animations that respond to input changes. For instance, in a case study inspired by the Sydney Opera House's prolonged cycles, you can illustrate how extended periods led to innovative solutions, using the template to quantify delays versus outcomes. This level of detail builds trust, as clients see your command over project dynamics, aligning with AIA's emphasis on quality management in each phase.
Expert Tips for Maximum Impact
To elevate your use, pair cycles with storytelling: Narrate a project's "journey" through the five periods, highlighting triumphs like overcoming zoning hurdles in Period 4. Incorporate LSI elements naturally - think "architectural workflow diagrams" or "phase-based data visualization" - to optimize for search without stuffing. For virtual presentations, leverage hyperlinks within cycles to jump to detailed appendices, keeping main flows concise. Finally, test with peers: Run mock pitches to refine pacing, ensuring your cycles captivate without confusing.
Ready to revolutionize your architectural storytelling? Download this 5-period cycle template today and turn every presentation into a masterpiece that secures projects and inspires teams.
Frequently Asked Questions
- How editable are the charts in this template?
- Every element is 100% editable, from colors and texts to shapes and data inputs, allowing full customization to your project needs.
- Is this compatible with Google Slides?
- Yes, upload directly to Google Slides for seamless editing and collaboration, though some advanced animations may need adjustments.
- Can I use this for non-architecture fields?
- Absolutely, while optimized for architecture, it's versatile for any cyclical process like business strategies or educational modules.
- What file formats are included?
- The download includes .pptx files, plus tips for exporting to PDF or images for broader sharing.
- How does this align with AIA standards?
- It maps directly to AIA's five basic phases, ensuring your presentations reflect professional best practices.