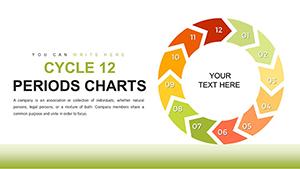
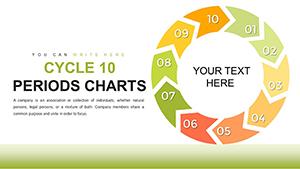
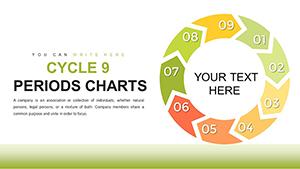
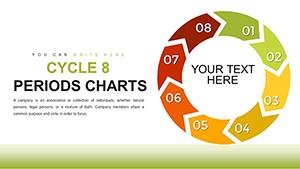
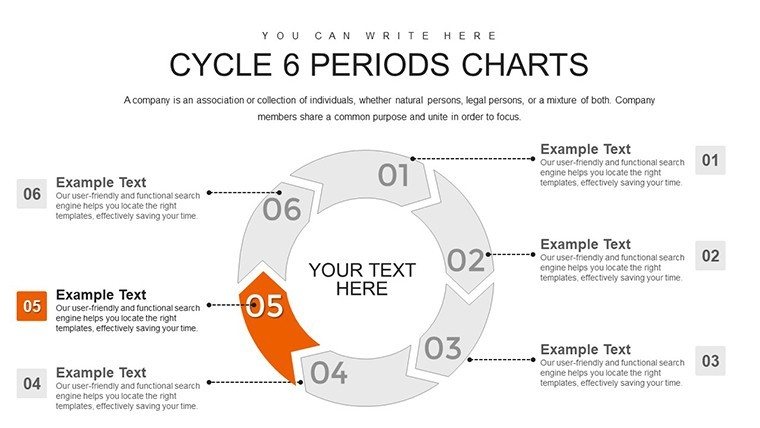
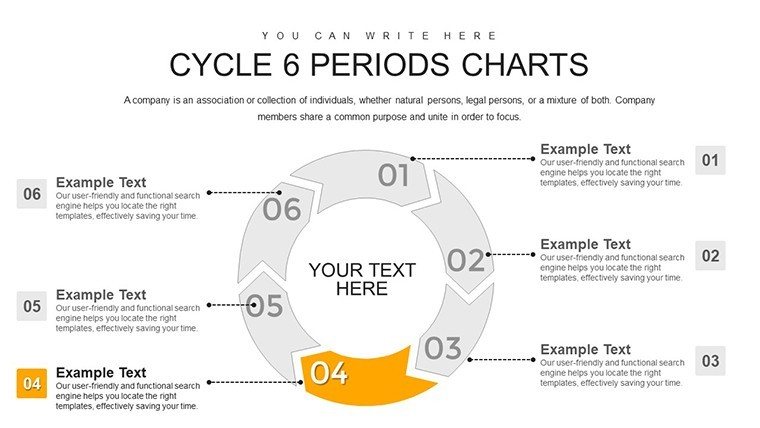
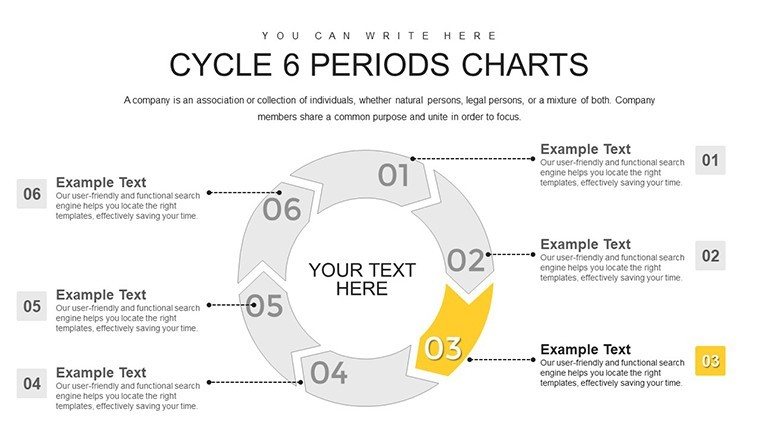
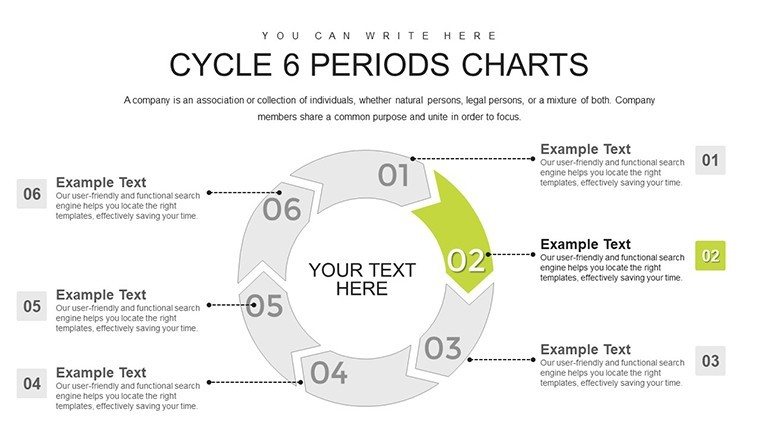
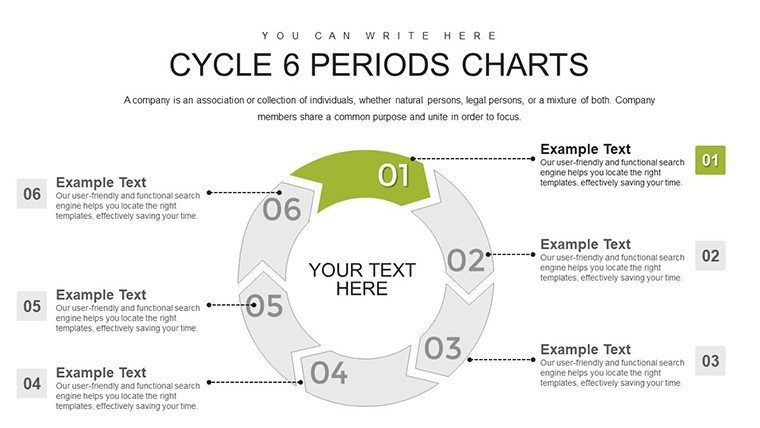
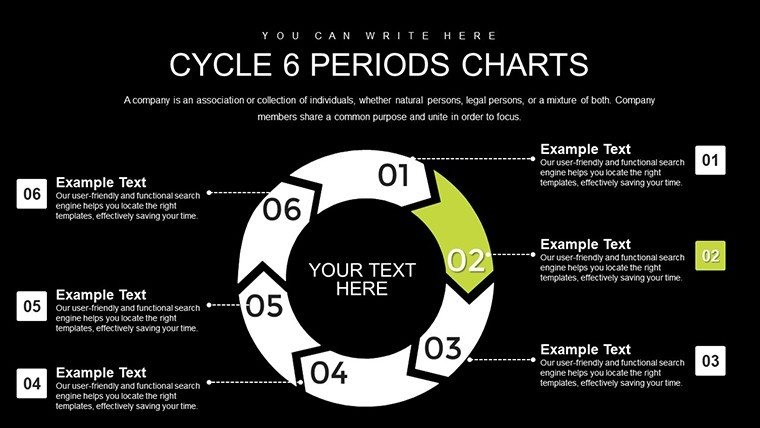
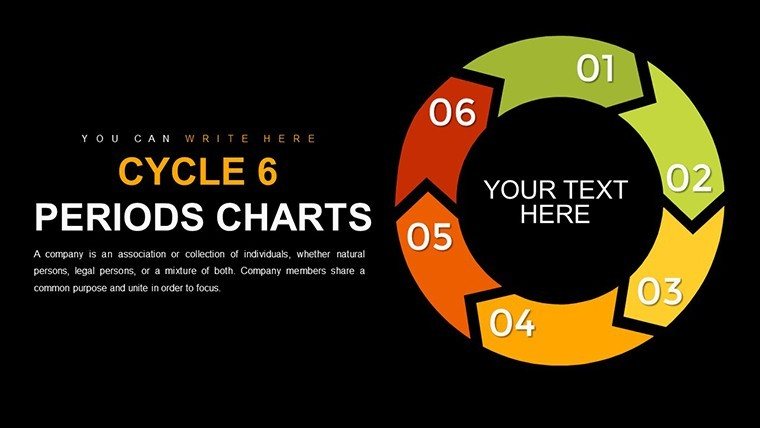
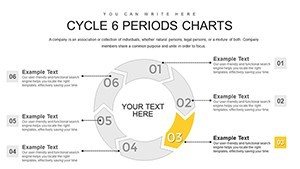
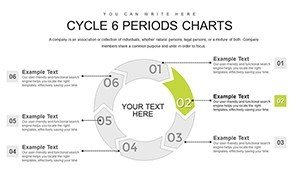
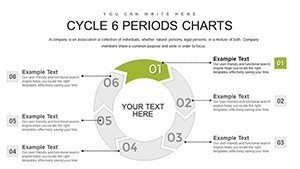
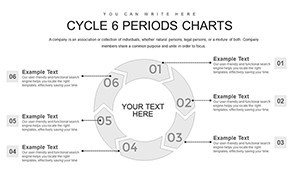
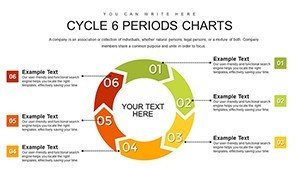
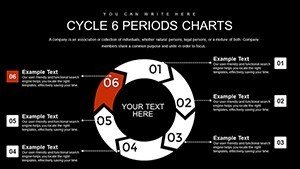
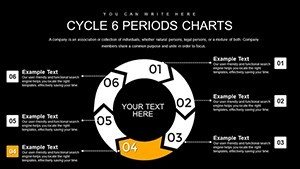
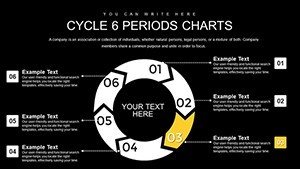
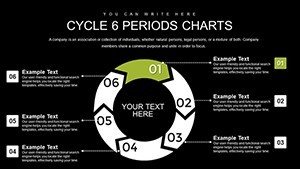
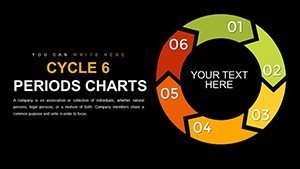
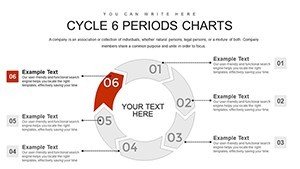
6-Period Architectural Design Cycle PowerPoint Charts


Type: PowerPoint Charts template
Category: Cycle
Sources Available: .pptx
Product ID: PC00767
Template incl.: 18 editable slides
Dive into the intricate world of architectural design where every phase tells a story of innovation and precision. Our 6-Period Architectural Design Cycle PowerPoint Charts template is crafted for visionary architects, project managers, and educators who demand more than standard visuals. Featuring 18 editable slides, it expands on AIA's foundational phases by incorporating pre-design, allowing a comprehensive view from initial programming to construction administration. Ideal for complex projects like adaptive reuse or large-scale urban developments, this template turns abstract cycles into tangible, persuasive narratives. Envision presenting a waterfront redevelopment: Your cycle chart fluidly connects site analysis in Period 1 with sustainability integrations in Period 6, captivating stakeholders with data-backed insights. Aligned with real-world practices from firms like SOM, it enhances your ability to communicate iterative processes, reducing misunderstandings and accelerating approvals.
Elevate Your Design Narratives with Precision
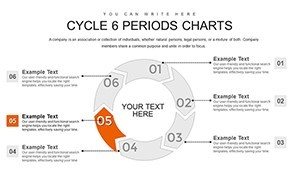
Architecture thrives on cycles - feedback loops that refine ideas into built realities. This template's 6-period format accommodates extended workflows, such as those in international projects requiring cultural assessments. Begin with an engaging overview slide showing the full cycle, then drill down into specifics: Period 2 for schematic explorations with embedded mood boards, Period 4 for detailed construction docs with cost projections. Unlike basic tools, these charts support layered data visualization, blending qualitative elements like client feedback with quantitative metrics like square footage allocations. For instance, in a project akin to the Shard in London, use the template to depict how design development cycles back to schematics for height adjustments, illustrating resilience in face of regulatory challenges.
Standout Features for Architectural Excellence
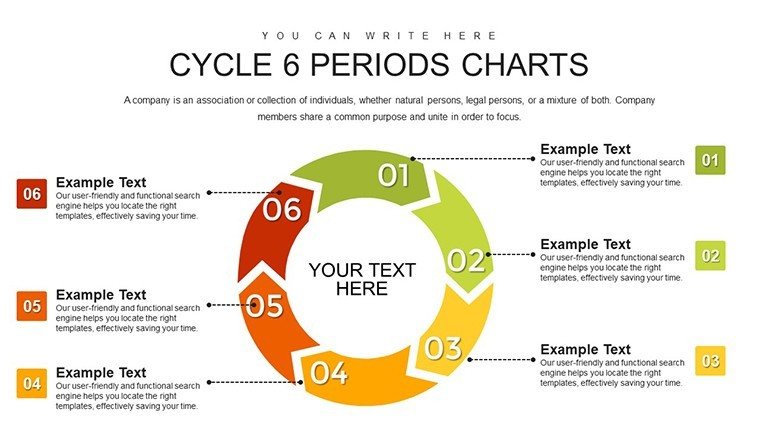
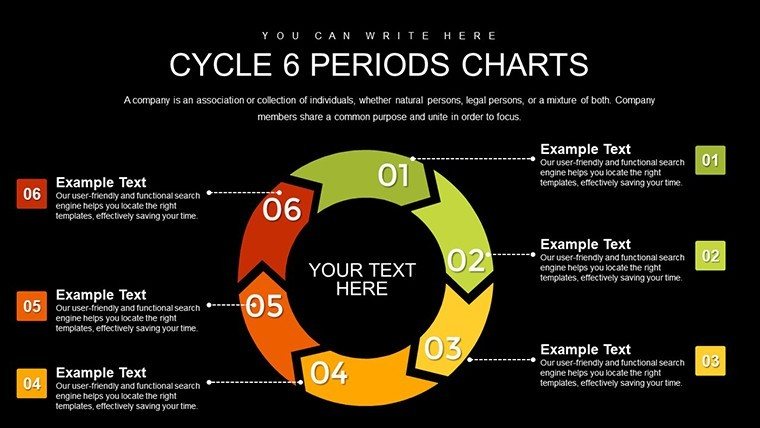
- Stunning Visuals: High-res cycle diagrams with gradient effects mimicking architectural renderings.
- Full Customization: Adjust every aspect to fit project themes, from modernist minimalism to organic forms.
- Data Integration: Link to external sources for live updates on phase progressions.
- 18 Versatile Slides: Including variants for horizontal/vertical layouts and animated transitions.
- Broad Compatibility: Works flawlessly in PowerPoint and Google Slides for team collaborations.
These elements solve key challenges, like conveying phase interlinks in multidisciplinary teams, and align with AIA's quality management protocols for schematic and beyond.
Practical Use Cases in Modern Architecture
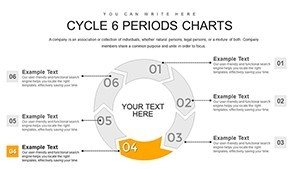
Apply this template to diverse scenarios: In educational settings, dissect the cycles of iconic structures like the Burj Khalifa, showing how 6 periods encompass wind testing and facade iterations. For firm pitches, customize for green building certifications, cycling through LEED criteria from pre-design audits to post-occupancy reviews. Step-by-step: Slide 5 might focus on Period 3's design development, with sub-charts for material selections; animate to reveal cost impacts. In client consultations, use it to map out renovation cycles for historic sites, ensuring preservation standards are visualized clearly. This approach not only informs but inspires, much like presentations at AIA conferences where cycle charts demystify complex deliveries.
Customization Workflow for Seamless Integration
- Setup Basics: Import your firm's template, align colors with project palettes.
- Phase Assignment: Label periods per AIA extensions - pre-design as 1, admin as 6.
- Layer Data: Add metrics like timeline variances or budget cycles.
- Visual Enhancements: Embed 3D model snapshots or VR links within periods.
- Refine and Share: Test animations, export for virtual reality integrations.
This method fosters collaborative design, echoing real-world iterations in projects by architects like Renzo Piano.
Superior to Standard Charting Options
Basic PowerPoint lacks the depth for architectural nuances; our template bridges this with dynamic connectors and feedback arrows, perfect for illustrating agile methodologies in design. Compare to a case study of the Apple Park campus, where extended cycles managed ecosystem integrations - use our charts to quantify such complexities. Premium touches include icon libraries for architectural symbols, ensuring trustworthiness in RFP submissions.
Pro Tips to Amplify Your Presentations
Weave in humor lightly: "Cycles aren't just for bikes - they're how great buildings rise!" Focus on user pain points, like phase overlaps, with tips on using shadows for emphasis. Optimize with LSI terms like "architectural phase diagrams" for natural flow.
Transform your architectural visions into reality - grab this 6-period template now and lead with confidence.
Frequently Asked Questions
- What makes the 6-period structure unique?
- It includes pre-design for thorough planning, extending AIA's standard five phases.
- Can I add animations to the cycles?
- Yes, built-in options allow rotational effects to simulate process flows dynamically.
- Is it suitable for team collaborations?
- Perfectly, with easy sharing in cloud-based tools like Google Slides.
- How do I handle data-heavy projects?
- Integrate Excel links for automatic updates across periods.
- Does it support international standards?
- Yes, adaptable to global codes beyond AIA, like RIBA phases.