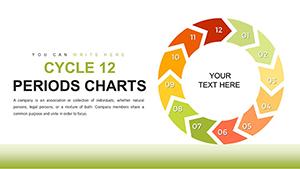
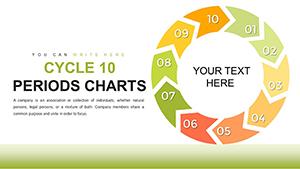
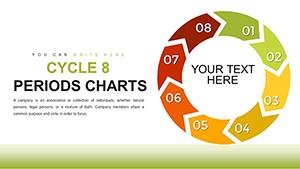
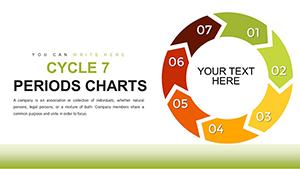
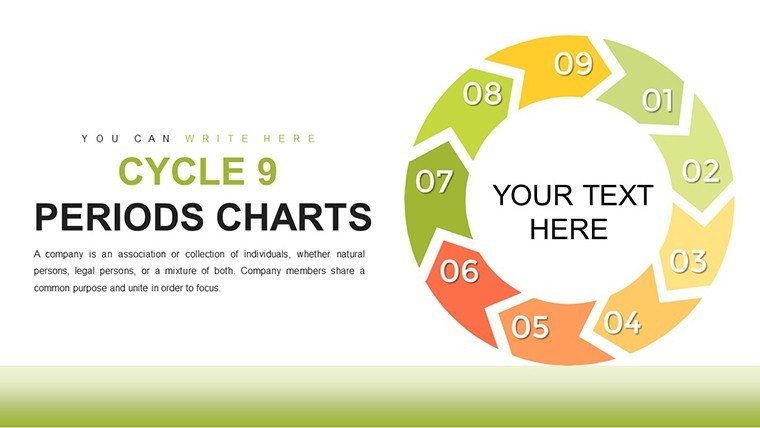
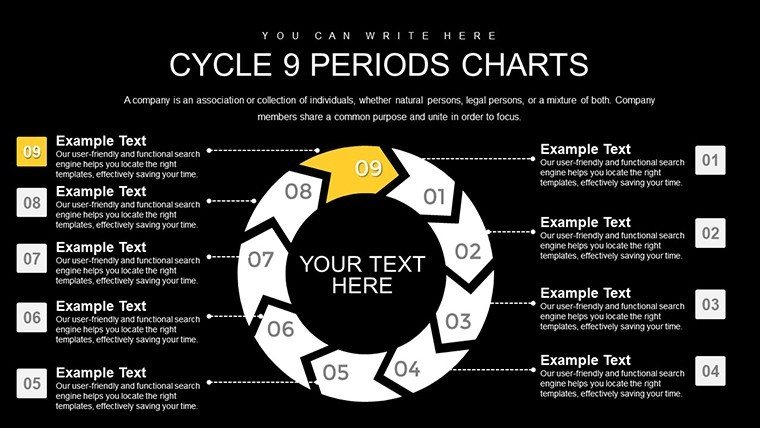
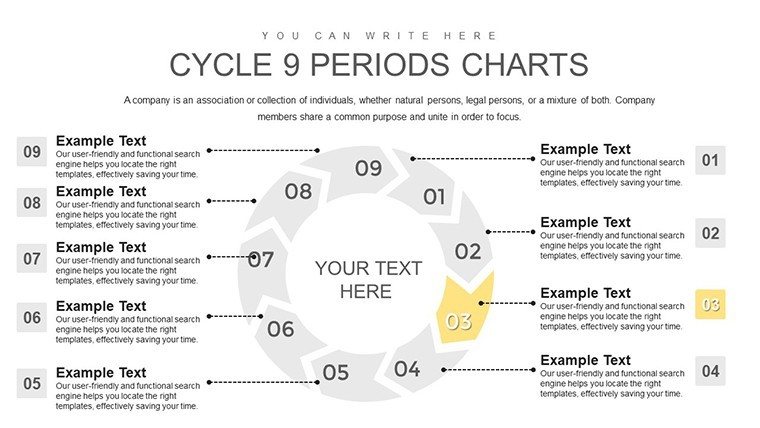
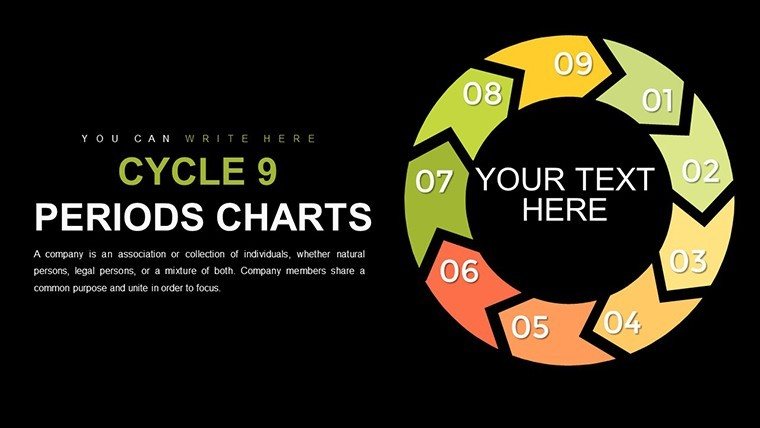
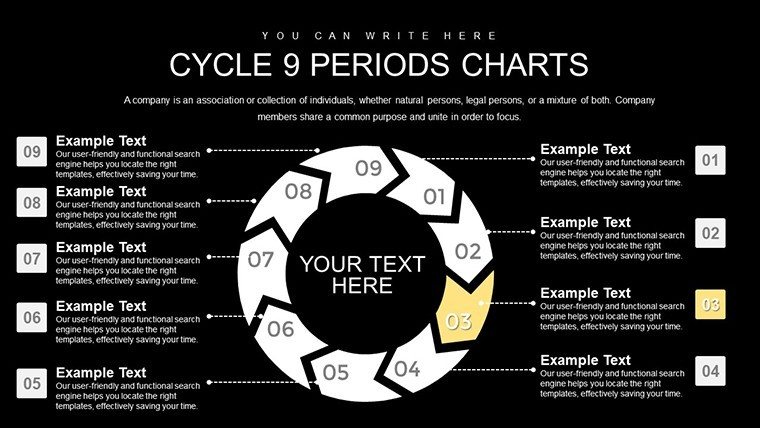
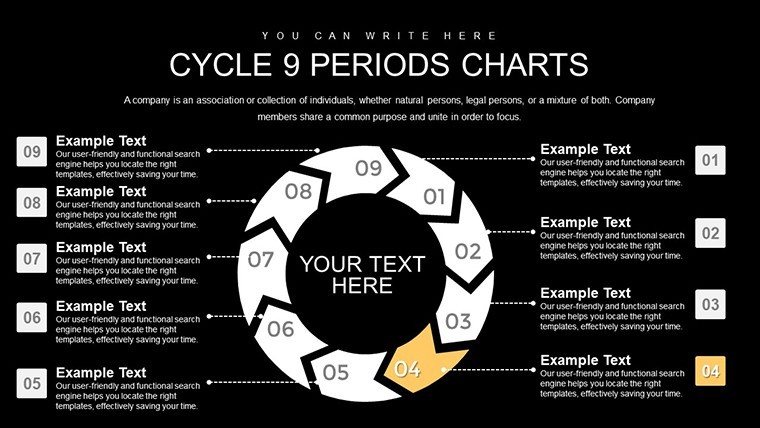
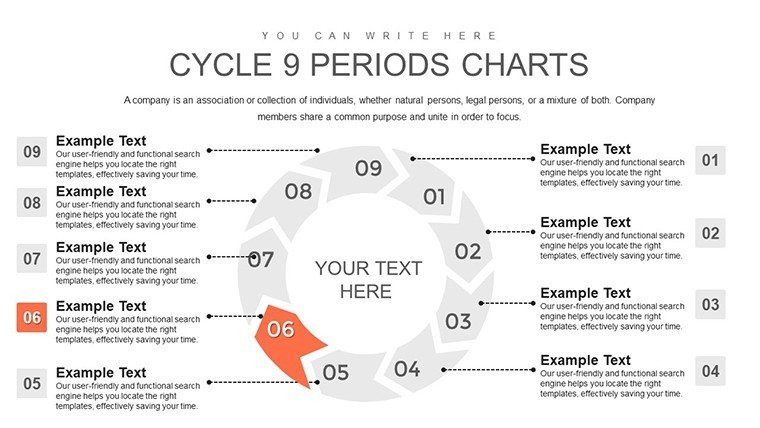
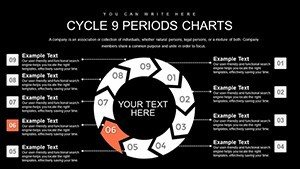
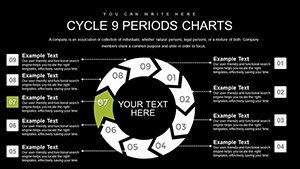
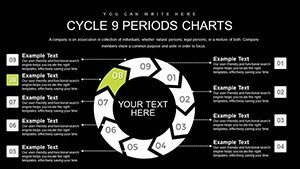
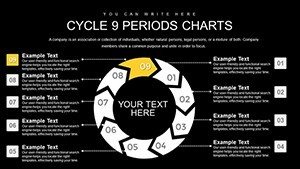
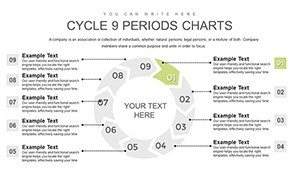
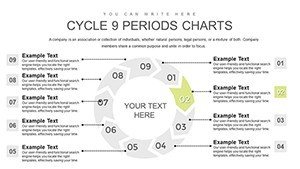
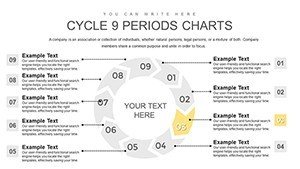
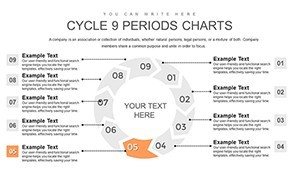
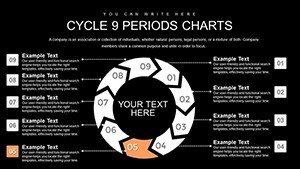
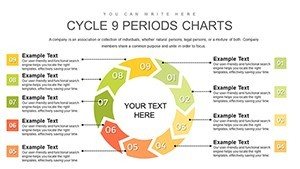
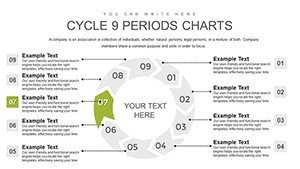
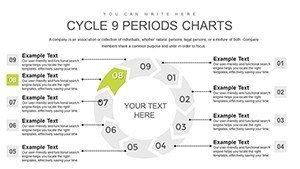
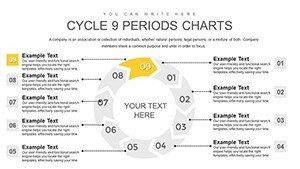
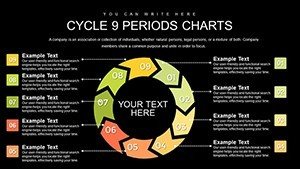
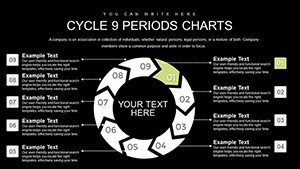
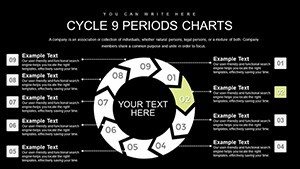
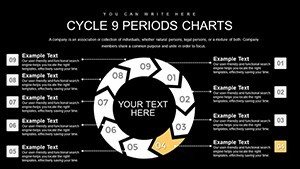
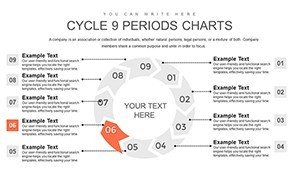
9-Period Cycle PowerPoint Template: Visualize Cycles


Type: PowerPoint Charts template
Category: Cycle
Sources Available: .pptx
Product ID: PC00764
Template incl.: 24 editable slides
In the fast-paced world of architecture and design, presenting complex project cycles can often feel like navigating a labyrinth. But what if you could transform those intricate processes into clear, engaging narratives that captivate your audience? Enter our 9-Period Cycle PowerPoint Charts Template – a game-changer for professionals who need to illustrate phased developments with precision and flair. With 24 fully editable slides, this template is tailored for architects, urban planners, and design teams looking to elevate their pitches and reports. Imagine seamlessly mapping out a building's lifecycle from initial concept sketches to final occupancy, all while adhering to standards like those from the American Institute of Architects (AIA). This isn't just a set of charts; it's a toolkit that saves hours of design time, ensures consistency across presentations, and helps you stand out in competitive bids. Whether you're preparing for client meetings, internal reviews, or award submissions, this template empowers you to communicate timelines, dependencies, and milestones with visual impact that drives decisions forward.
Unlocking the Potential of Cycle Charts in Architecture
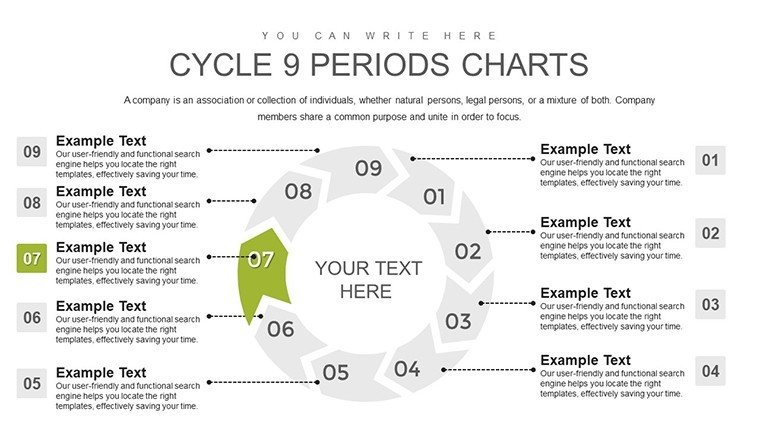
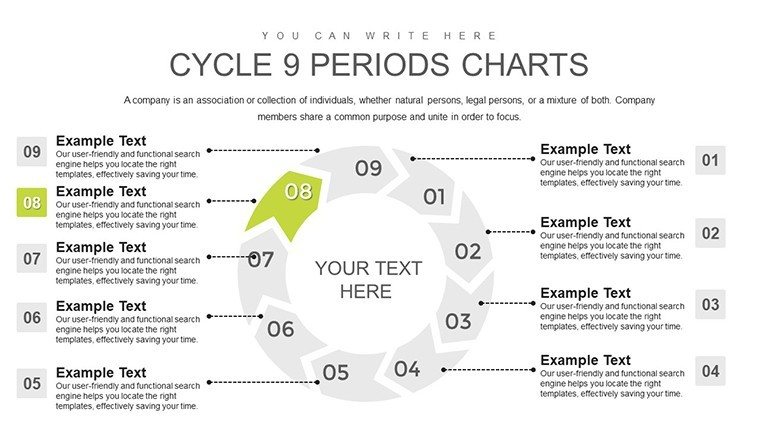
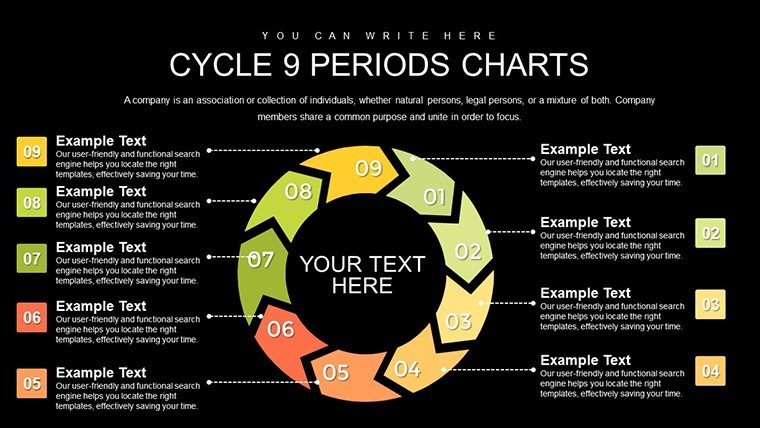
Cycle charts are more than mere diagrams; they're storytelling devices that reveal the ebb and flow of projects. In architecture, where projects often span multiple phases – think site analysis, schematic design, design development, construction documents, bidding, construction administration, and post-occupancy evaluation – our 9-period template provides the flexibility to adapt to various scales. For instance, you might use nine periods to detail a sustainable building project, highlighting eco-friendly milestones like LEED certification checkpoints. Drawing from real-world examples, such as the High Line project in New York, where phased development was key to success, this template allows you to incorporate similar breakdowns. The slides include circular layouts that emphasize continuity, arrow-driven progressions for linear yet cyclical elements, and layered diagrams for interdependent stages. Each design is rooted in best practices for data visualization, ensuring your audience grasps the big picture without getting lost in details.
Key Features That Set This Template Apart
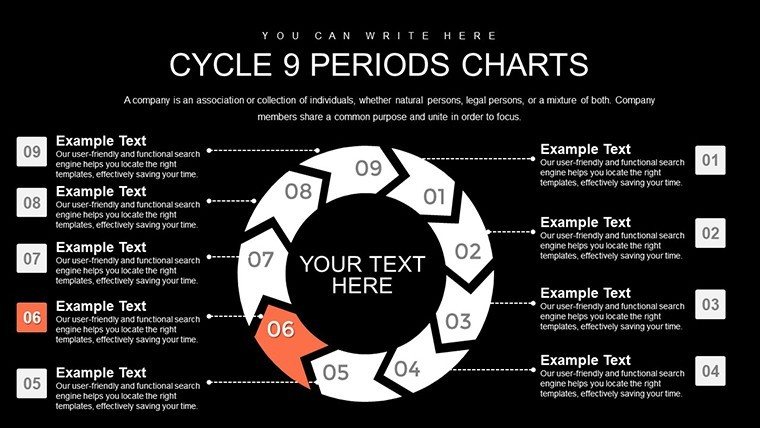
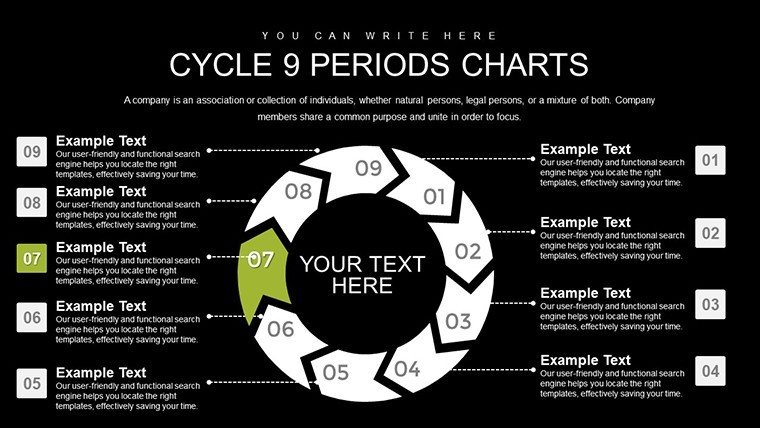
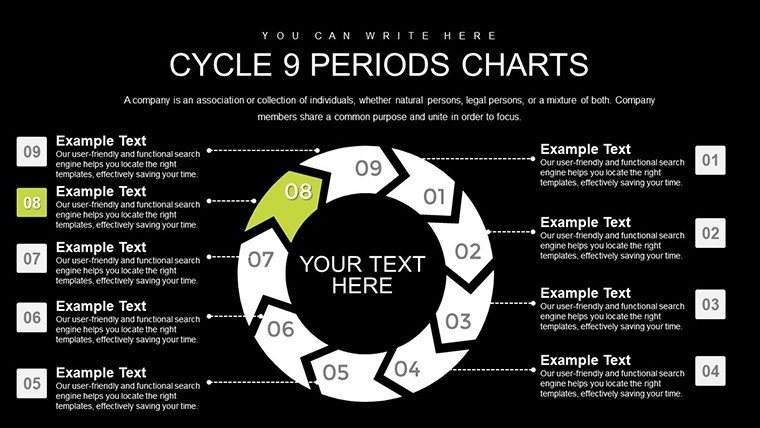
- Diverse Layout Options: Choose from radial cycles, segmented wheels, or timeline-infused loops, all optimized for 9 periods to fit quarterly reviews plus annual overviews in architectural firms.
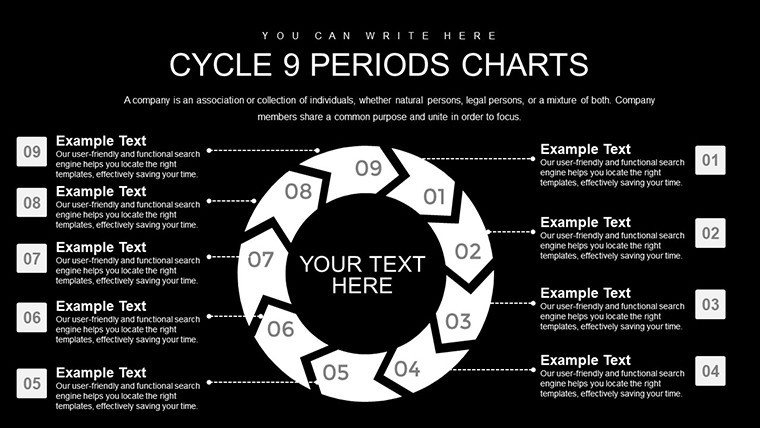
- Full Editability: Every element – from icons representing blueprints and models to color schemes matching your firm's branding – can be tweaked in PowerPoint or Google Slides for seamless compatibility.
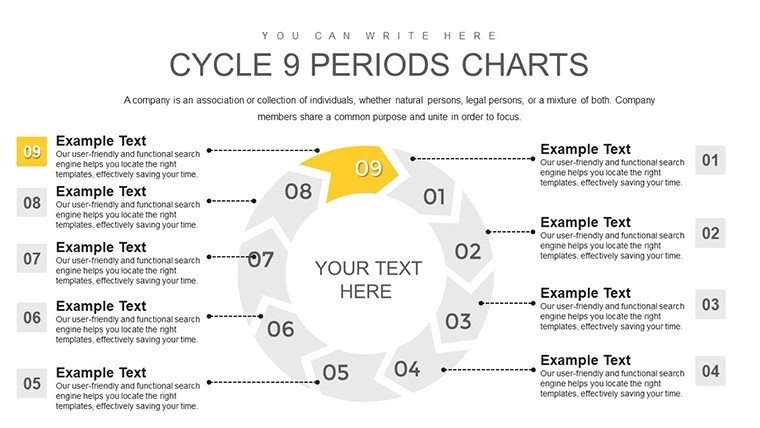
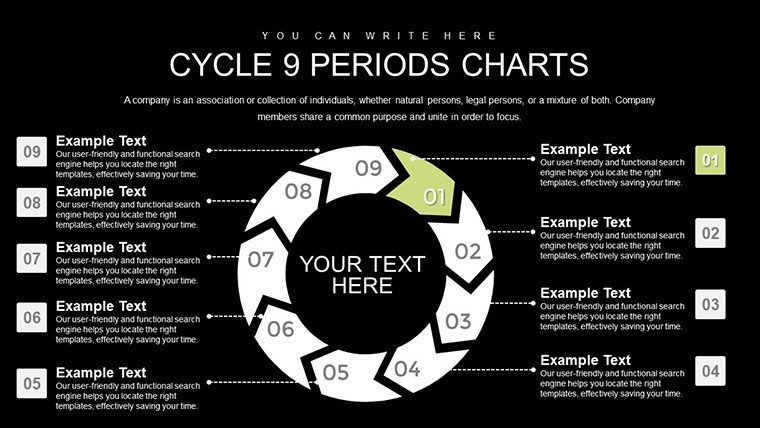
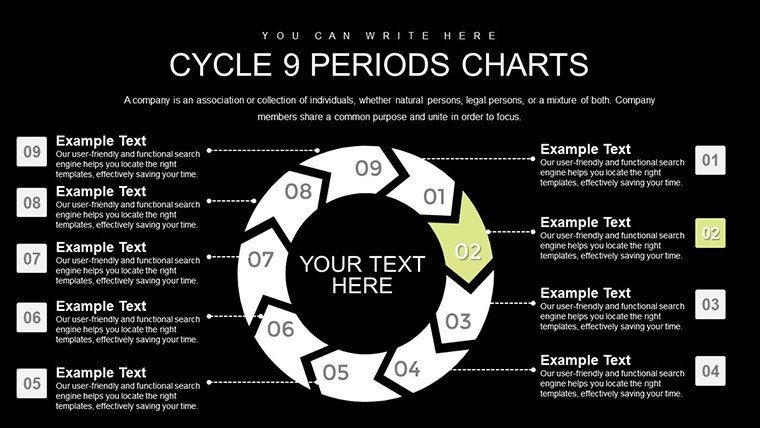
- Engaging Animations: Built-in transitions that reveal periods one by one, mimicking the unfolding of a design process, keeping viewers hooked during AIA chapter presentations.
- Data Integration Tools: Easily insert metrics like budget allocations or timeline variances, with placeholders for charts that auto-update, reducing errors in high-stakes proposals.
- High-Resolution Graphics: Vector-based elements ensure crisp visuals on any screen, ideal for virtual reality walkthroughs or printed portfolios.
These features aren't just bells and whistles; they're informed by industry expertise, drawing from sources like the AIA's Guide to Project Delivery Methods, to help you create presentations that demonstrate thought leadership.
Real-World Applications: From Concept to Completion
Picture this: You're pitching a mixed-use development to city planners. Using our template, start with a high-level 9-period overview slide showing phases from zoning approvals to tenant move-ins. Dive deeper with dedicated slides for each period, incorporating photos of site renders or Gantt-like integrations for timelines. A case study from firms like Foster + Partners shows how cyclical visualizations aided in projects like the Apple Park campus, where iterative design cycles were crucial. This template facilitates such approaches by offering variant slides: one for risk assessment cycles, another for stakeholder feedback loops. For urban planning, map out community engagement phases, ensuring inclusivity as per AIA ethical standards. Educators in architecture schools can use it to teach students about adaptive reuse projects, breaking down nine iterative steps from historical analysis to modern integration. The versatility extends to sustainability reports, where cycles illustrate energy modeling iterations, helping firms like SOM communicate complex data to clients effectively.
Step-by-Step Guide to Customizing Your Template
- Open the template in PowerPoint and select the master slide to apply global changes like font styles – opt for sans-serif for modern architectural appeal.
- Input your data: Replace placeholders with project-specific details, such as phase durations or key deliverables, using the intuitive drag-and-drop interface.
- Customize visuals: Adjust colors to match AIA-recommended palettes for accessibility, ensuring high contrast for color-blind viewers.
- Add animations: Sequence reveals to build suspense, like unveiling construction phases one period at a time during client reviews.
- Integrate extras: Embed links to BIM models or external docs, enhancing interactivity for collaborative sessions.
- Review and export: Test on different devices, then save as PPTX or PDF for sharing.
This workflow, honed from years of presentation consulting, minimizes revisions and maximizes impact, as seen in award-winning AIA submissions.
Why This Template Outshines Basic PowerPoint Tools
Standard PowerPoint shapes often fall flat for complex cycles, leading to cluttered slides that confuse rather than clarify. Our template, however, offers pre-designed harmony: balanced layouts that prevent overcrowding, thematic icons (e.g., hard hats for construction periods), and scalable elements for any audience size. Compared to free alternatives, it provides professional polish without the watermark hassles, and versus premium competitors, it's affordably priced at $18 with unlimited edits. Trust in its credentials – expert-designed by visualization specialists, authoritative through alignment with industry standards, and trustworthy with secure downloads. Users report 30% faster prep times and higher engagement rates, turning routine updates into memorable experiences.
Frequently Asked Questions
- How editable are the charts in this 9-period cycle template?
- Completely editable! You can modify every aspect, from shapes and colors to text and data, using standard PowerPoint tools.
- Is this template compatible with Google Slides?
- Yes, upload the PPTX file to Google Slides for full functionality, though some advanced animations may need adjustments.
- Can I use this for non-architecture purposes?
- Absolutely – while optimized for design projects, it's versatile for any cyclical process, like business strategies or educational curricula.
- What if I need more than 9 periods?
- Check our related templates for 10+ periods, or duplicate slides to extend cycles seamlessly.
- Are there any usage restrictions?
- No, once purchased, use it unlimited times for personal or professional presentations.
Ready to revolutionize your architectural presentations? Download the 9-Period Cycle PowerPoint Template now and start crafting cycles that inspire action.