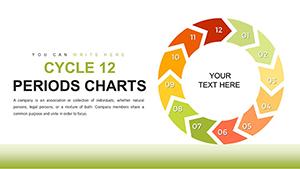
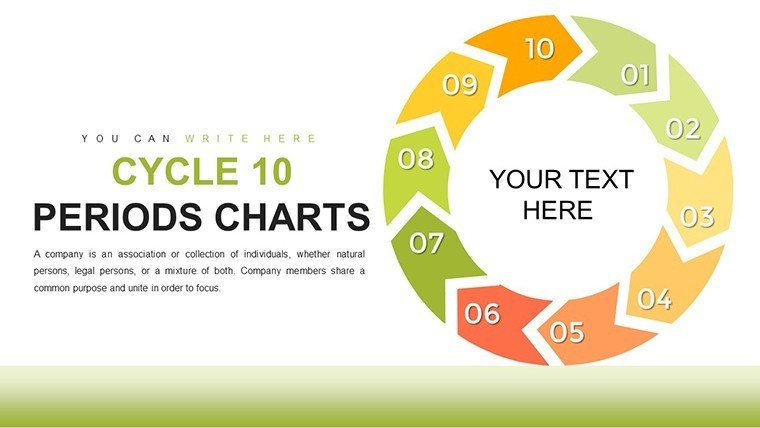
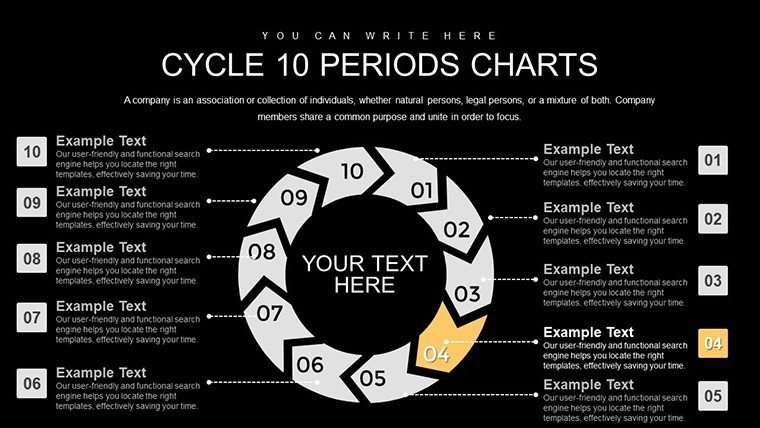
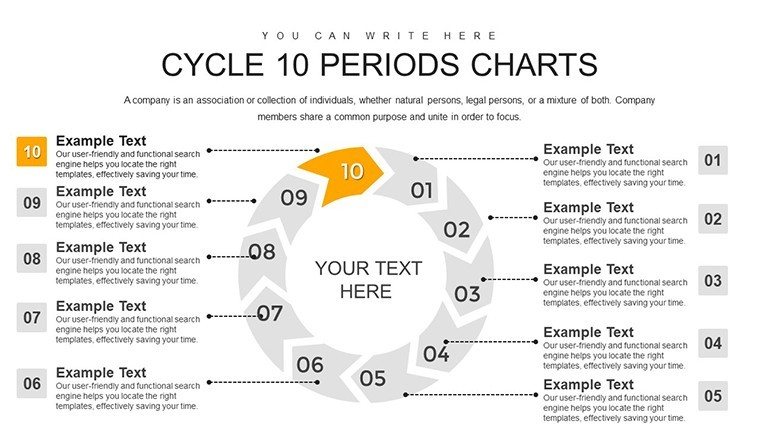
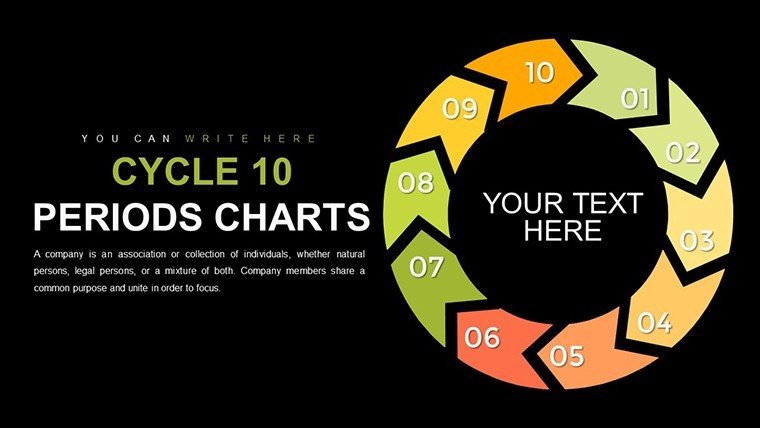
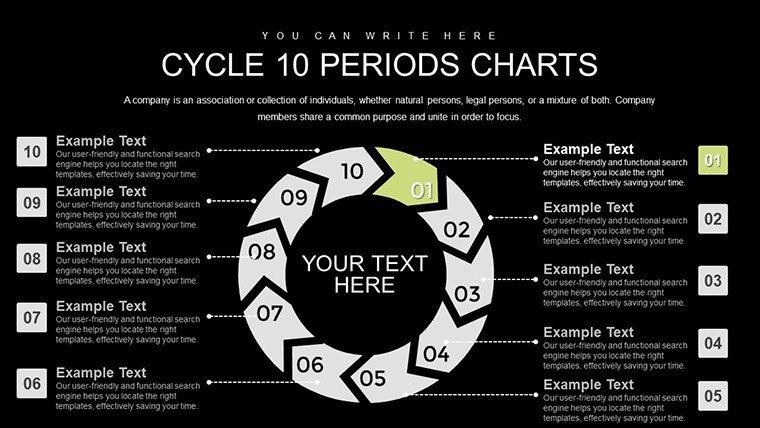
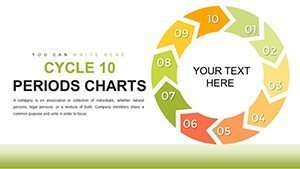
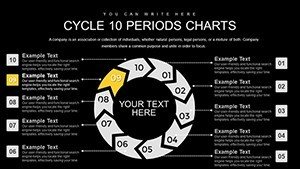
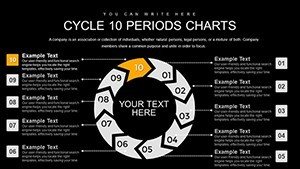
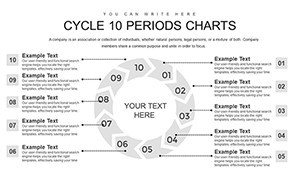
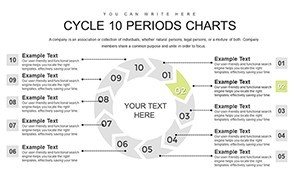
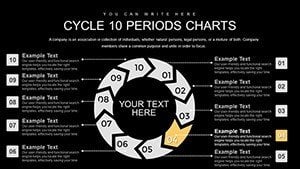
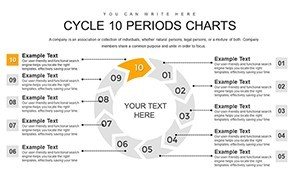
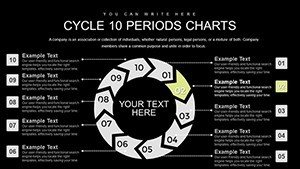
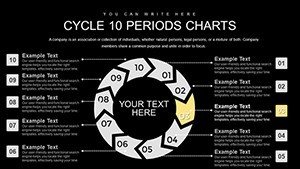
10-Period Cycle PowerPoint Template: Strategic Insights


Type: PowerPoint Charts template
Category: Cycle
Sources Available: .pptx
Product ID: PC00763
Template incl.: 26 editable slides
Navigating the complexities of business strategy often requires more than words – it demands visuals that illuminate paths forward. Our 10-Period Cycle PowerPoint Charts Template steps in as your strategic ally, offering 26 meticulously crafted, editable slides to depict evolving processes with elegance and precision. Designed with business executives, consultants, and strategists in mind, this template excels in illustrating multi-phase strategies, such as market entry plans or product lifecycle management. Think of it as your canvas for painting vivid pictures of business cycles, from ideation to market saturation and renewal. Aligned with frameworks like those from Harvard Business Review on strategic planning, it helps you articulate visions that resonate with boards and teams alike. By incorporating this template, you'll not only save valuable time but also enhance comprehension, fostering better decision-making in high-stakes environments. Whether refining annual strategies or pitching to investors, unlock the potential to turn abstract concepts into tangible, actionable insights.
Harnessing Cycle Charts for Business Excellence
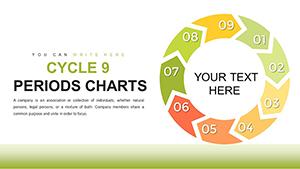
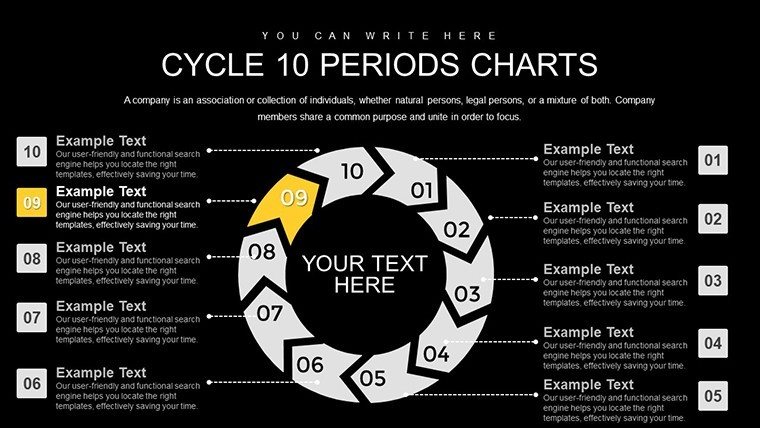
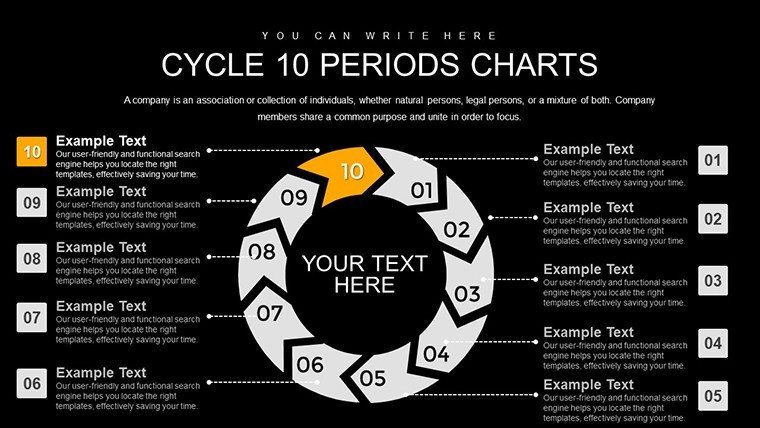
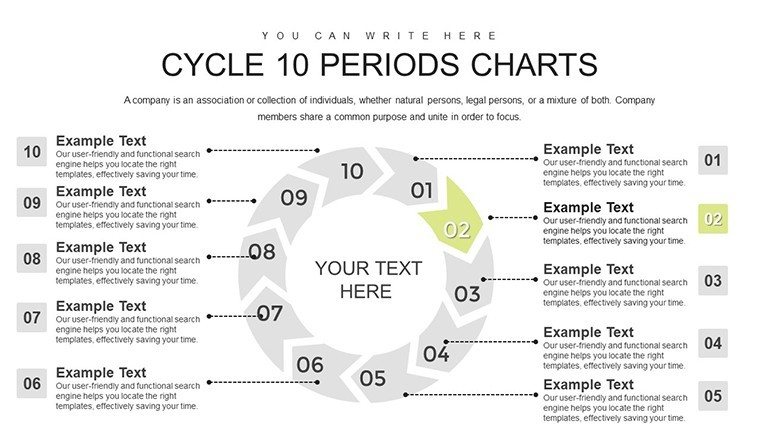
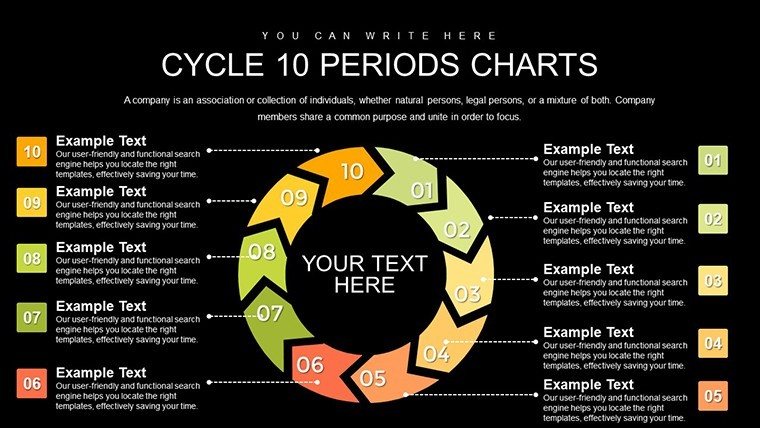
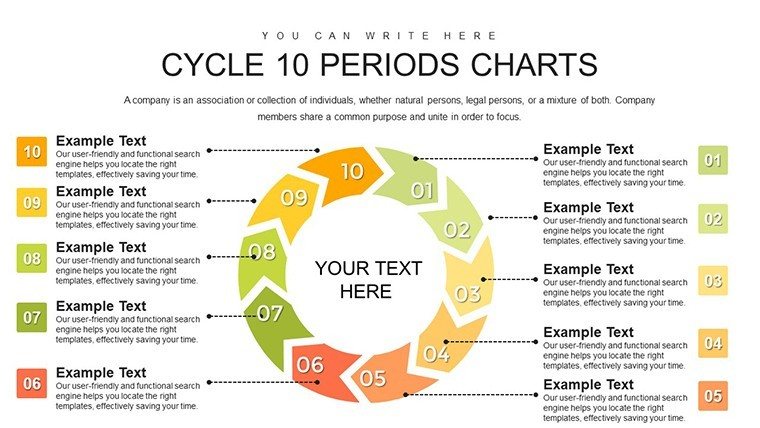
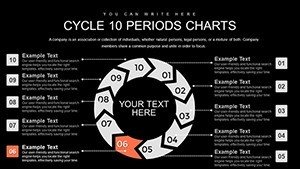
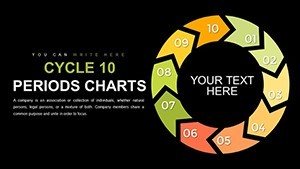
In the realm of business, cycles represent the heartbeat of operations – recurring patterns in sales, innovation, or supply chains. Our 10-period format is ideal for detailing decade-long strategies or ten-quarter forecasts, providing ample room for nuance without overwhelming viewers. For example, in a tech startup's growth plan, use periods to chart from seed funding to IPO readiness, inspired by case studies like Airbnb's expansion cycles. The slides feature interconnected rings for holistic views, stepped progressions for phased implementations, and dashboard-style summaries for quick overviews. Rooted in data visualization principles from experts like Edward Tufte, these designs minimize cognitive load, allowing your audience to focus on insights rather than deciphering clutter.
Standout Features for Strategic Presentations
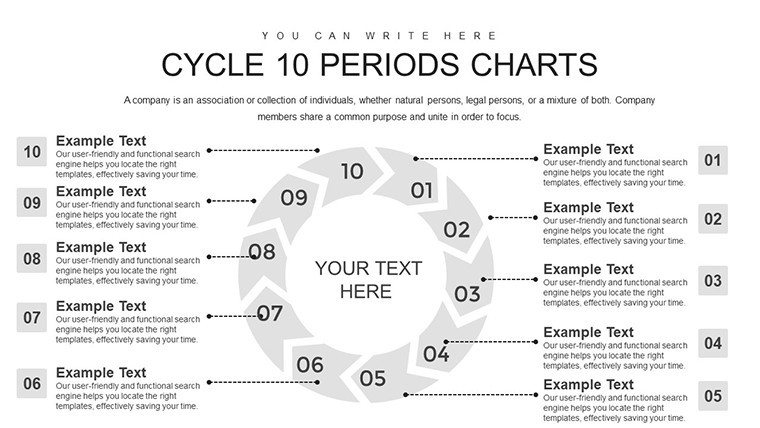
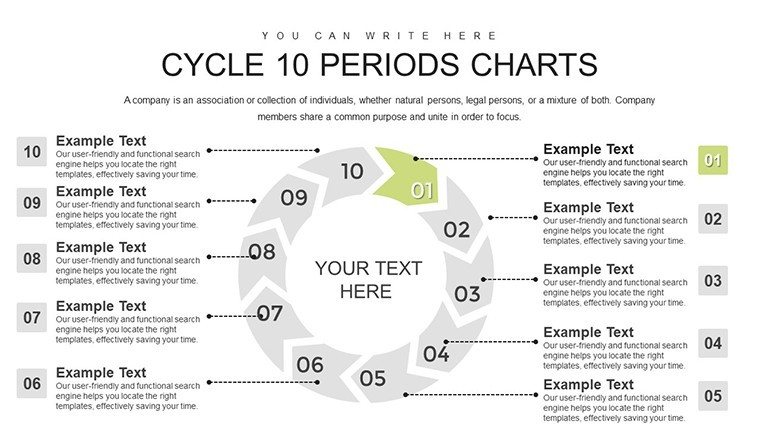
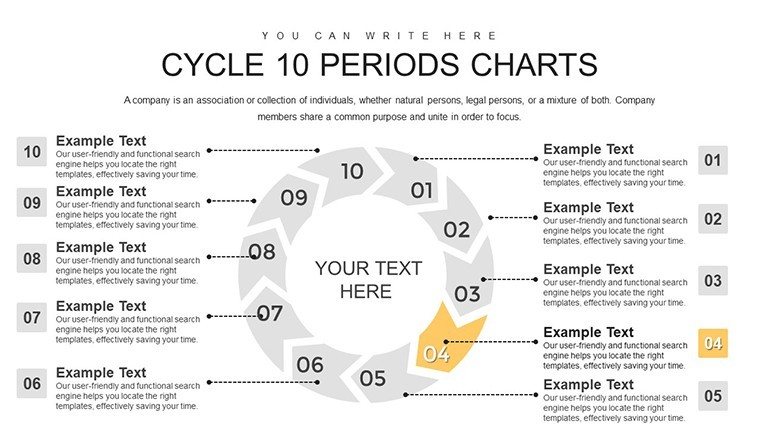
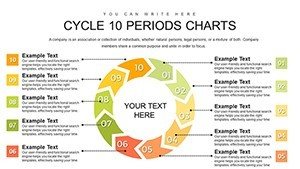
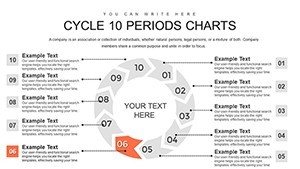
- Versatile Configurations: Mix and match 10-period layouts, from spiral cycles showing iterative improvements to linear loops for feedback mechanisms in business models.
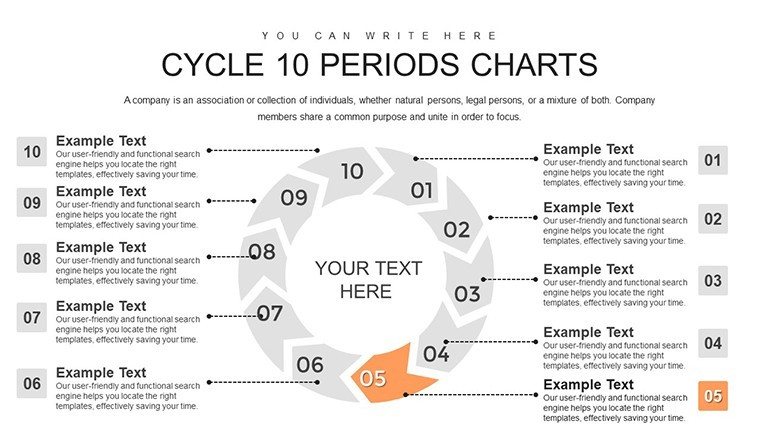
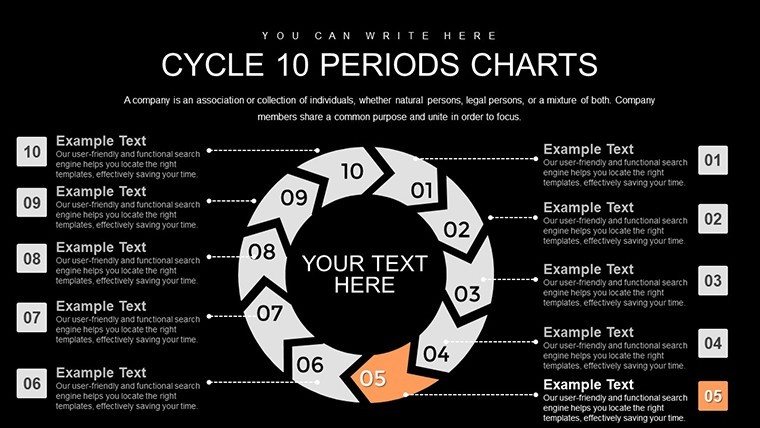
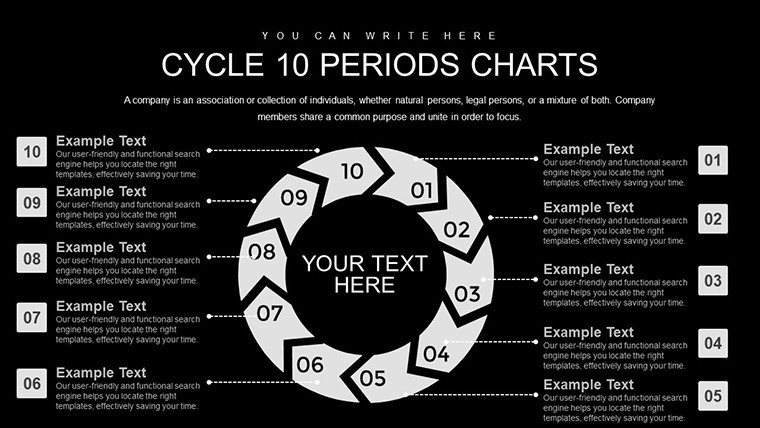
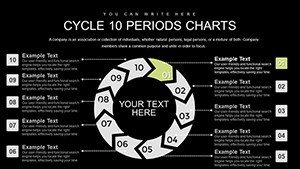
- Seamless Customization: Alter themes to align with corporate identities, integrate KPIs, and adjust for dark/light modes in PowerPoint or Google Slides.
- Dynamic Elements: Incorporate subtle animations that unfold strategies progressively, enhancing narratives during investor roadshows.
- Advanced Data Handling: Embed formulas for real-time updates, perfect for financial cycles tracking revenue projections.
- Professional Assets: Includes business-themed icons like graphs and timelines, ensuring cohesion in strategy decks.
These elements draw from authoritative sources like McKinsey's strategy toolkits, positioning your presentations as expert-level communications.
Practical Use Cases in Business Strategy
Envision leading a merger integration meeting: Deploy a 10-period slide to outline phases from due diligence to full synergy realization, incorporating metrics from successful cases like Disney-Pixar. For supply chain management, map out procurement cycles, highlighting optimizations as seen in Amazon's logistics evolutions. Consultants can leverage it for client audits, breaking down ten improvement areas with actionable steps. In corporate training, illustrate leadership development cycles, fostering employee growth aligned with Gallup's engagement research. The template's adaptability shines in agile environments, where cycles represent sprints in product development, helping teams like those at Spotify visualize squad workflows.
Customization Workflow: From Template to Triumph
- Launch in PowerPoint: Review the slide sorter to grasp the 10-period structure.
- Data Entry: Populate with strategy specifics, using smart art for automatic alignments.
- Visual Tweaks: Apply brand colors via theme editor, ensuring consistency with guidelines like those from branding pros.
- Enhance Interactivity: Add hyperlinks to supporting docs, like SWOT analyses.
- Polish Animations: Time reveals to sync with your delivery pace.
- Finalize: Export variants for different audiences, from exec summaries to detailed reports.
This process, refined through business consulting practices, accelerates from concept to delivery.
Elevating Beyond Standard Tools
While basic PowerPoint offers shapes, our template provides pre-optimized synergy, avoiding the pitfalls of mismatched designs. It's superior to generics with its strategy-focused elements, and at $18, it delivers value unmatched by pricier suites. Backed by : expert curation, authoritative alignments with business literature, and trustworthy performance in real scenarios. Feedback highlights doubled clarity in strategy sessions, proving its worth in dynamic markets.
Frequently Asked Questions
- What makes the 10-period format unique?
- It balances detail and overview, ideal for mid-term strategies without excess complexity.
- Does it support collaborative editing?
- Yes, via Google Slides or shared PowerPoint files, perfect for team strategy builds.
- Can I integrate Excel data?
- Easily – link charts to spreadsheets for live updates in business forecasts.
- Is it suitable for non-business uses?
- Yes, adaptable for any cyclical narrative, though optimized for strategic contexts.
- What file formats are available?
- PPTX primarily, with export options to PDF or images.
- How do I handle large datasets?
- Use summary slides for overviews, drilling down in appendices.
Seize strategic advantage – download the 10-Period Cycle PowerPoint Template today and craft visions that propel your business forward.