Strategic Access PowerPoint Charts for Business Pros


Navigating the complexities of business strategy requires more than words - it demands visuals that cut through the noise and deliver insights at a glance. Our Strategic Access PowerPoint Charts Template is your gateway to achieving that, with 34 meticulously crafted, editable slides focused on data visualization and graphical representation. Designed for forward-thinking professionals like executives, marketers, and consultants, this template turns abstract concepts into actionable strategies. Picture illustrating market access points in a global expansion plan or graphing competitive analyses to spotlight opportunities. Beyond basic charts, it includes layered diagrams for multi-faceted strategies, ensuring your presentations are not only informative but inspiring. Fully compatible with PowerPoint and easy to customize, it's the tool that bridges the gap between data overload and strategic clarity, helping you secure buy-in from stakeholders and drive organizational growth.
Elevate Your Data Visualization Game
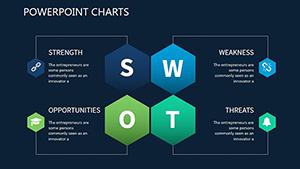
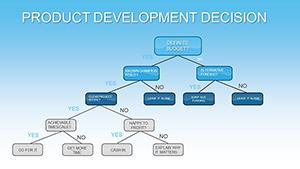
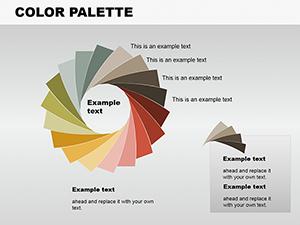
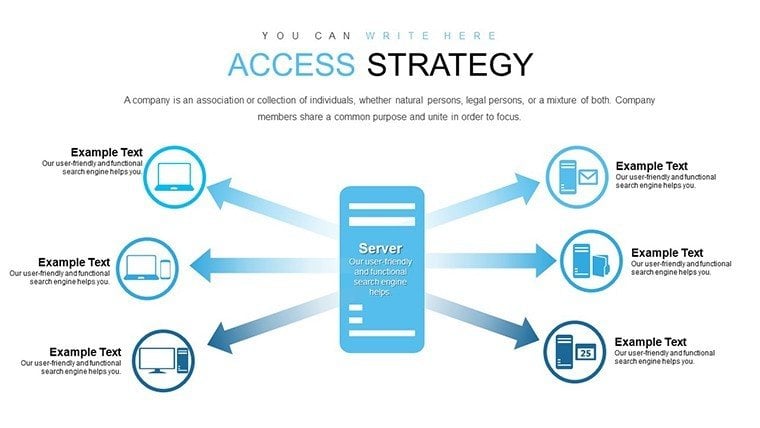
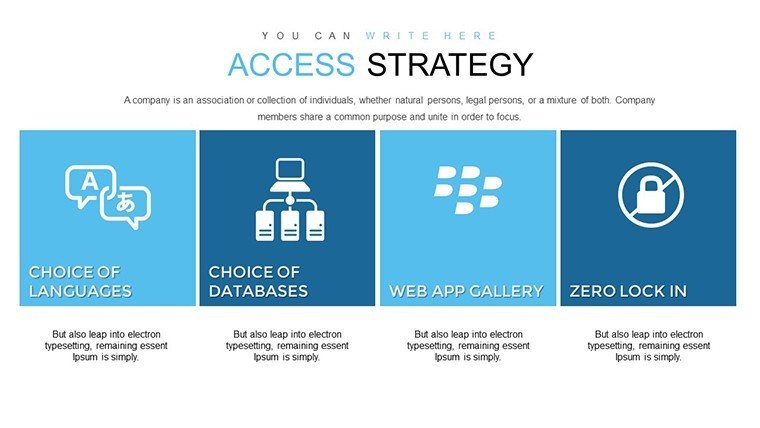
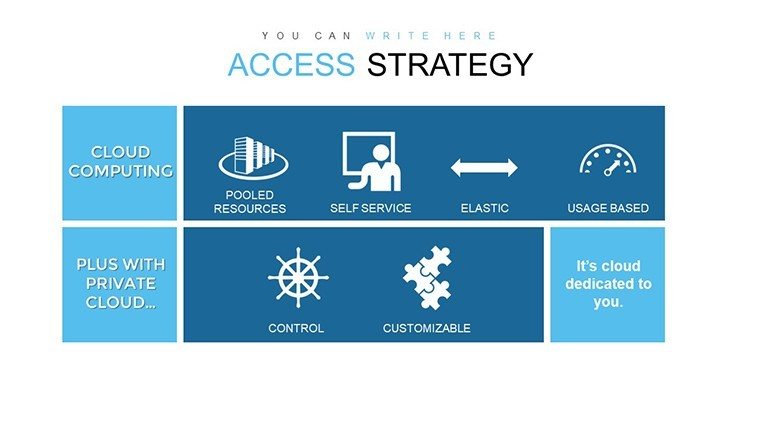
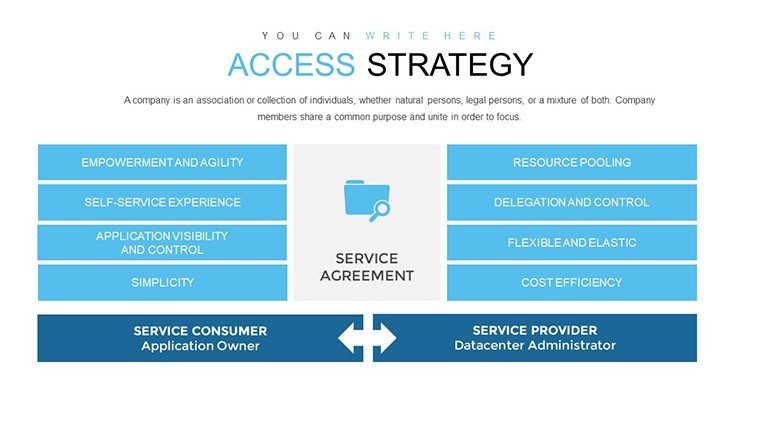
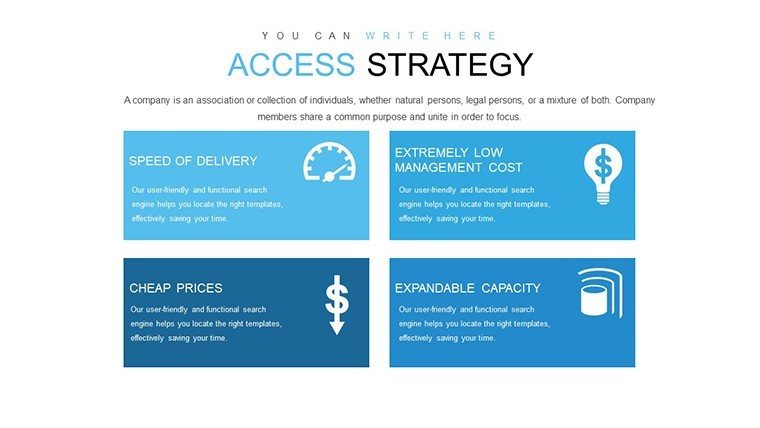
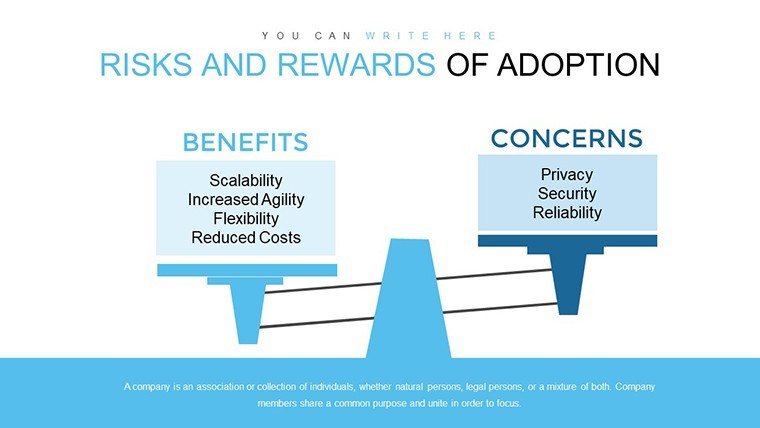
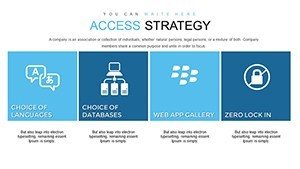
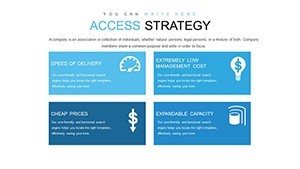
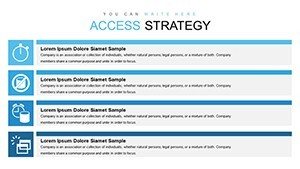
In an era where data drives decisions, the ability to present it strategically is paramount. This template features charts that go beyond bar graphs, incorporating radial diagrams for access strategies and flow charts for process mapping. For example, use the access wheel charts to depict entry barriers in new markets, aligning with frameworks like Porter's Five Forces for authoritative analysis. Benefits include enhanced audience retention - studies from McKinsey show that visual aids improve understanding by 65%. With customization options, adapt hues to your brand palette or resize elements for emphasis, making each slide a tailored masterpiece.
Standout Features for Strategic Mastery
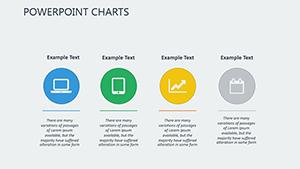
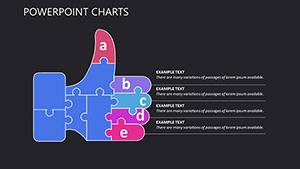
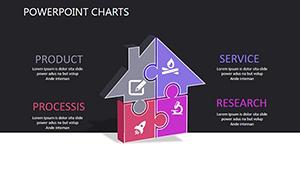
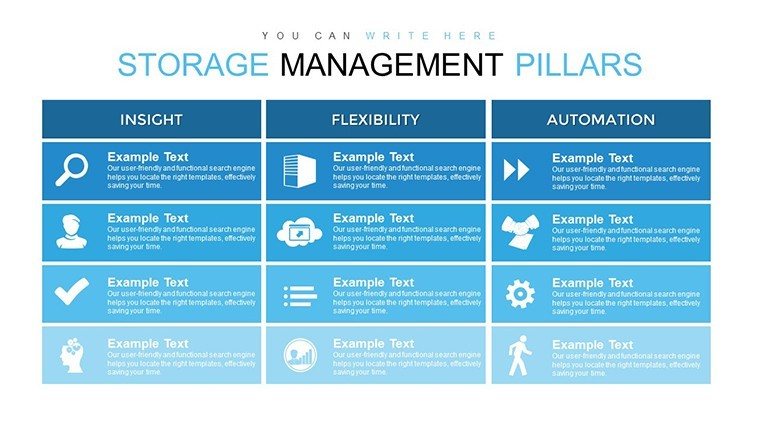
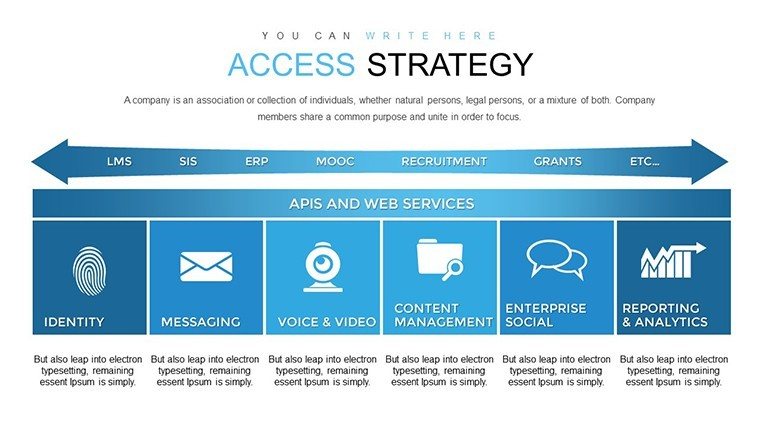
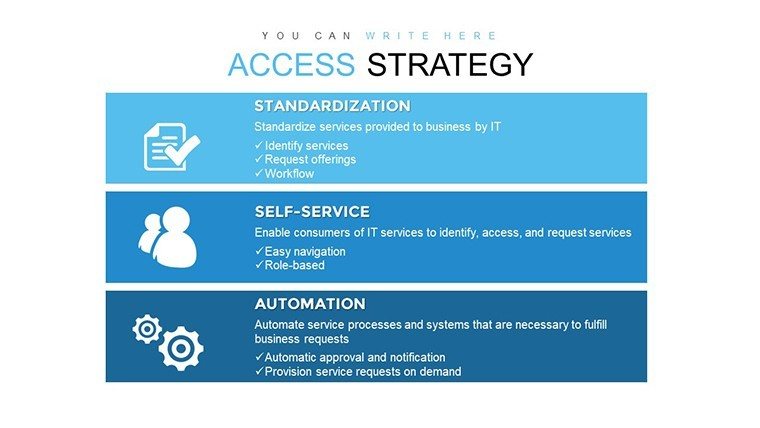
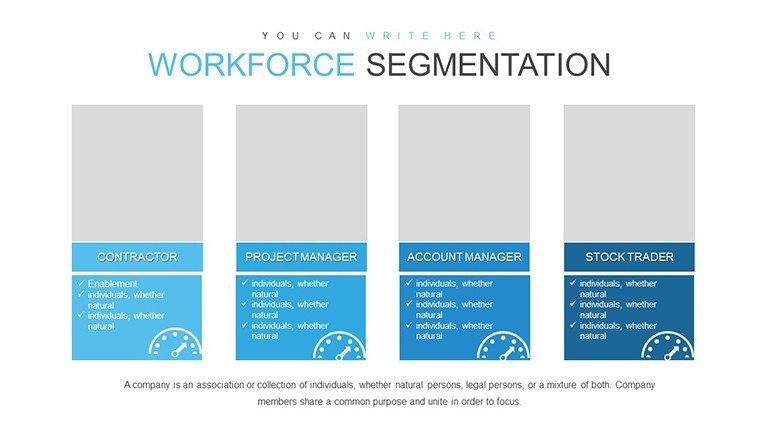
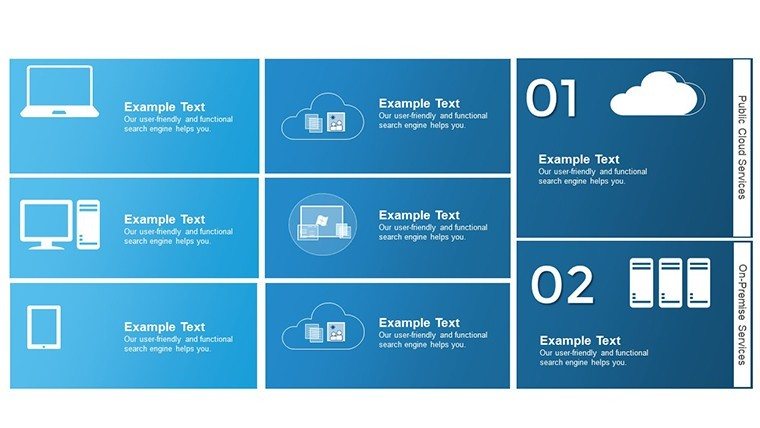
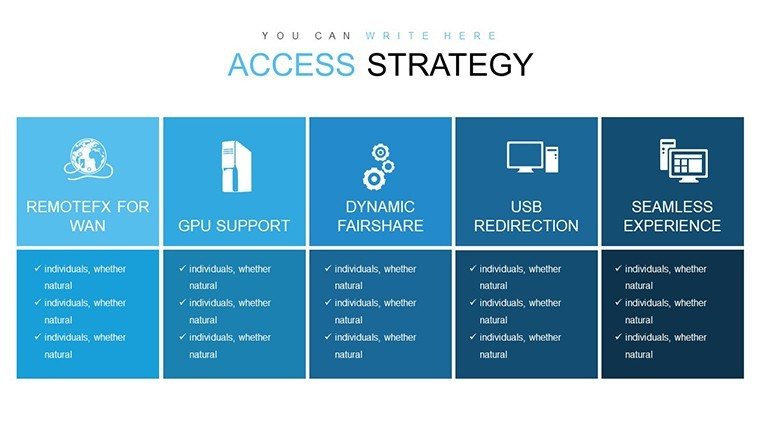
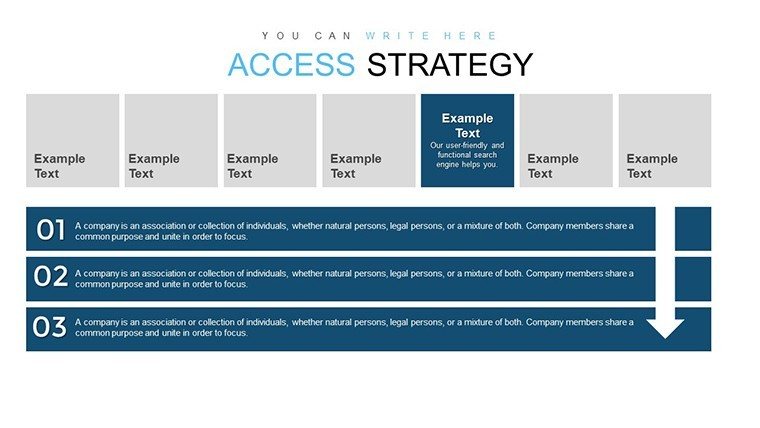
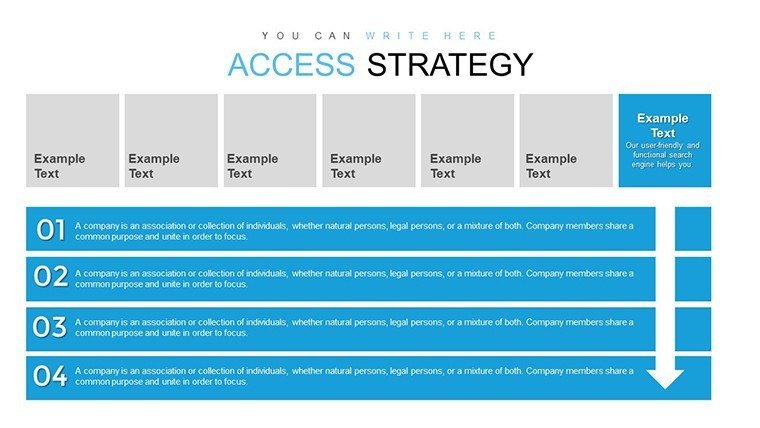
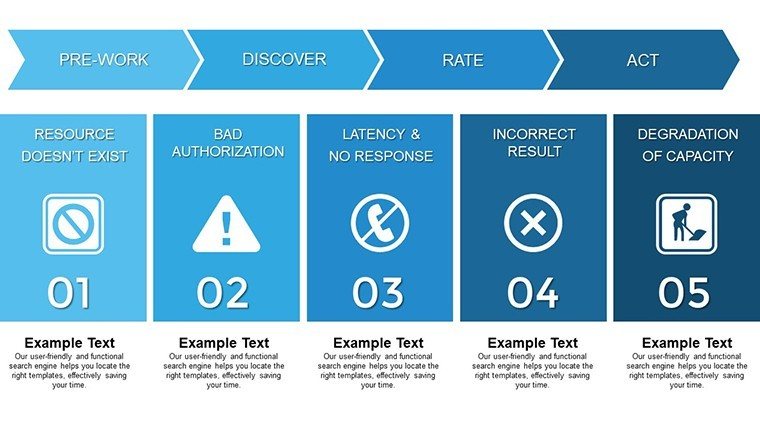
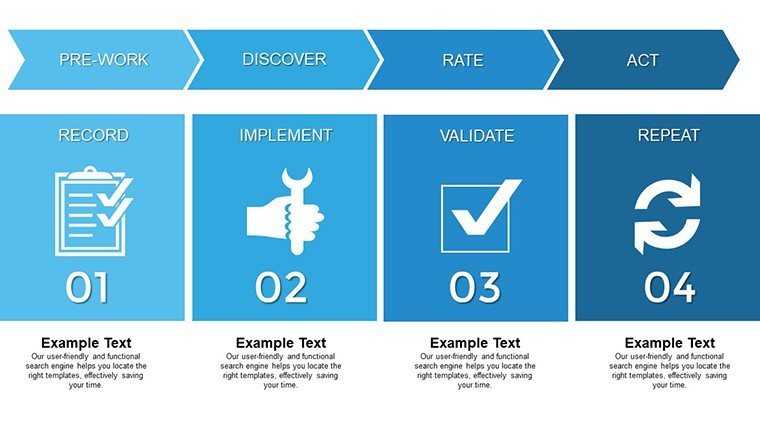
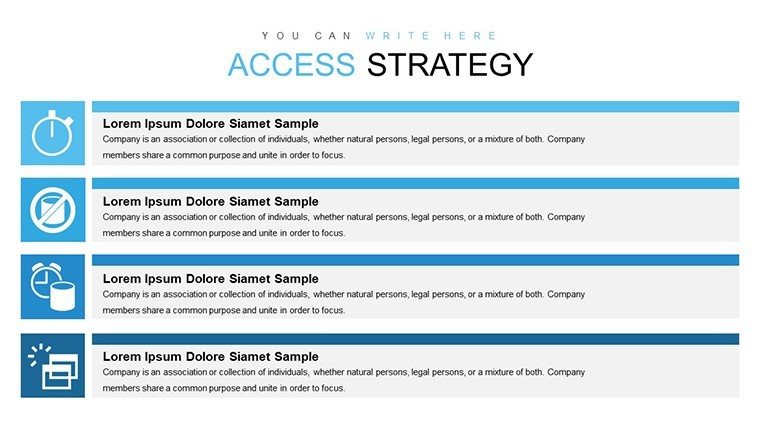
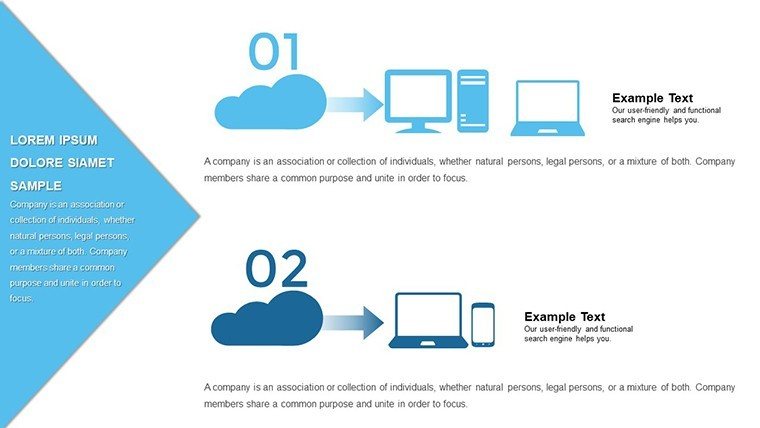
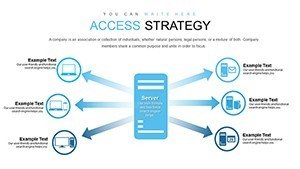
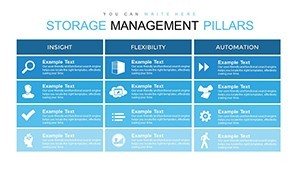
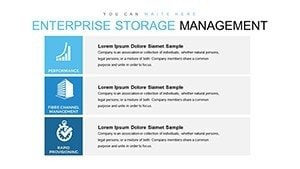
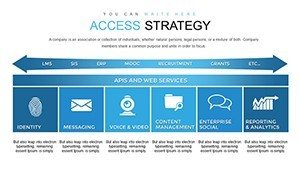
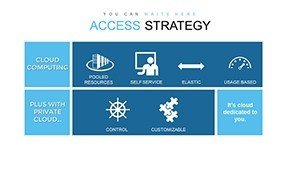
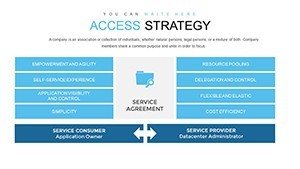
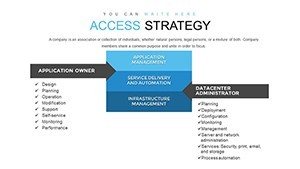
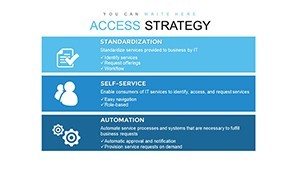
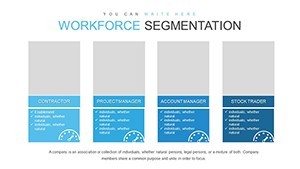
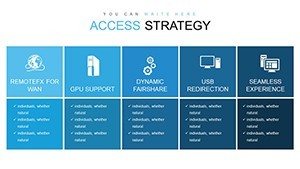
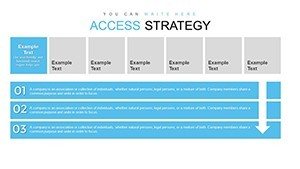
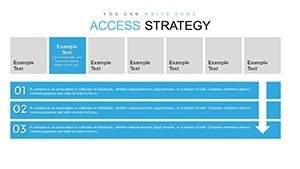
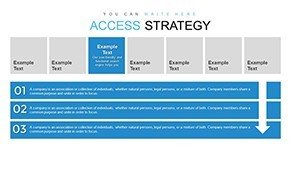
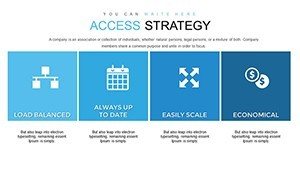
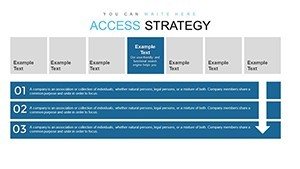
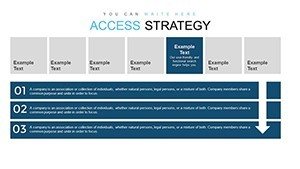
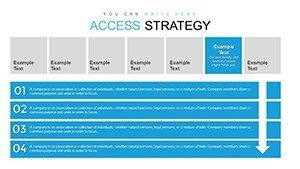
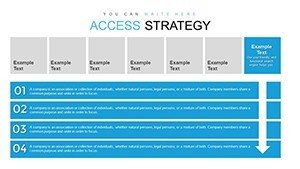
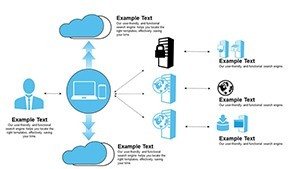
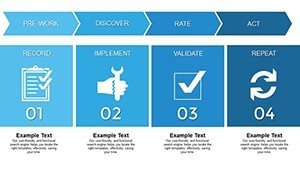
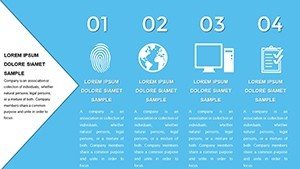
- Crafted Charts: Precision-designed for visualizing access points, such as supply chain nodes or customer journey maps.
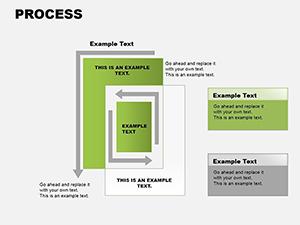
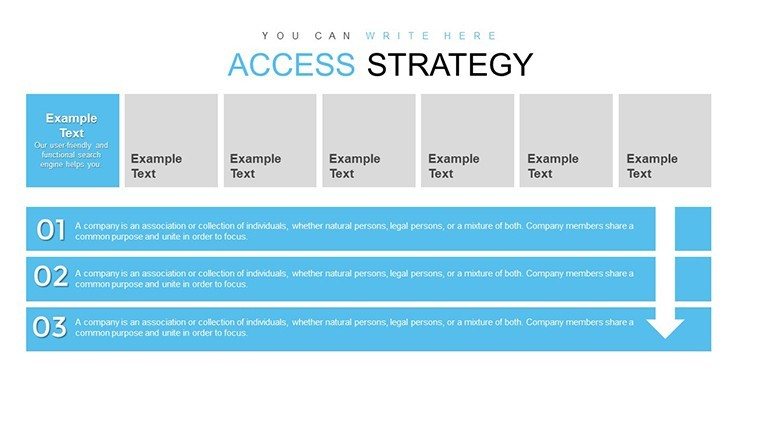
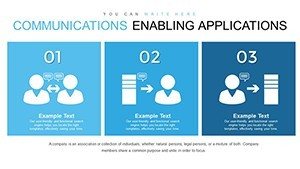
- Captivating Graphs: Dynamic representations that clarify trends, like growth trajectories in strategic planning.
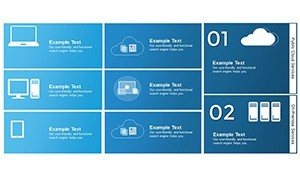
- Customization Ease: Intuitive edits for fonts, colors, and layouts, no design expertise needed.
- Offline/Online Access: Downloadable .pptx format for flexible use across devices.
These elements draw from expert insights, like those in Harvard Business Review articles on strategic visualization, ensuring your content exudes trustworthiness.
Tailored Use Cases Across Industries
Apply this template where strategy meets execution. Business professionals can craft investor decks showing market access strategies, perhaps for a fintech startup entering emerging economies. Marketers might use it to graph campaign ROI, highlighting access to target demographics with data-backed visuals. Educators can simplify complex theories, like strategic management models, for student engagement. Consultants impress clients by mapping out access improvements in operations, as in a real case where a retail firm optimized supplier networks, boosting efficiency by 30%. Unlike standard PowerPoint defaults, which lack depth, this template's specialized charts provide a professional edge, saving time on design while amplifying impact.
Workflow Integration: From Concept to Delivery
- Secure Download: Instant access post-purchase for immediate strategy building.
- Load and Explore: Open in PowerPoint to browse 34 slides, selecting those fitting your narrative.
- Personalize Content: Insert data, adjust graphs, and add annotations for precise messaging.
- Refine for Audience: Test visuals in presentation mode, incorporating feedback loops.
- Deploy Strategically: Share via cloud or present live, tracking engagement metrics post-session.
Tip: Pair with tools like Excel for live data linking, keeping your charts current and credible.
The Strategic Advantage You Need
This isn't just a template - it's a catalyst for better business outcomes. By focusing on access themes, it addresses pain points like unclear strategy communication, fostering alignment in teams. Authoritative sources, such as Deloitte reports on data strategy, validate the use of such visuals for competitive advantage. For entrepreneurs, it's invaluable in pitch scenarios, where a well-graphed access plan can sway investors. Educators and consultants alike find its versatility unmatched, adapting to diverse contexts without losing professionalism. Embrace this tool to not only present strategies but to propel them forward with conviction.
Frequently Asked Questions
- How customizable are the graphs? Extremely - edit data points, styles, and scales to fit your specific strategy needs.
- Does it work with older PowerPoint versions? Yes, compatible with recent versions, ensuring broad accessibility.
- Ideal for what presentation lengths? Versatile for short pitches or in-depth sessions with its 34-slide variety.
- Can I add my own data sources? Absolutely, integrate Excel or other tools for dynamic updates.