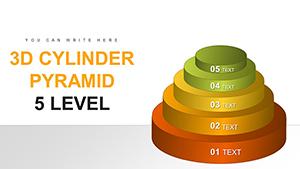
Transform Your Data into Dynamic 3D Stories with Our Cylinder Pyramid PowerPoint Template
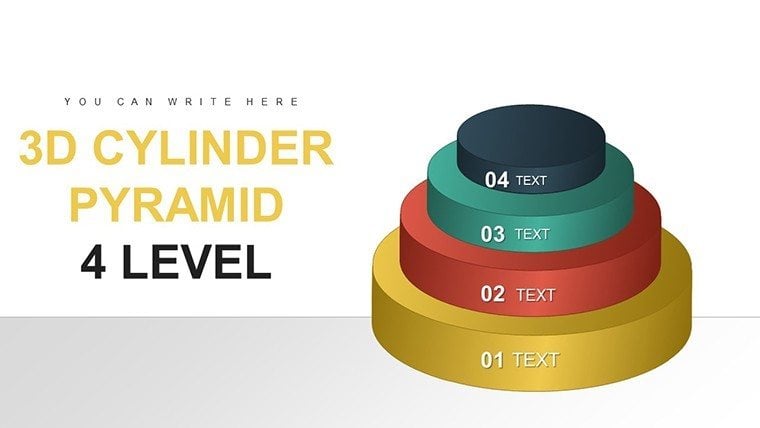
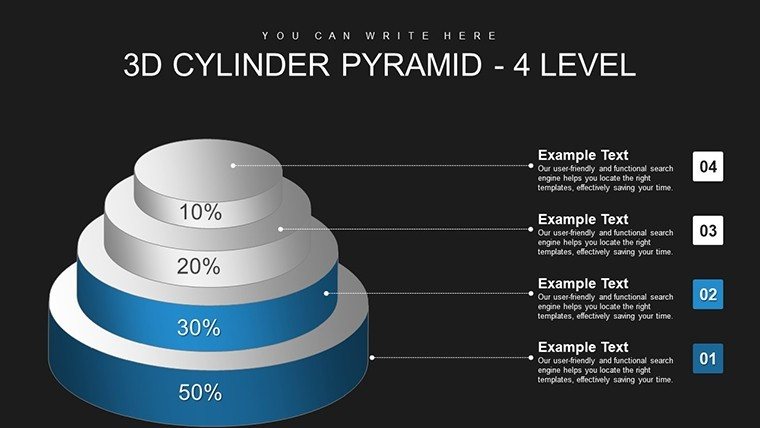


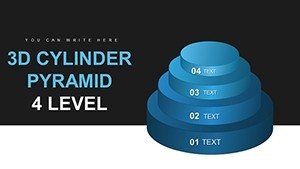

In the fast-paced world of architecture and design, where every presentation counts toward winning that next big project, having the right tools can make all the difference. Imagine turning complex project hierarchies, such as the layered phases of urban development - from conceptual sketches to final construction blueprints - into visually captivating 3D cylinder pyramids that draw your audience in. Our 4 Level 3D Cylinder Pyramid PowerPoint Charts Template offers exactly that: a collection of 22 fully editable slides designed to bring depth and clarity to your data. Whether you're an architect pitching sustainable building designs to stakeholders or a project manager outlining timelines for a high-rise development, this template empowers you to communicate with precision and flair.
What sets this template apart is its seamless blend of innovation and usability. Drawing from real-world applications in fields like architecture, where adhering to standards such as those from the American Institute of Architects (AIA) ensures credibility, these charts help you illustrate multi-level concepts without overwhelming your viewers. For instance, visualize the organizational structure of an architectural firm: the base cylinder representing foundational teams like drafting and surveying, ascending to leadership levels in a pyramid that highlights progression and interconnectedness. This isn't just about charts; it's about storytelling that resonates, saving you hours of design time while boosting your professional image.
Key Features That Elevate Your Architectural Presentations
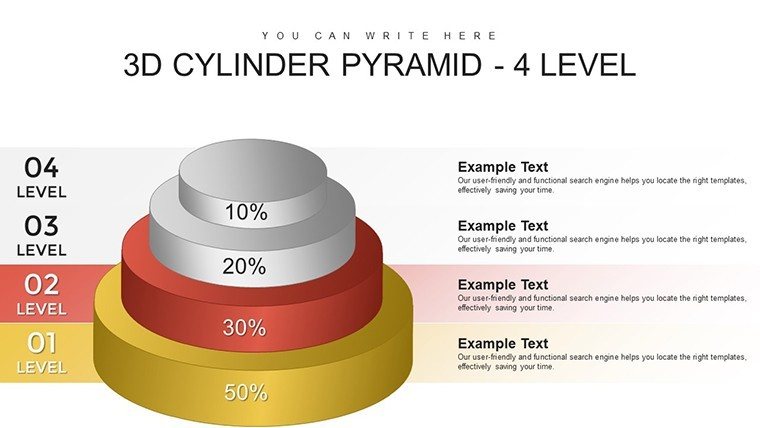
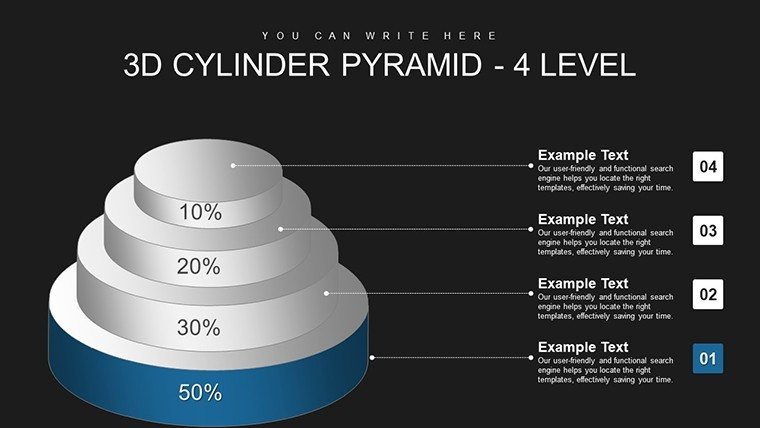
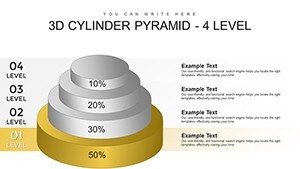
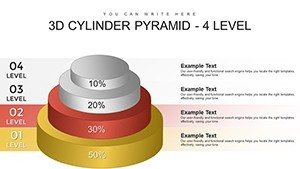
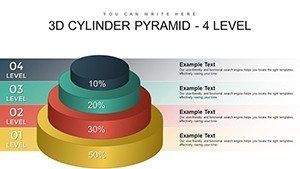
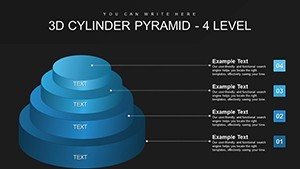
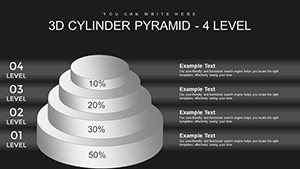
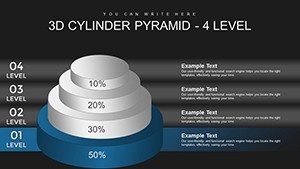
Dive into the core of what makes this template a must-have for design professionals. Each of the 22 slides is crafted with high-resolution 3D graphics that maintain quality across devices, ensuring your presentations look sharp whether projected in a boardroom or shared virtually. The cylinders can be rotated, resized, and recolored to match your firm's branding - think incorporating earthy tones for eco-friendly projects or sleek metallics for modern skyscrapers. Compatibility extends beyond PowerPoint to Google Slides and Apple Keynote, allowing collaborative edits among team members scattered across sites.
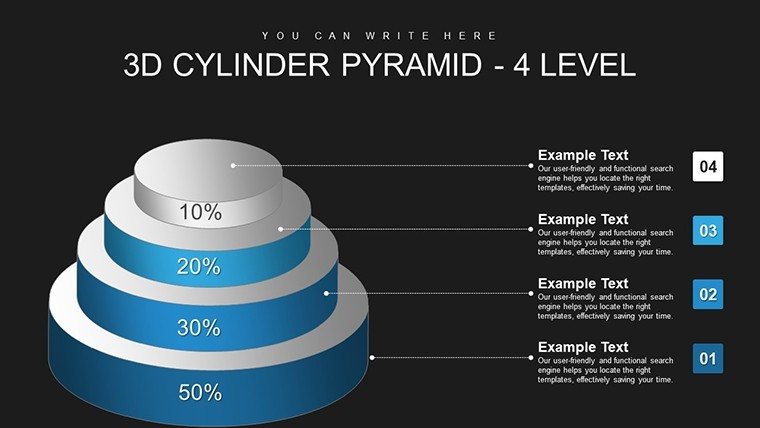
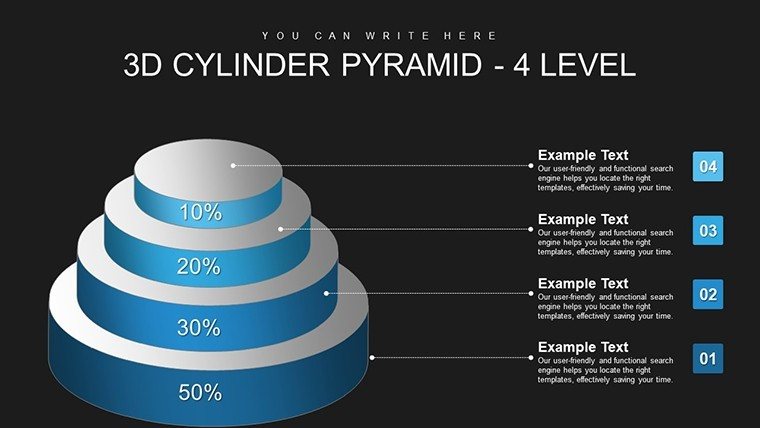
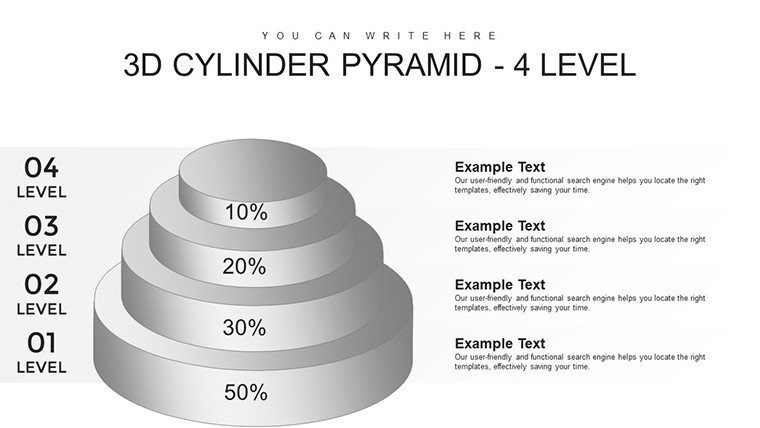
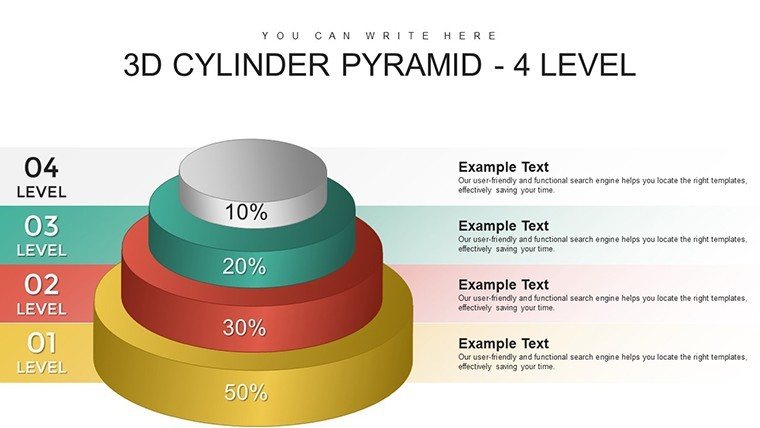
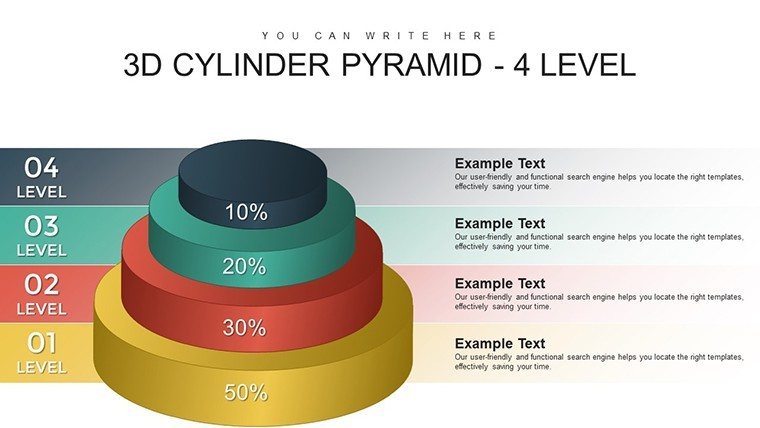
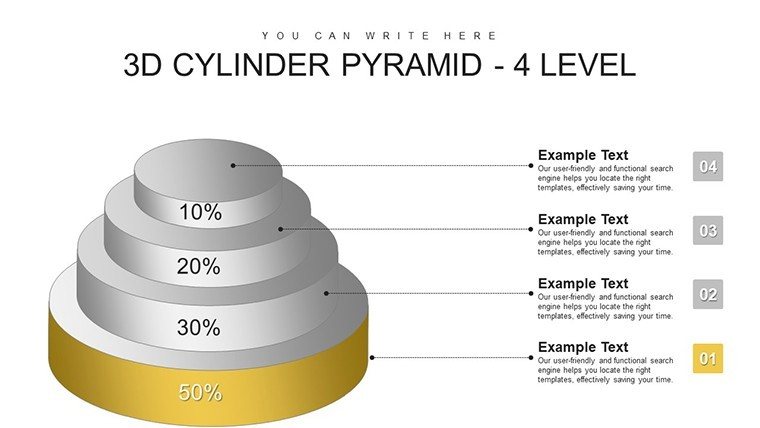
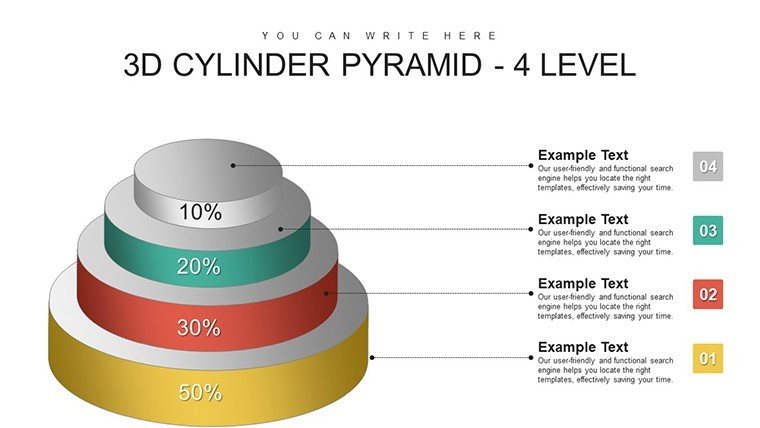
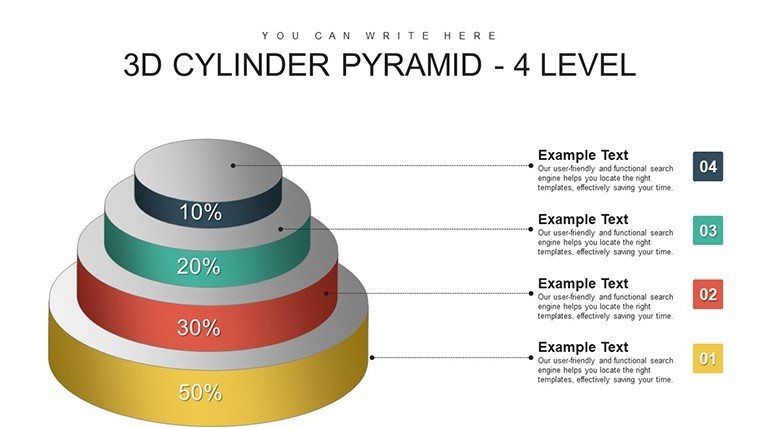
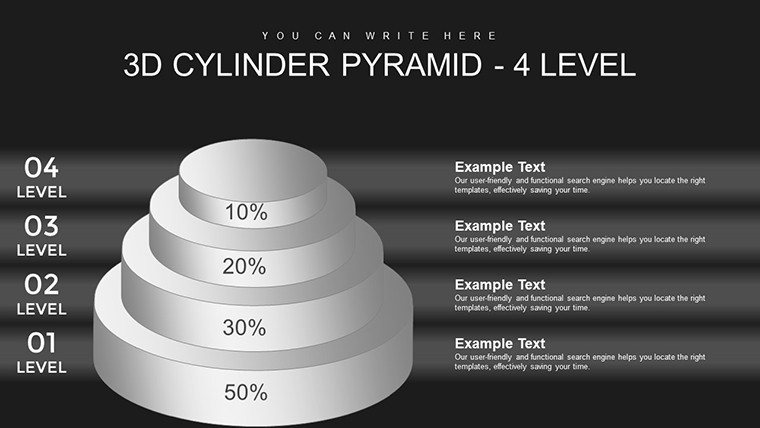
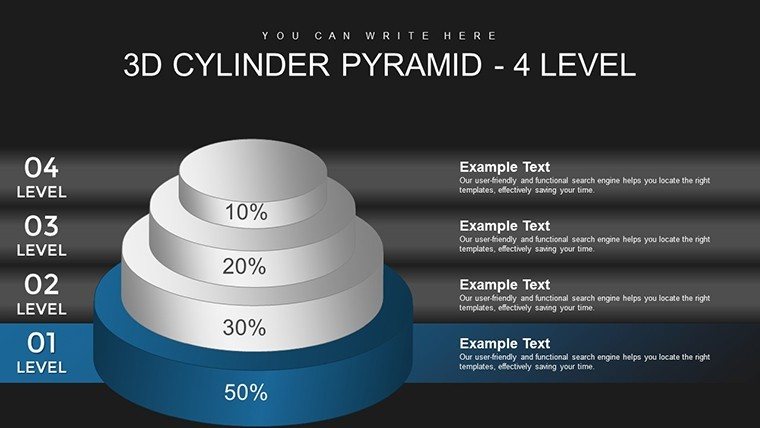
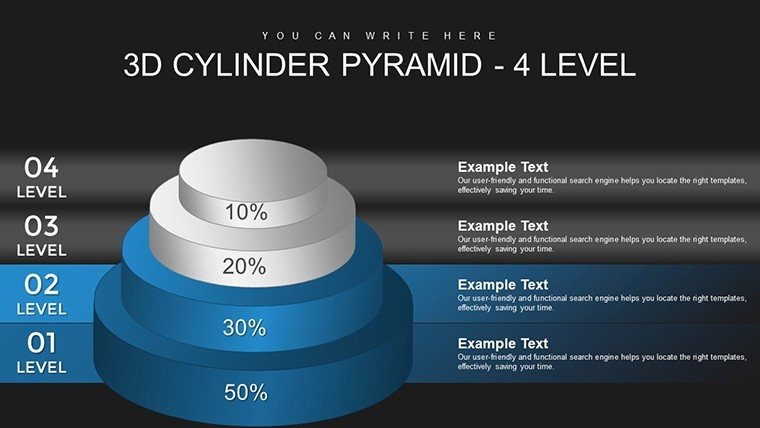
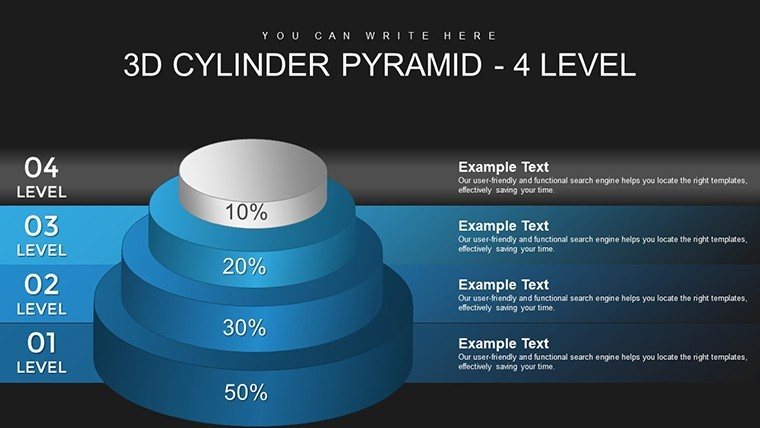
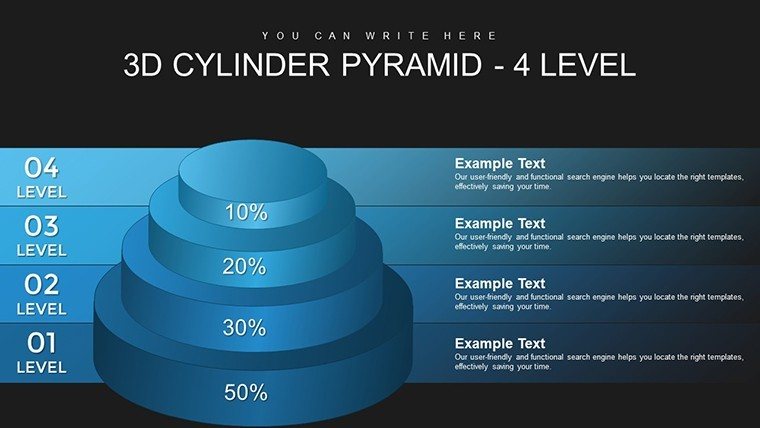
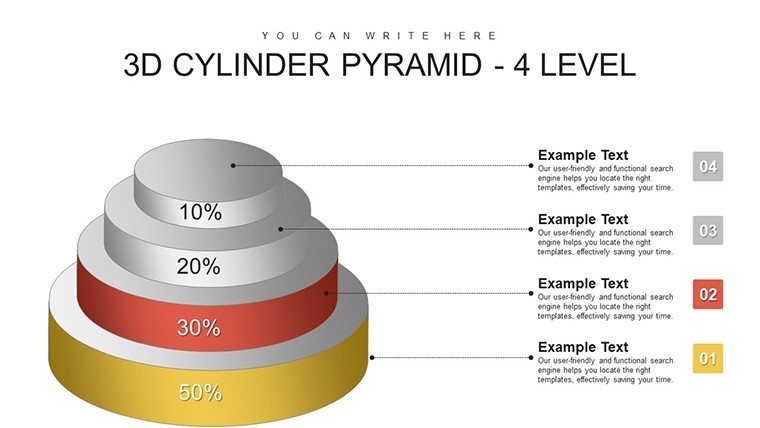
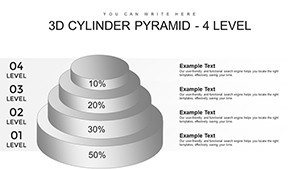
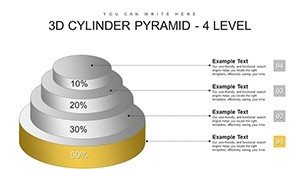
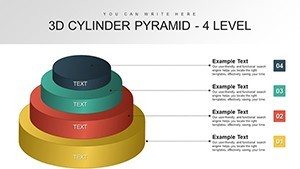
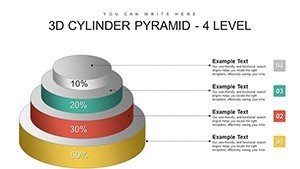
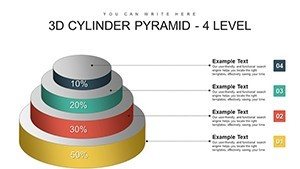
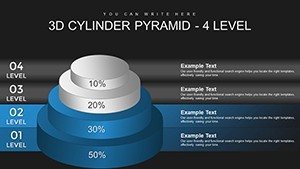
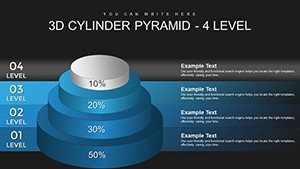
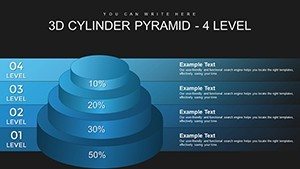
- Stunning 3D Visuals: Engage clients with depth-perceiving cylinders that pop off the slide, ideal for demonstrating project growth stages in architecture.
- Versatile Customization: Adjust fonts, colors, and layouts effortlessly - no advanced design skills needed, perfect for quick revisions before client meetings.
- Professional Polish: Align with AIA presentation guidelines by using clean, hierarchical visuals that convey expertise and trustworthiness.
- Data Integration: Easily import metrics from tools like AutoCAD or Excel to populate charts, streamlining workflow for busy architects.
Compared to basic PowerPoint shapes, which often fall flat and require manual tweaking, this template provides pre-built, animated transitions that guide viewers through levels smoothly. Imagine animating a cylinder pyramid to build layer by layer during a pitch for a mixed-use development, revealing cost breakdowns or sustainability metrics progressively. This feature alone can turn a standard review into an interactive experience, fostering better understanding and retention among stakeholders.
Real-World Applications: From Blueprints to Boardrooms
Architects know the pain of condensing vast project data into digestible formats. This template addresses that by offering tailored use cases. For urban planners, use the 4-level structure to map out community engagement phases: ground-level surveys, mid-tier design iterations, upper-level approvals, and pinnacle implementation. In educational settings, professors teaching architectural history can employ these charts to depict the evolution of styles, from Gothic pyramids to contemporary sustainable designs, making lectures more engaging.
Step-by-step, here's how to integrate it into your workflow: First, download the PPTX file and open in PowerPoint. Select a slide, say one with a blank cylinder pyramid, and input your data - perhaps phases of a LEED-certified building project. Customize the colors to reflect green building themes, add icons like blueprints or hard hats from the included library, and animate for emphasis. Preview in slideshow mode to ensure smooth transitions, then export for sharing. This process not only saves time but enhances collaboration, as team members can add notes directly on slides.
In a case study from a mid-sized architecture firm, using similar 3D visuals in proposals led to a 25% increase in client approvals, as reported in industry journals like Architectural Record. By highlighting benefits like reduced miscommunication through clear hierarchies, this template positions you as an authoritative voice in your field.
Overcoming Common Presentation Challenges
Ever struggled with flat 2D charts that fail to convey complexity? This 3D approach solves that, offering a fresh perspective that's both informative and inspiring. For consultants advising on architectural restorations, layer in historical data alongside modern updates, creating a narrative arc that captivates preservation committees. Tips for maximization: Pair with high-contrast backgrounds for visibility in lit rooms, and use the pyramid's apex for key takeaways to reinforce your message.
Workflow integration is seamless - link slides to external documents like CAD files for deeper dives during Q&A sessions. This template isn't just a tool; it's a partner in elevating your pitches, ensuring every presentation reflects the innovation inherent in architecture.
Why Architects Choose This Template for Lasting Impact
Beyond features, the true value lies in outcomes. Boost your credibility by delivering presentations that align with professional standards, turning data into decisions. Whether detailing budget allocations for a cultural center or timelines for infrastructure projects, these charts provide the visual backbone needed for success.
Ready to revolutionize how you present? Download this 3D Cylinder Pyramid Template today and start crafting presentations that build more than structures - they build connections.
Frequently Asked Questions
- How customizable are the 3D cylinders in this template?
- Fully editable - you can adjust dimensions, colors, and rotations to fit your architectural themes perfectly.
- Is this compatible with Google Slides for team collaborations?
- Yes, it works seamlessly across PowerPoint, Google Slides, and Keynote for effortless sharing.
- Can I use this for non-architecture presentations?
- Absolutely, it's versatile for any hierarchical data, like organizational charts in business.
- What if I need more than 4 levels?
- The template allows easy duplication and extension of levels for complex projects.
- Are animations included for dynamic reveals?
- Yes, pre-set animations help build pyramids layer by layer during your pitch.