Affiliate Marketing PowerPoint Charts Template


Affiliate marketing thrives on data-driven decisions, and presenting those insights effectively can make or break partnerships. Our Affiliate Marketing PowerPoint Charts Template equips you with 38 editable slides to transform metrics into persuasive narratives. Ideal for affiliate marketers, teams, and business pros, it features cycle diagrams for strategy flows, arrow charts for progress tracking, and puzzle layouts for integrating complex ideas. Whether pitching to potential affiliates, reporting ROI to stakeholders, or collaborating on campaigns, this template ensures your data speaks volumes. Fully compatible with PowerPoint, it offers easy customization to align with your branding, helping you build credibility and foster growth in the competitive affiliate landscape. Unlock the potential to engage, inform, and convert with visuals that turn numbers into actionable stories.
Unlocking Data Insights in Affiliate Strategies
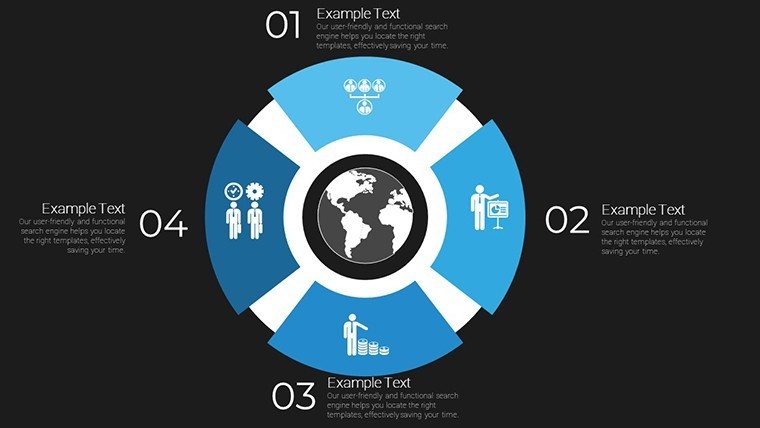
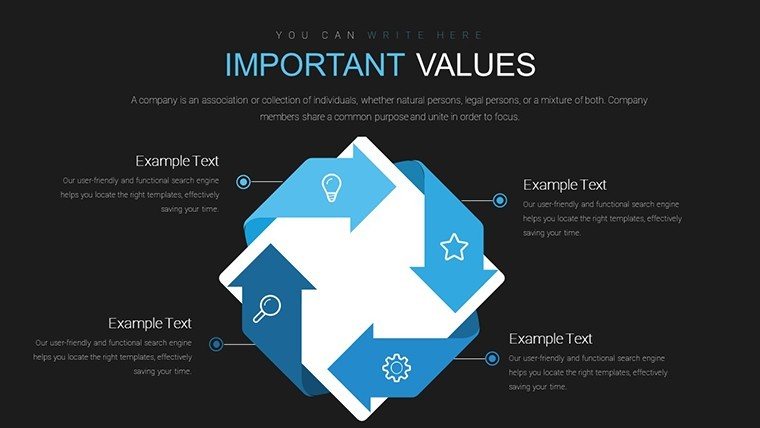
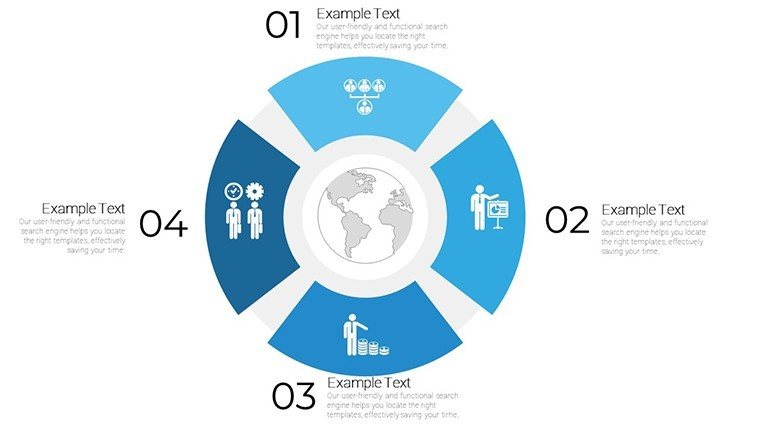
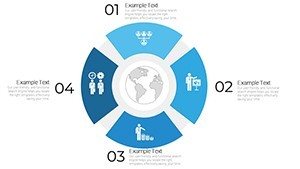
In affiliate marketing, where commissions hinge on performance metrics, clear visualization is key to strategy refinement. This template's dynamic graphs allow you to plot conversion rates, click-throughs, and earnings trends, making abstract data tangible. For instance, use cycle charts to illustrate the affiliate lifecycle - from recruitment to payout - helping teams identify bottlenecks. Drawing from industry benchmarks like those from Affiliate Management Days conferences, these visuals promote best practices in presentation, enhancing your authoritative voice in meetings.
Standout Features for Strategic Presentations
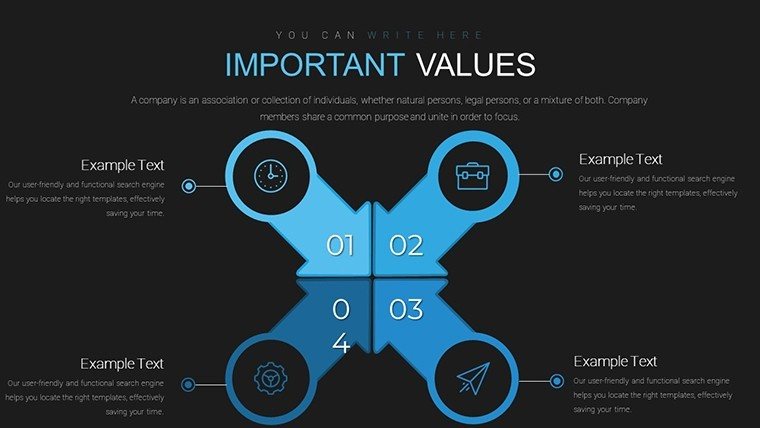
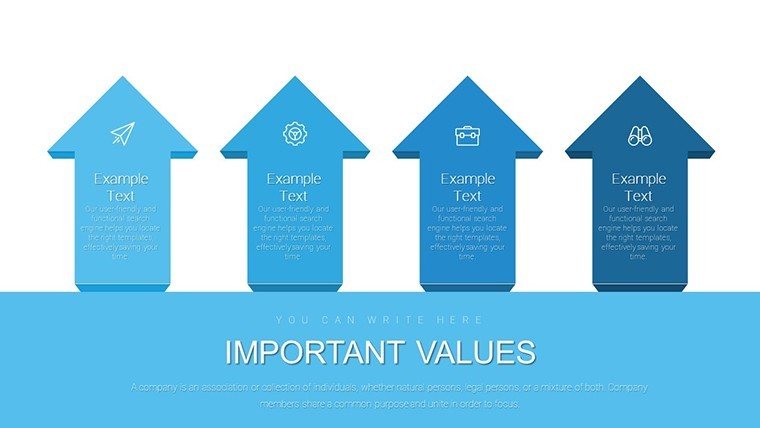
With 38 slides at your disposal, the template provides a comprehensive toolkit for affiliate storytelling. Dynamic data graphs support real-time updates, while customization options let you tweak layouts for specific campaigns. Variety in designs - from arrows denoting directional growth to puzzles symbolizing integrated partnerships - caters to diverse narrative needs.
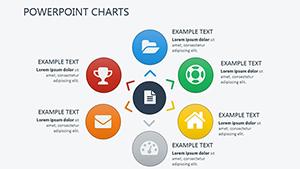
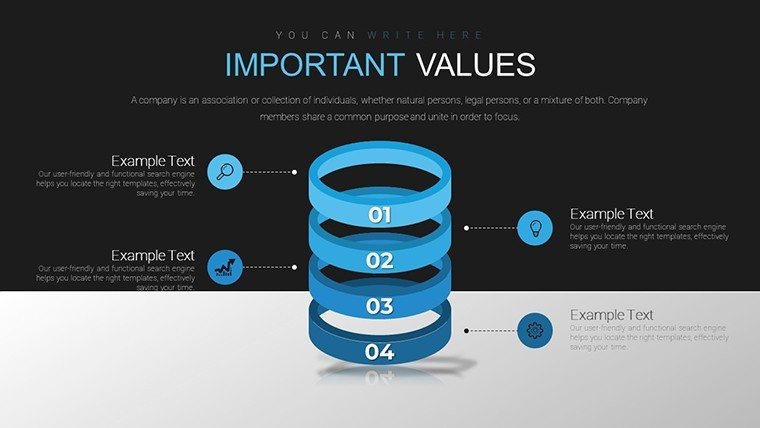
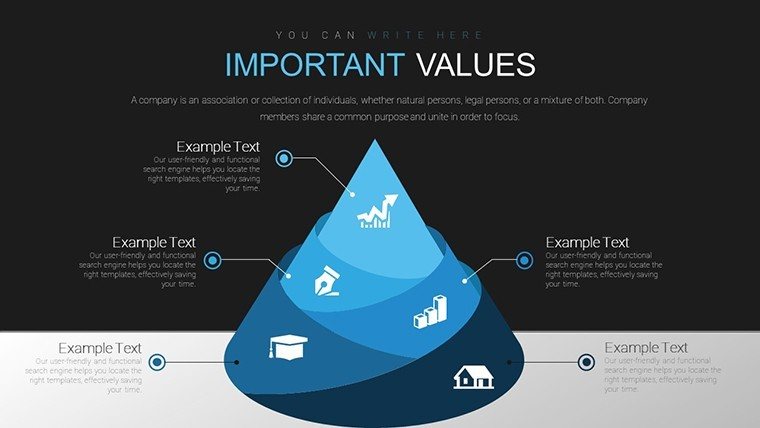
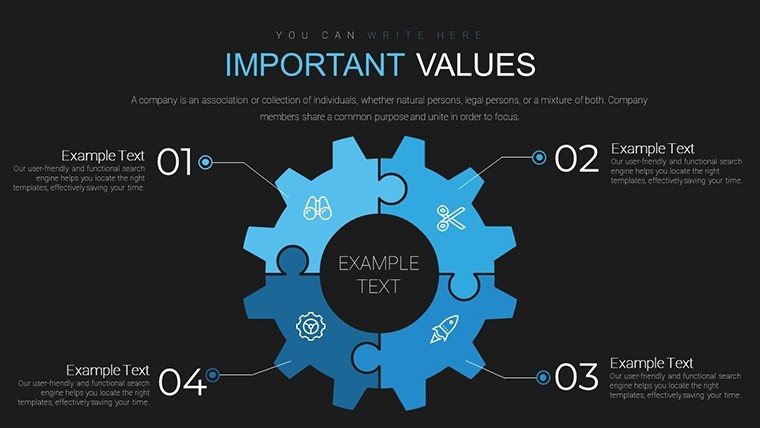
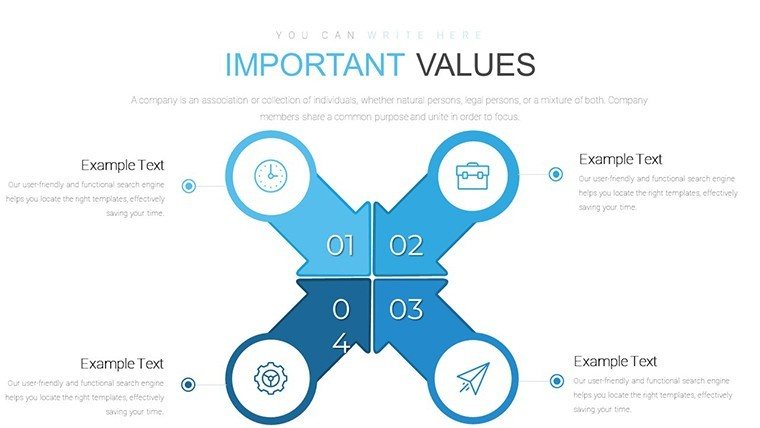
- Cycle Diagrams: Map out recurring processes like content promotion cycles.
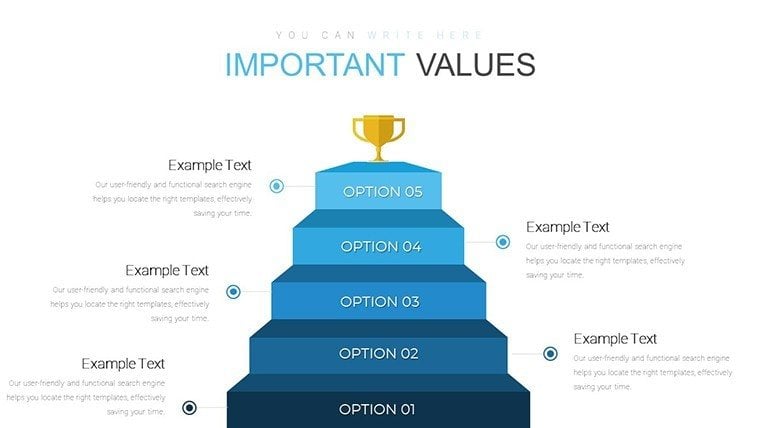
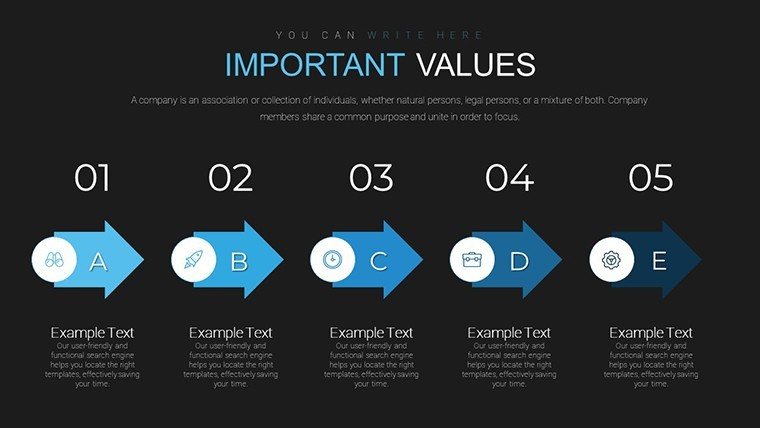
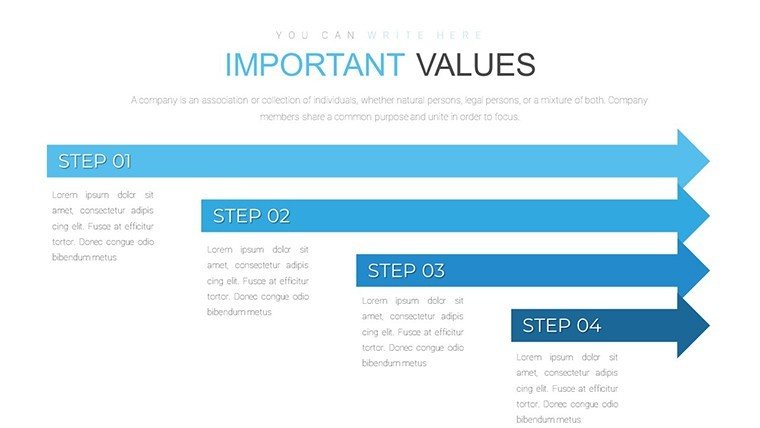
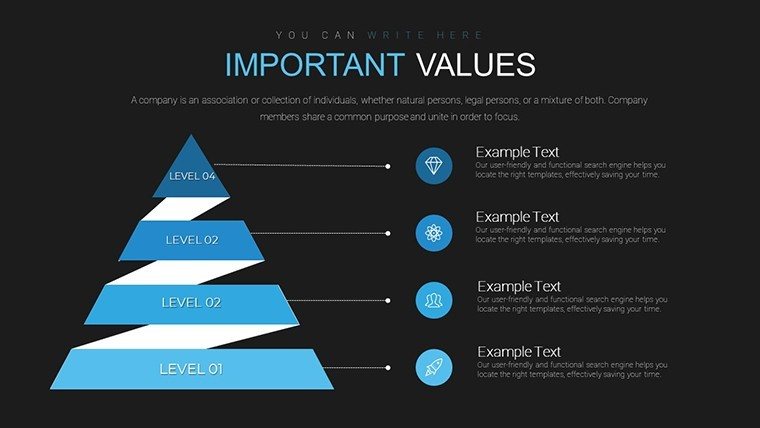
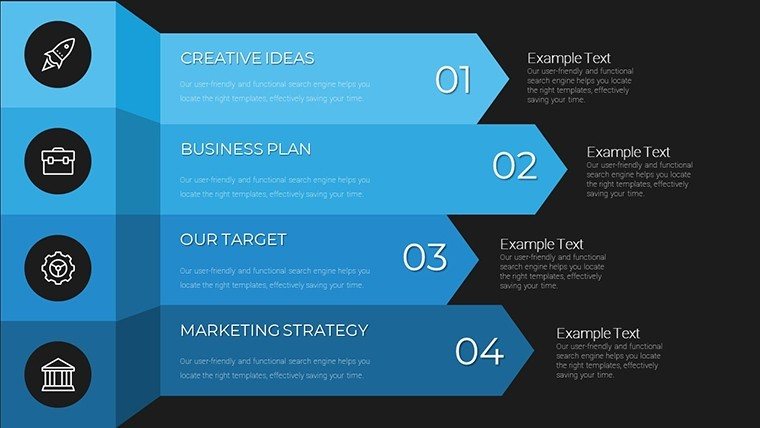
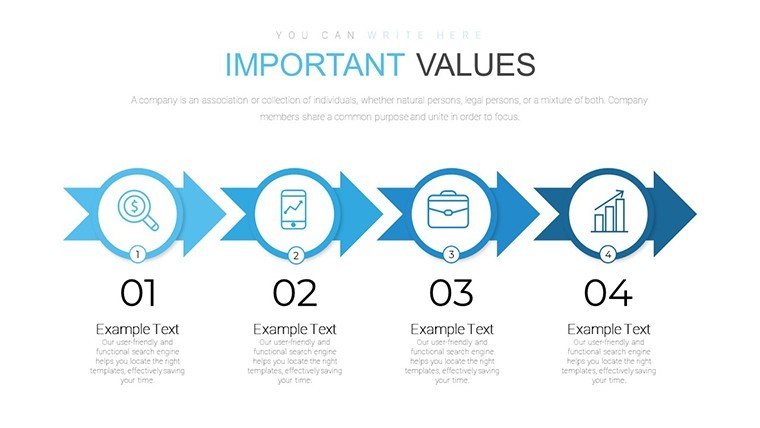
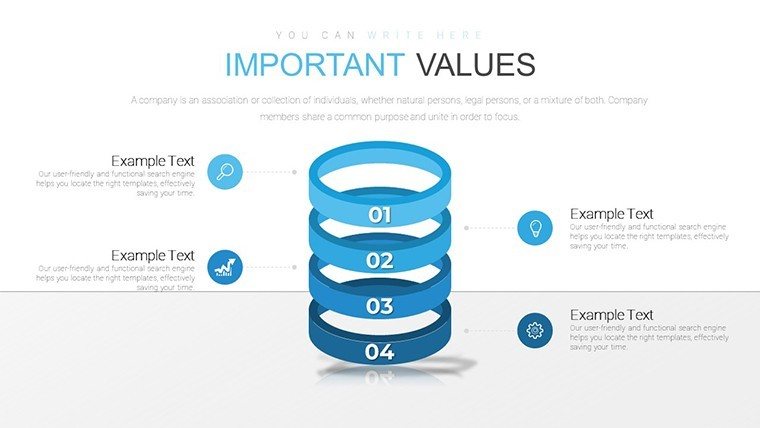
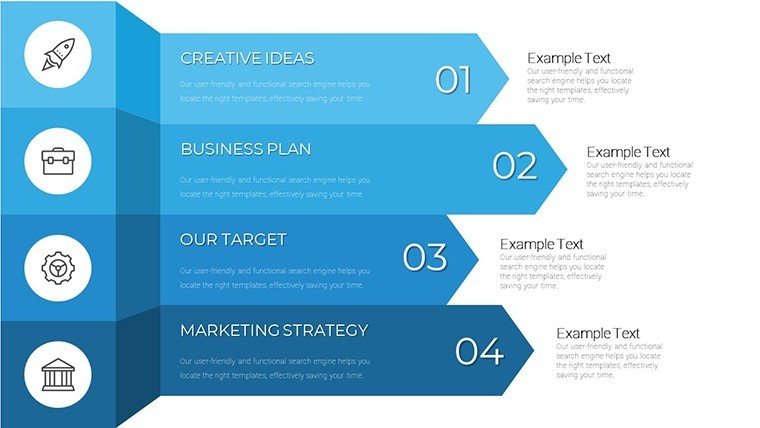
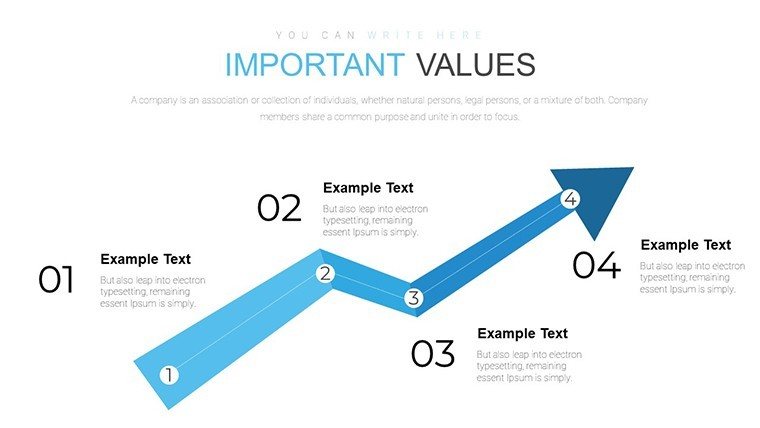
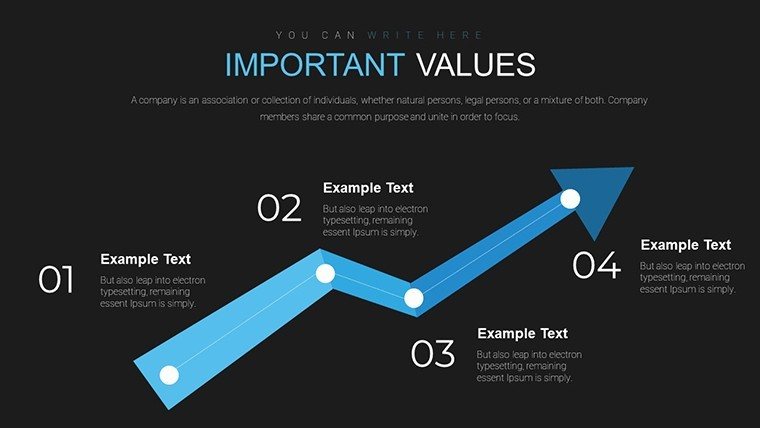
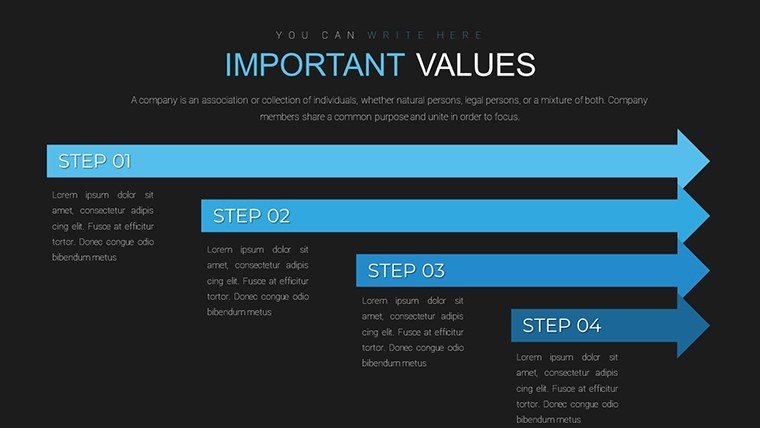
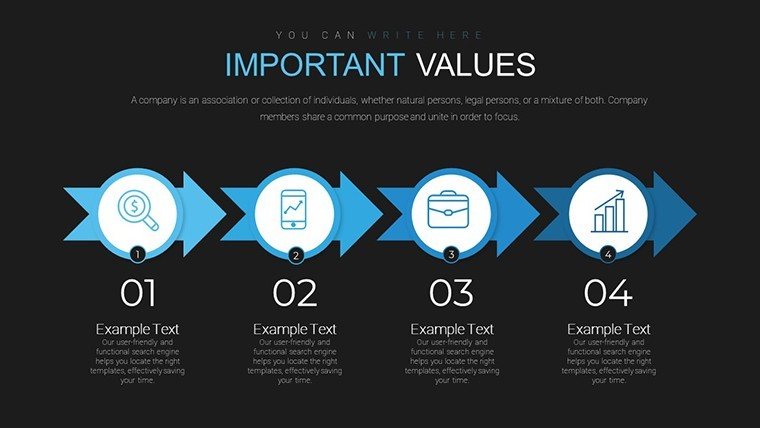
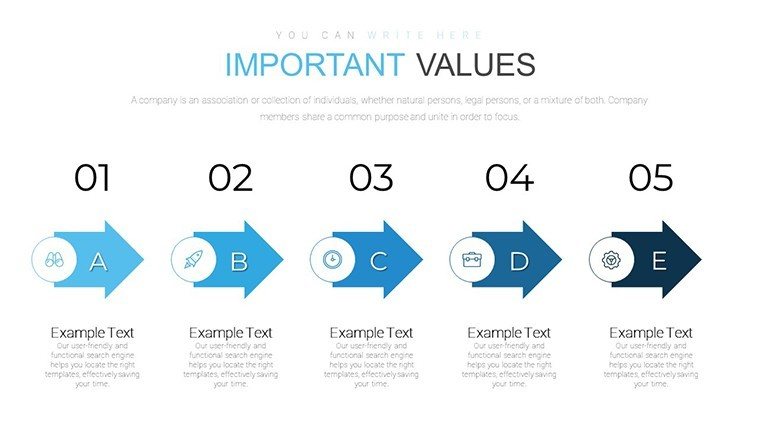
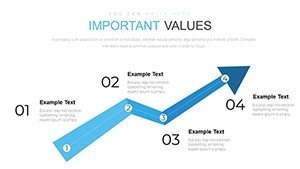
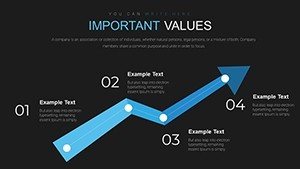
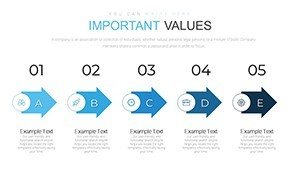
- Arrow Charts: Highlight progression in affiliate tiers or sales funnels.
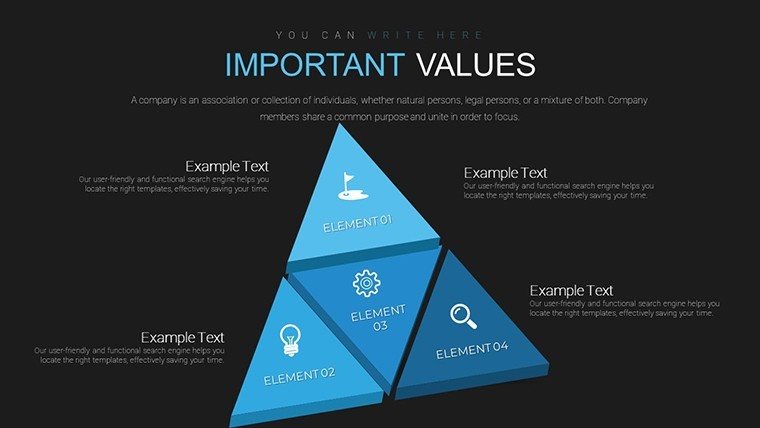
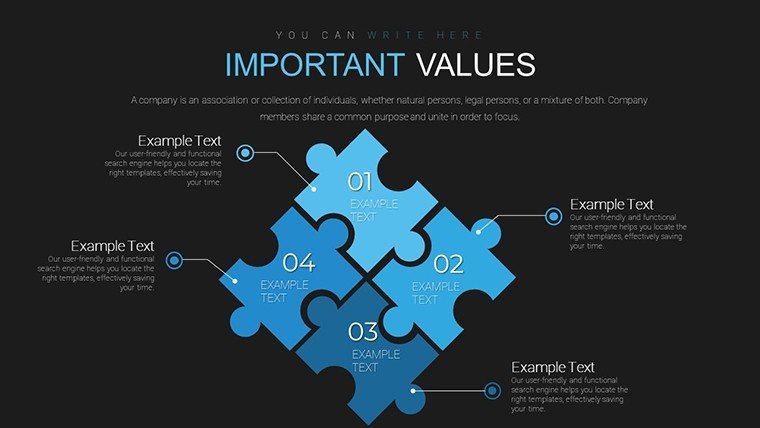
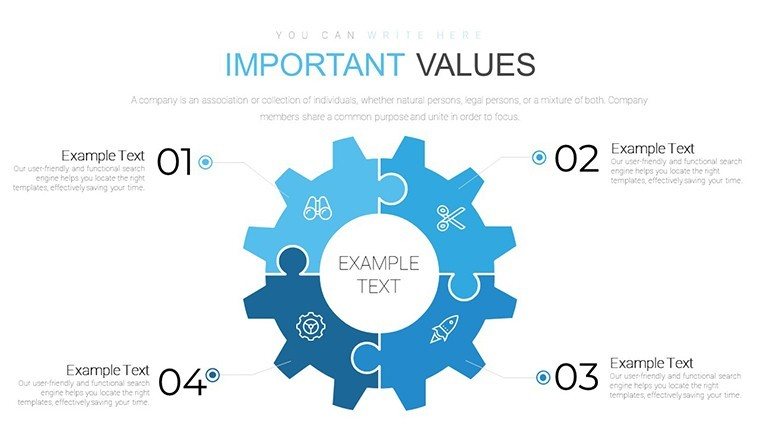
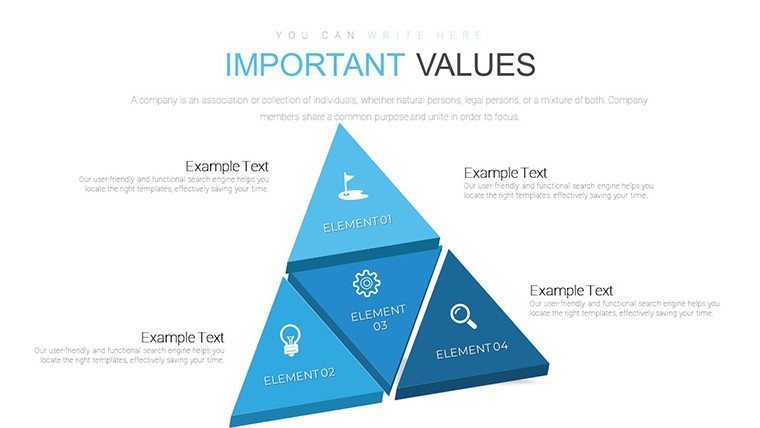
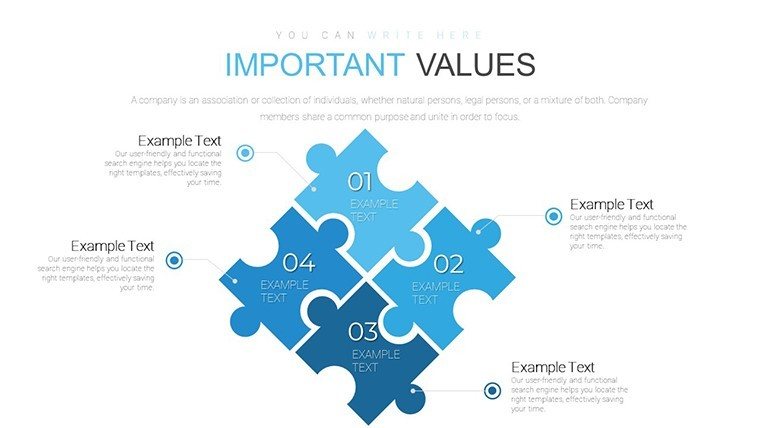
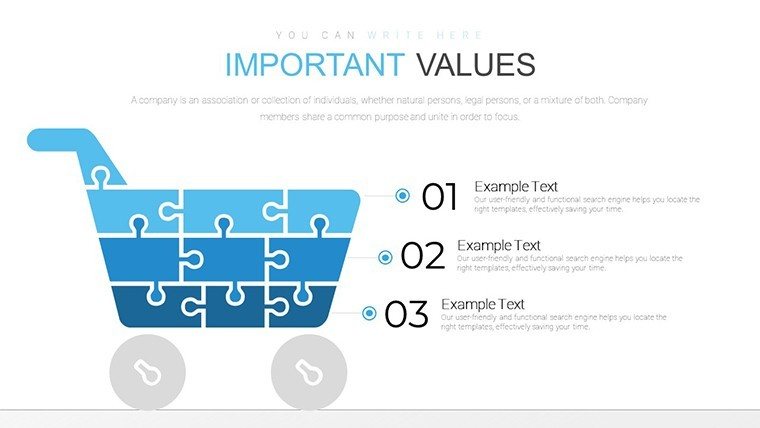
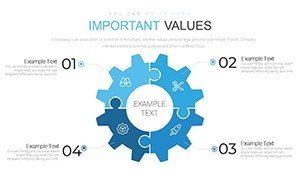
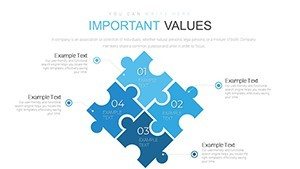
- Puzzle Layouts: Show how elements like SEO and social media fit together.
- Branding Tools: Adjust colors and fonts to reflect partner identities.
- Instant Access: Download and edit immediately for agile responses.
Targeted Use Cases for Maximum Impact
Affiliate marketers can present program overviews to recruits using arrow charts for step-by-step onboarding. Marketing teams collaborate on performance reviews with puzzle slides that break down multichannel contributions. Business professionals captivate in webinars with cycle graphs demonstrating sustainable growth models. Consider a case from a e-commerce brand: They utilized this template to report on a holiday campaign, using data graphs to show a 25% uplift in referrals, securing renewed partnerships. In training sessions, educators in digital marketing courses employ these slides to teach affiliate ethics and analytics, making concepts relatable through visual aids.
Building Your Affiliate Presentation Step by Step
- Define Objectives: Select slides based on goals, like cycle for strategy overviews.
- Input Data: Populate graphs with metrics from tools like Google Analytics.
- Customize Design: Align visuals with brand guidelines for cohesion.
- Enhance with Elements: Add icons or animations to emphasize key points.
- Rehearse Delivery: Practice transitions to ensure smooth flow.
This process integrates seamlessly with affiliate software like ShareASale, allowing data pulls for authentic presentations.
Superior to Generic Chart Options
Outshining basic PowerPoint charts, this template's specialized designs for affiliate contexts provide depth and relevance, saving time on custom builds. Feedback from users highlights its role in closing deals faster than text-based reports.
Expert Tips for Affiliate Success
Leverage storytelling by weaving narratives around data - start with problems, show solutions via charts. Use consistent metrics across slides for credibility. For global audiences, incorporate multilingual notes. A/B test slide variations to refine engagement.
Empower your affiliate efforts - acquire this template and chart a course to marketing mastery.
Frequently Asked Questions
- How customizable are the graphs for affiliate data?
- Fully editable, with options to input custom metrics and adjust visuals.
- Can it handle complex affiliate networks?
- Yes, puzzle and cycle layouts excel at depicting interconnected strategies.
- Is branding integration easy?
- Absolutely, with quick tools for color and font changes.
- What if I need to add more slides?
- Duplicate and modify existing ones effortlessly.
- Compatible with Mac PowerPoint?
- Yes, works across Windows and Mac versions.
- Are there examples for beginners?
- Slides include placeholders with tips for easy starts.