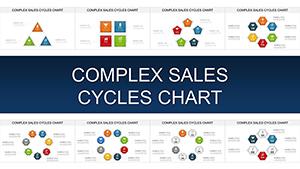
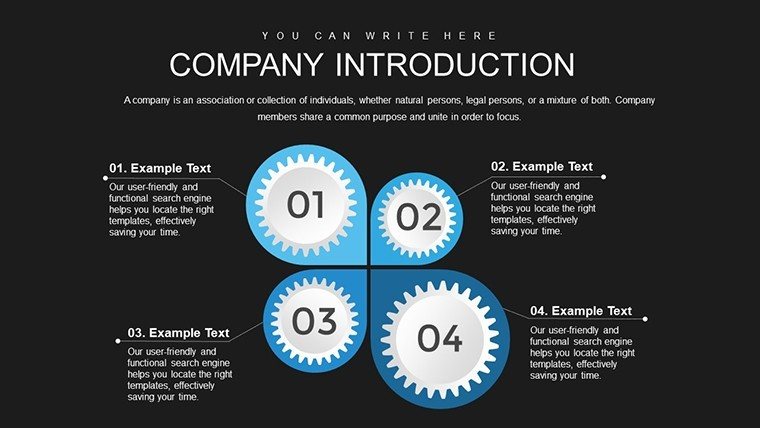
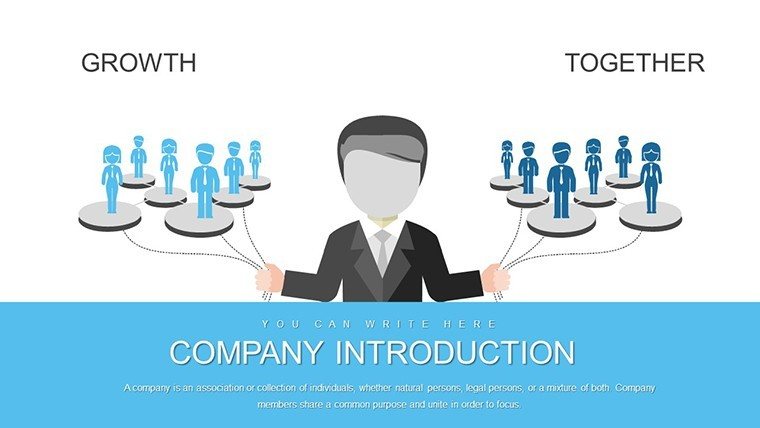
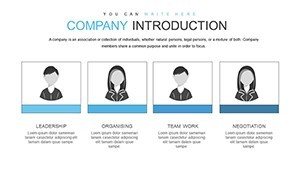
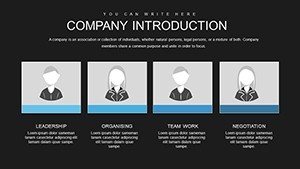
Company Introduction PowerPoint Charts Template: Craft Memorable Business Narratives


Type: PowerPoint Charts template
Category: Organizational
Sources Available: .pptx
Product ID: PC00717
Template incl.: 38 editable slides
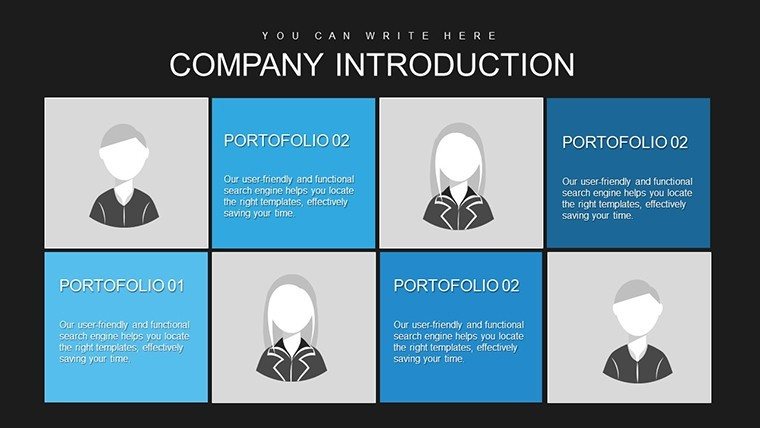
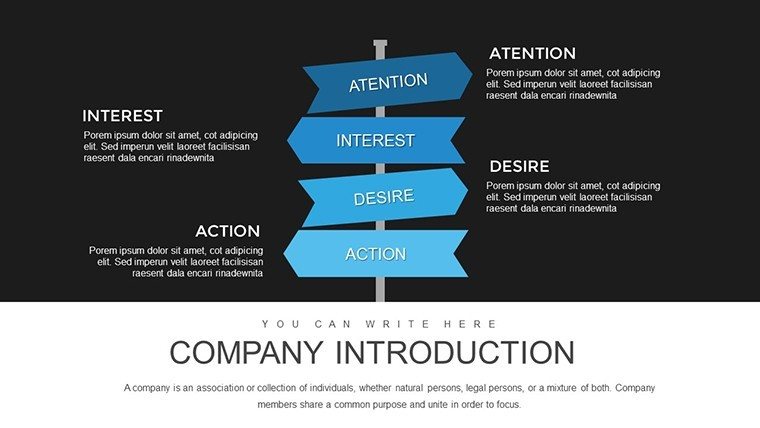
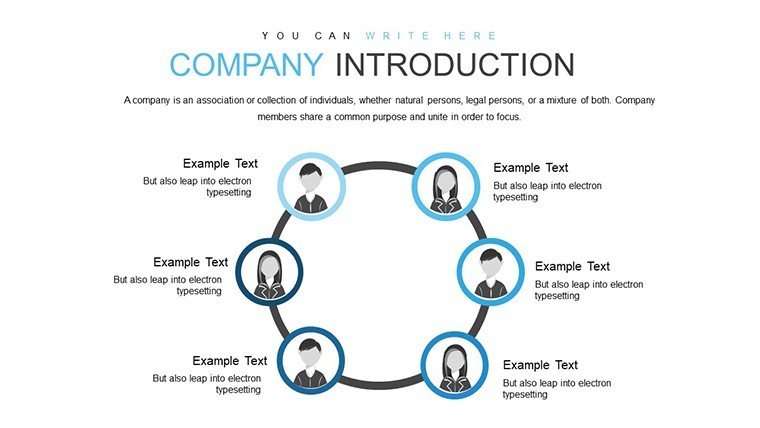
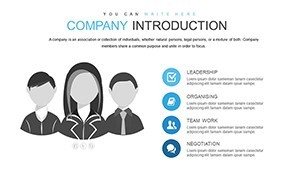
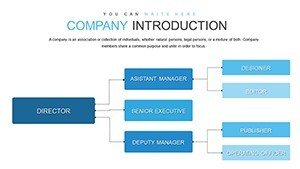
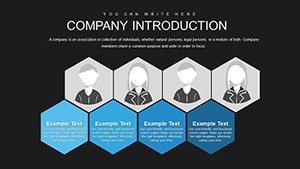
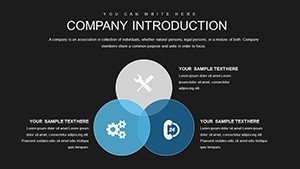
Launching a new venture or refreshing your corporate profile? The first impression counts, and our Company Introduction PowerPoint Charts Template ensures it's a powerful one. With 38 editable slides blending modern layouts and data-driven graphs, this tool empowers you to transform raw facts into engaging stories that captivate audiences. Designed for corporate leaders, startups, and consultants, it highlights your company's mission, achievements, and future vision through visuals that speak volumes. Say goodbye to bland overviews; instead, showcase revenue growth with dynamic bar charts or team structures with hierarchical diagrams, all customizable to echo your brand's essence. This template isn't just about presentation - it's about persuasion, helping you secure partnerships, attract talent, or win clients by making complex information accessible and inspiring. In a competitive landscape, where attention spans are short, these slides keep viewers hooked, turning passive listeners into active advocates for your business.
Elevate Your Corporate Storytelling
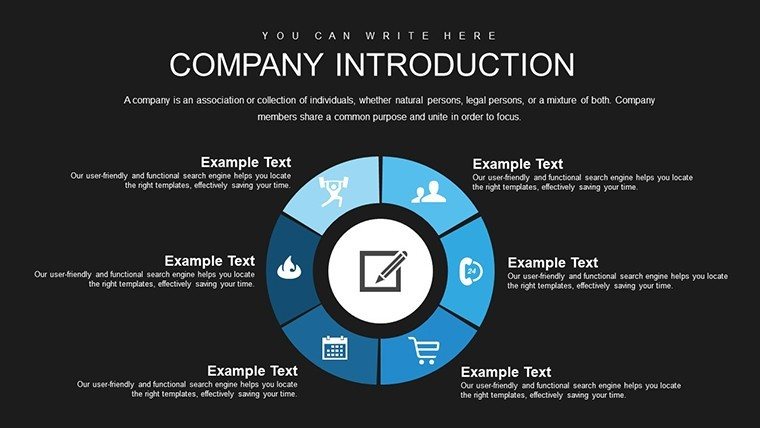
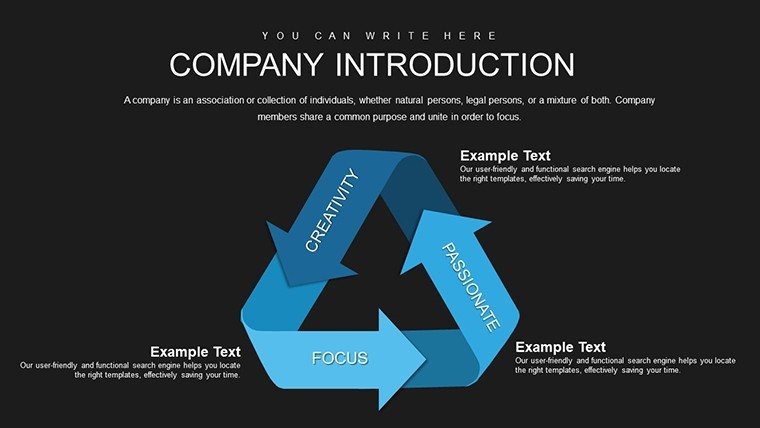
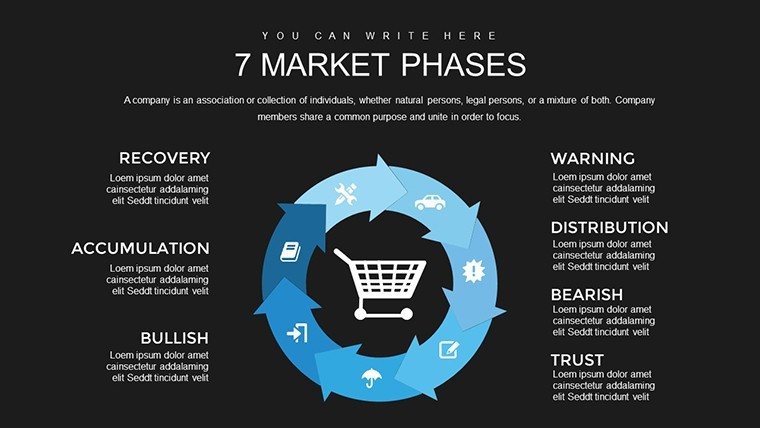
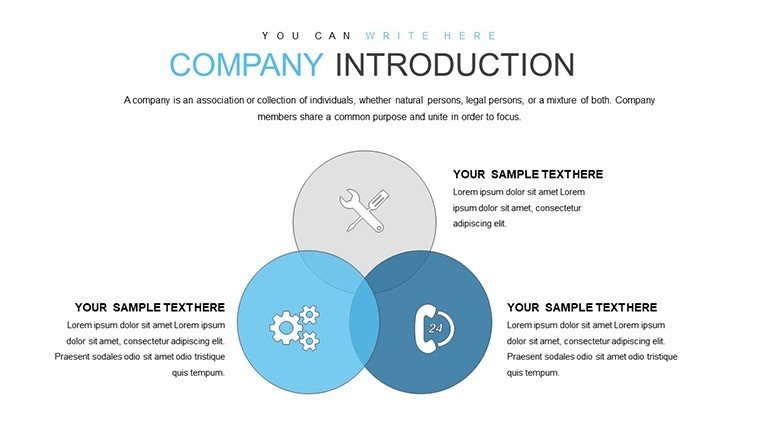
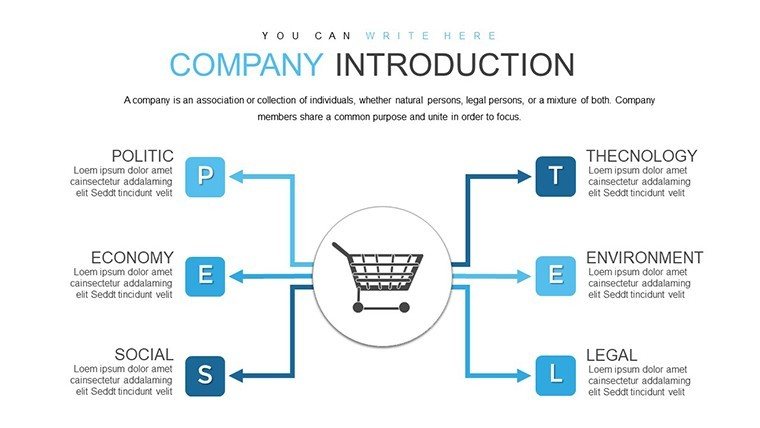
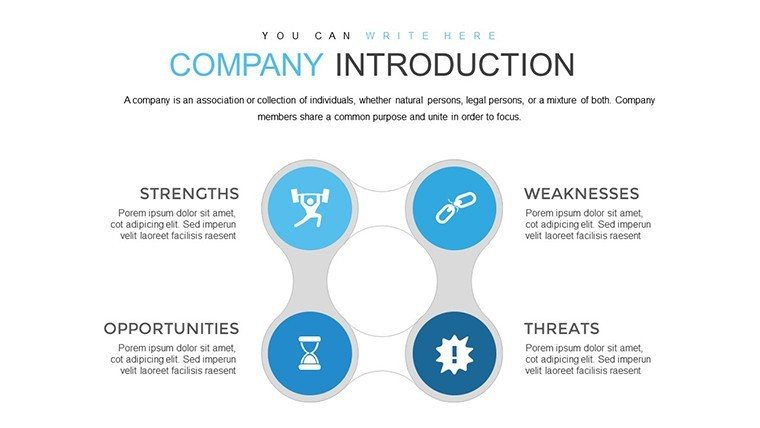
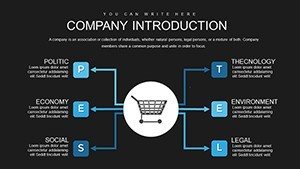
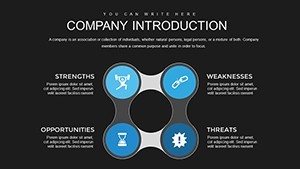
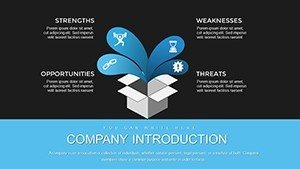
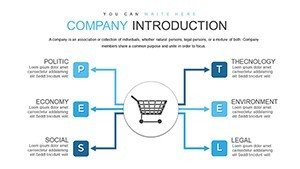
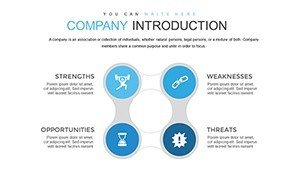
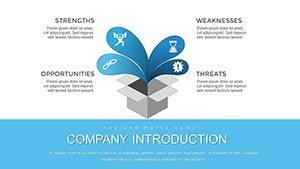
This template excels in weaving data into narratives, with slides dedicated to elements like mission statements, financial overviews, and market positioning. For instance, use radar charts to compare your strengths against industry benchmarks, drawing from frameworks like SWOT analysis for strategic depth. Professionals in high-stakes environments appreciate how it aligns with best practices from sources like Harvard Business Review, emphasizing clarity in communication.
Essential Features for Impactful Intros
- High-Quality Graphics: Crisp visuals that maintain quality across devices.
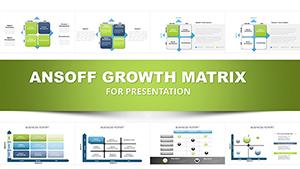
- Editable Graphs: Input your stats for real-time updates on metrics like sales or customer growth.
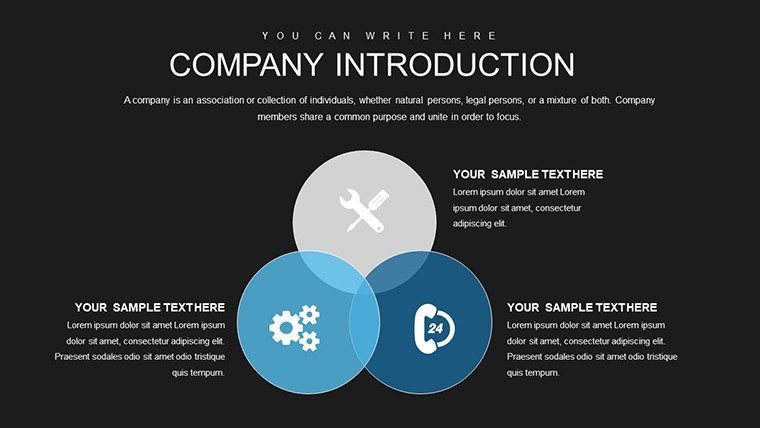
- Brand Customization: Alter themes to fit your identity, from fonts to color palettes.
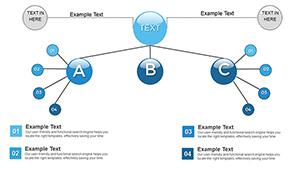
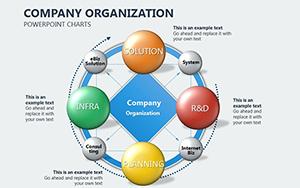
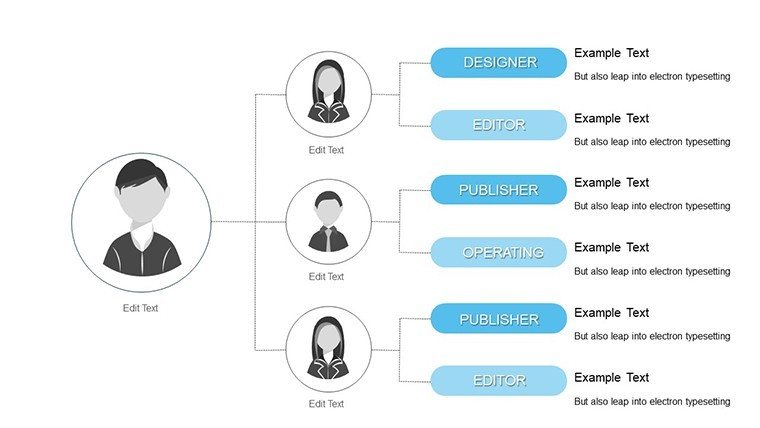
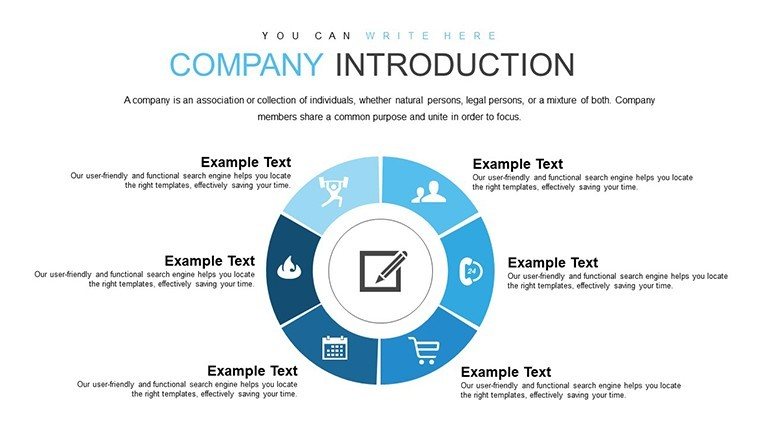
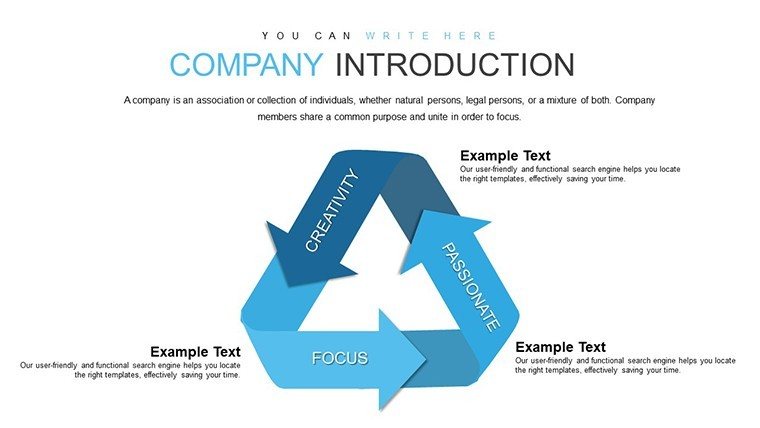
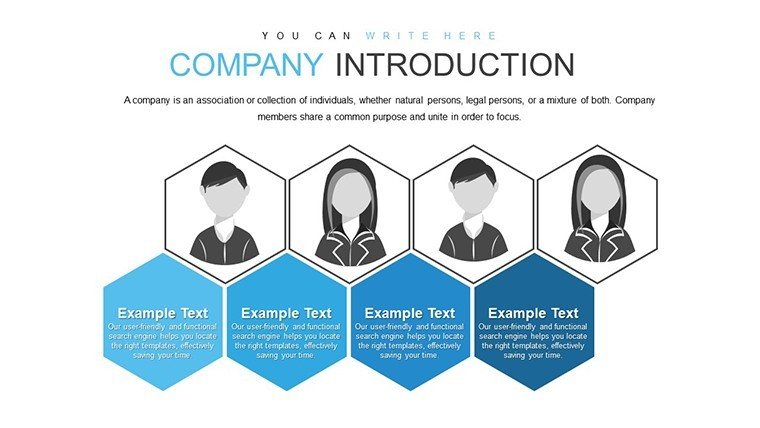
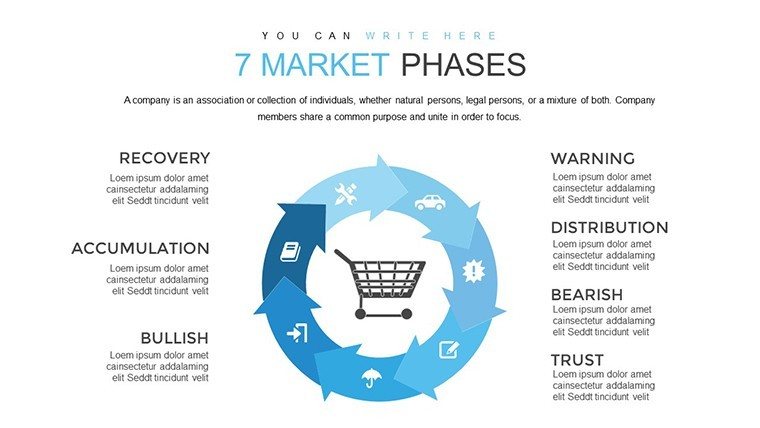
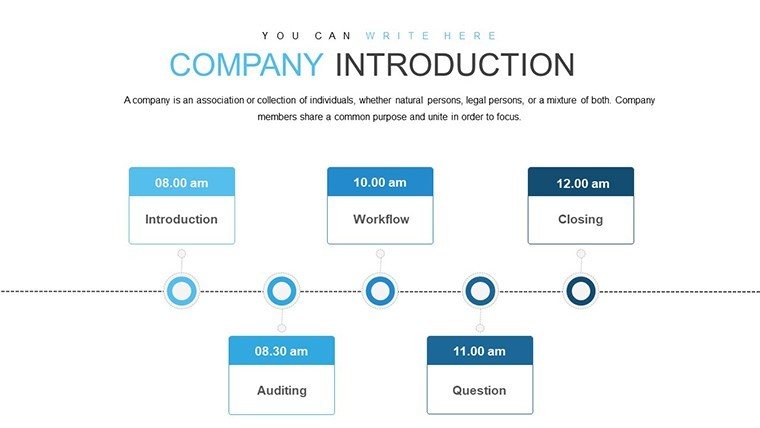
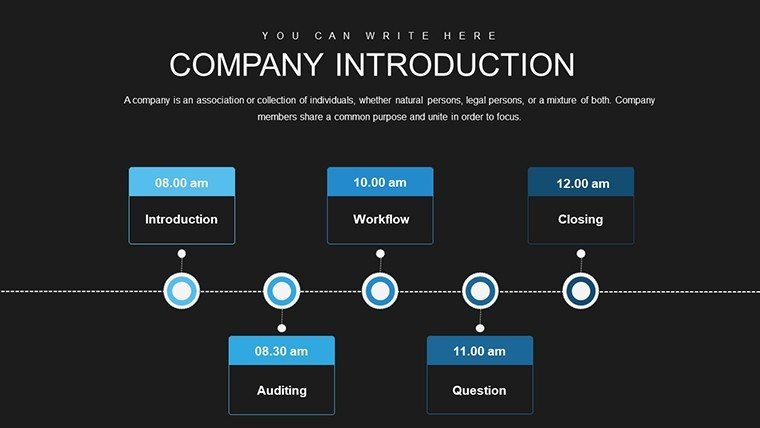
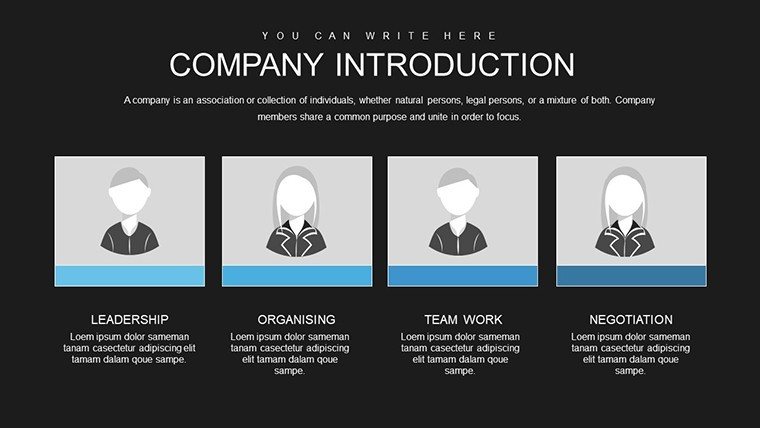
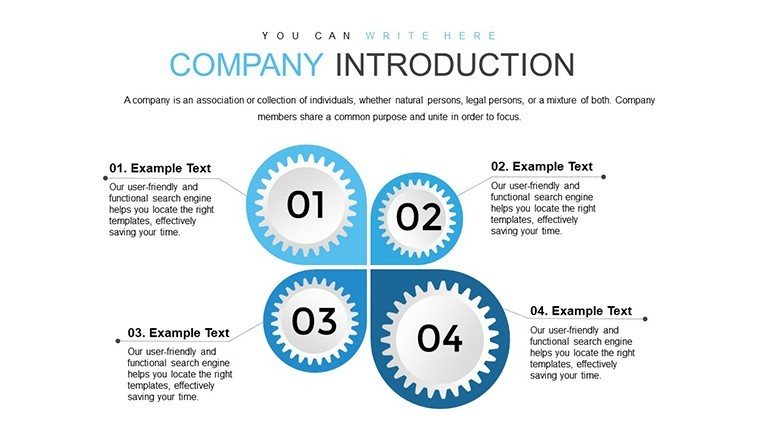
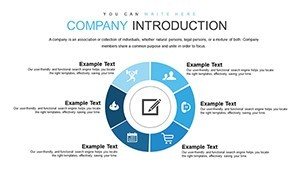
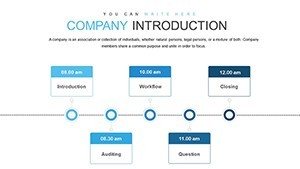
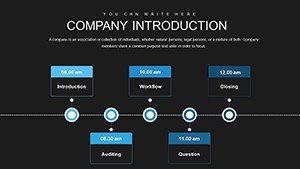
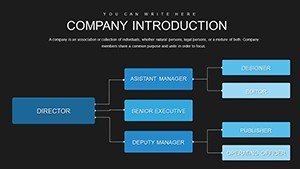
- Versatile Layouts: Mix of timelines, org charts, and infographics for comprehensive coverage.
- Instant Accessibility: Download in .pptx for immediate use in PowerPoint or alternatives.
These draw on design principles that enhance user experience, ensuring your intro stands out in crowded pitches.
Use Cases: From Startups to Corporates
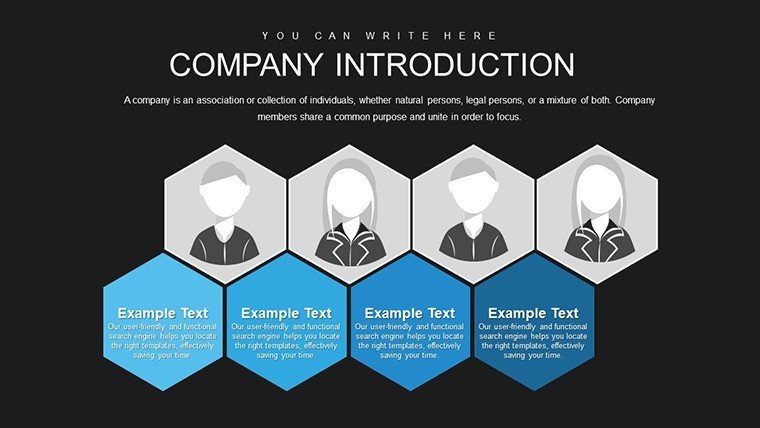
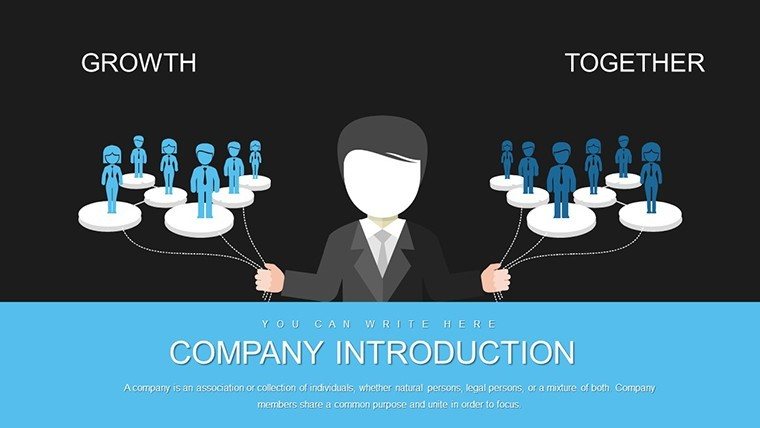
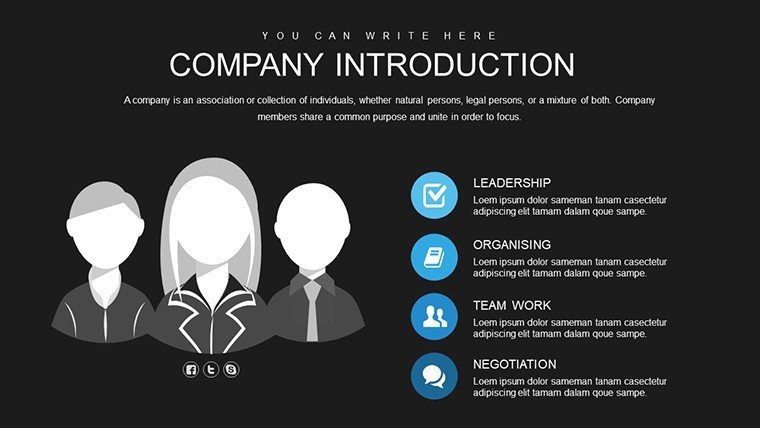
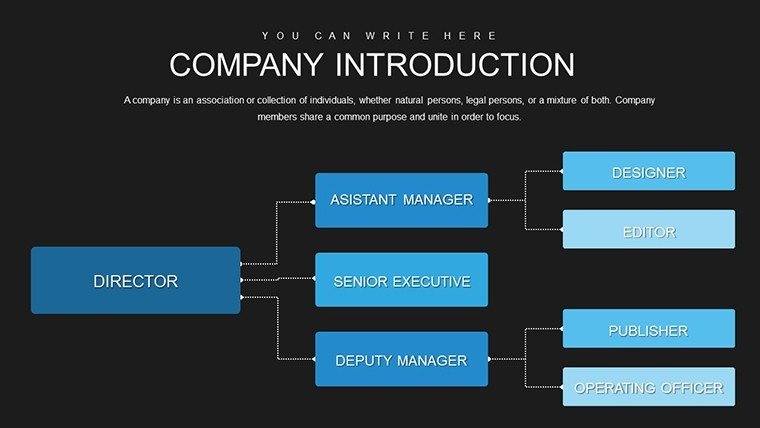
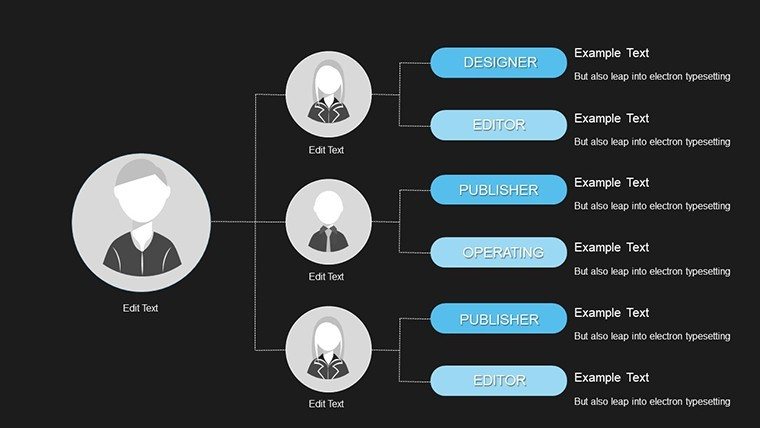
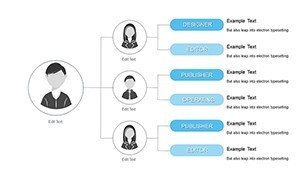
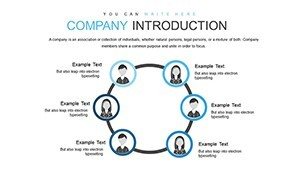
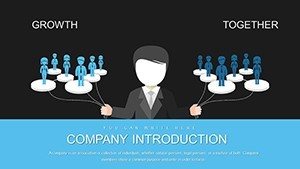
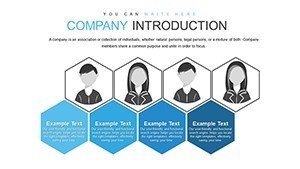
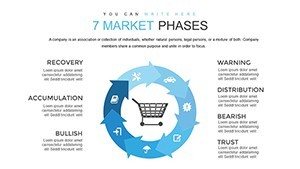
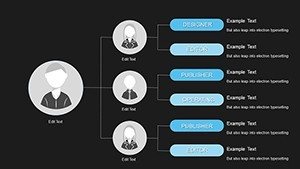
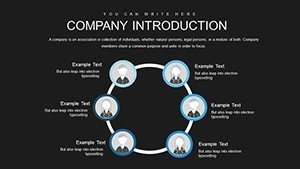
Picture a startup founder at a venture capital meetup: They open with a slide outlining company origins via a timeline chart, then pivot to market analysis with pie graphs showing share potential. For established firms, HR teams might use it for onboarding, illustrating department interconnections with network diagrams that clarify roles.
In consulting, adapt for client proposals, integrating bar charts of past successes to build credibility. A real-world parallel: Companies like Tesla use similar visuals in investor decks to narrate innovation journeys, blending data with aspiration.
Guided Customization Process
- Define Your Story Arc: Outline key sections like history, services, and projections.
- Populate with Data: Fill graphs with accurate figures, sourcing from reliable analytics.
- Refine Aesthetics: Adjust for visual harmony, perhaps using monochromatic schemes for professionalism.
- Test Engagement: Run through with colleagues for feedback on flow.
- Deploy Strategically: Share via links or embeds for wider reach.
This mirrors agile project management, allowing iterative improvements for polished results.
Outperforming Generic Alternatives
Unlike default PowerPoint templates that feel dated, this offers contemporary designs informed by UX trends, providing a edge in visual appeal. It saves time on layout creation, letting you concentrate on content. With elements like "business profile visuals" and "editable company overviews," it boosts internal searchability too.
Insights for Superior Delivery
Opt for storytelling over data dumps - use charts to support anecdotes, like growth spikes tied to milestones. Employ subtle animations to reveal insights progressively. For trustworthiness, cite sources within footnotes, akin to academic business papers.
Educators can repurpose for case studies, dissecting corporate evolutions. Consultants find it invaluable for tailoring pitches to client needs.
Launch Your Story with Confidence
Embrace the Company Introduction PowerPoint Charts Template to make every intro a stepping stone to success. Download and start crafting narratives that resonate and convert.
Frequently Asked Questions
Are the slides fully editable?
Yes, customize every aspect including data, colors, and layouts.
Suitable for non-business uses?
Certainly, adapt for educational or non-profit introductions.
What makes it data-driven?
Incorporates graphs for statistical representation, turning numbers into visuals.
Instant download available?
Yes, access immediately after purchase.
How many slides?
38 editable slides for thorough coverage.
Compatible with Mac?
Works on any PowerPoint-supporting platform.