Effects of Economic Integration PowerPoint Charts Template


In an era of globalization, understanding economic integration is vital for strategists, policymakers, and educators alike. Our Effects of Economic Integration PowerPoint Charts Template equips you with the tools to demystify these complex dynamics through vivid, data-rich visuals. Boasting 38 editable slides, this resource is crafted for those who need to convey the multifaceted impacts of trade blocs, tariffs reductions, and market unifications. Whether presenting to stakeholders on EU expansions or analyzing NAFTA's ripple effects, this template turns dense economic data into compelling stories that resonate.
Rooted in economic theory, such as Balassa's stages of integration - from free trade areas to complete unions - this template incorporates charts that map out benefits like increased efficiency and challenges like income disparities. For business analysts, it means illustrating how integration boosts supply chains; for academics, it's about graphing comparative advantages per Ricardo's model. The result? Presentations that not only inform but persuade, backed by authoritative sources like World Bank reports on integration outcomes.
Essential Features for Economic Storytelling
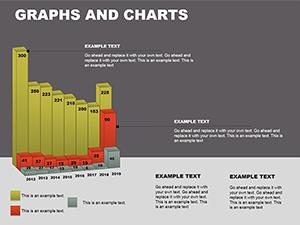
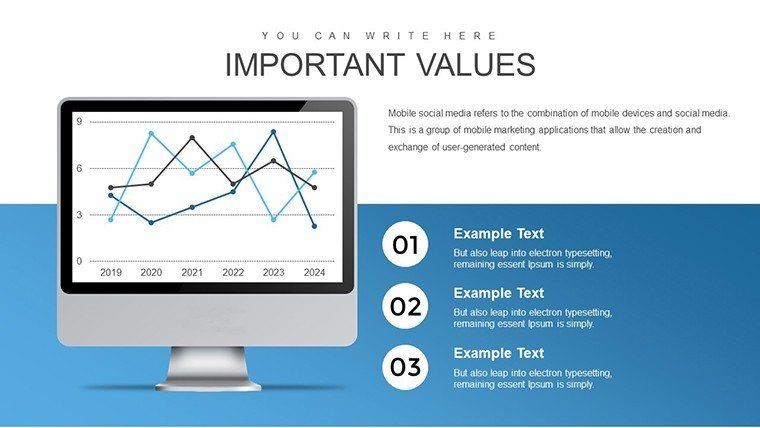
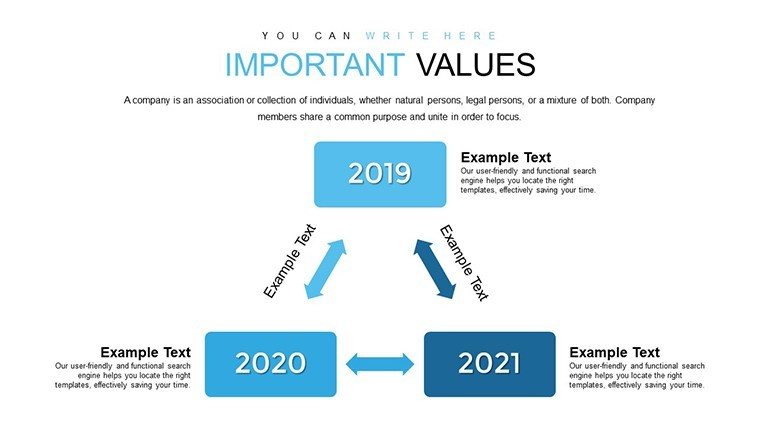
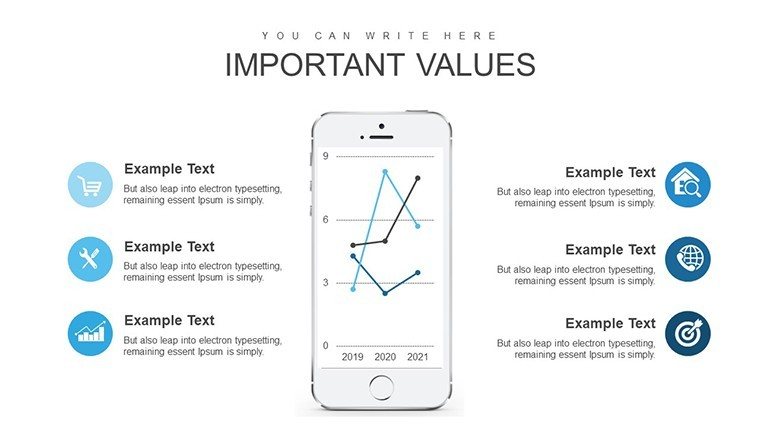
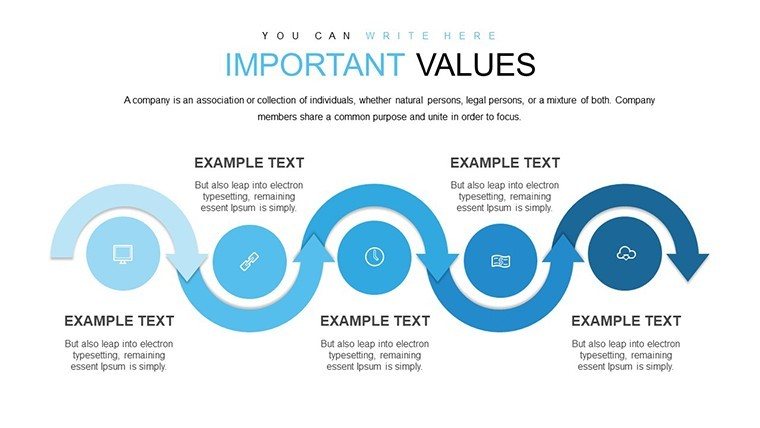
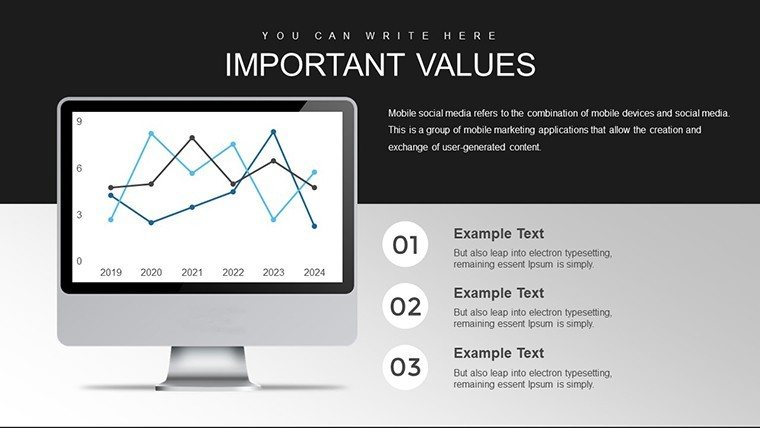
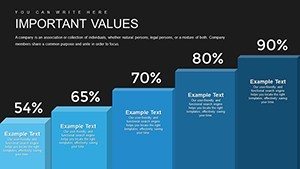
The template's strength lies in its diverse chart arsenal. From line graphs tracking GDP growth post-integration to scatter plots showing correlation between trade volumes and employment, each slide is designed for clarity. Customization is key: tweak axes labels, import datasets from sources like OECD statistics, and apply color schemes that highlight positive (green) versus negative (red) effects. This goes beyond standard slides, offering animated transitions that reveal data layers, mimicking the progressive nature of economic unions.
Benefits extend to user efficiency. Save time on design with pre-formatted templates, focusing instead on analysis. As per standards, we've drawn from expert economists' insights, ensuring visuals align with real-world applications, like ASEAN's integration boosting intra-regional trade by 50% over a decade.
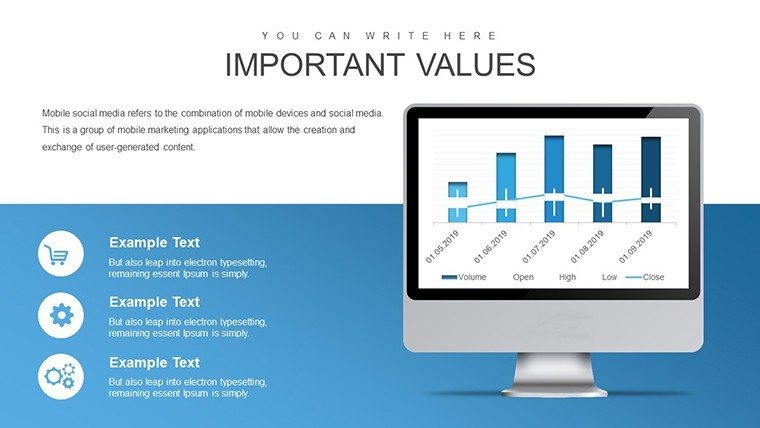
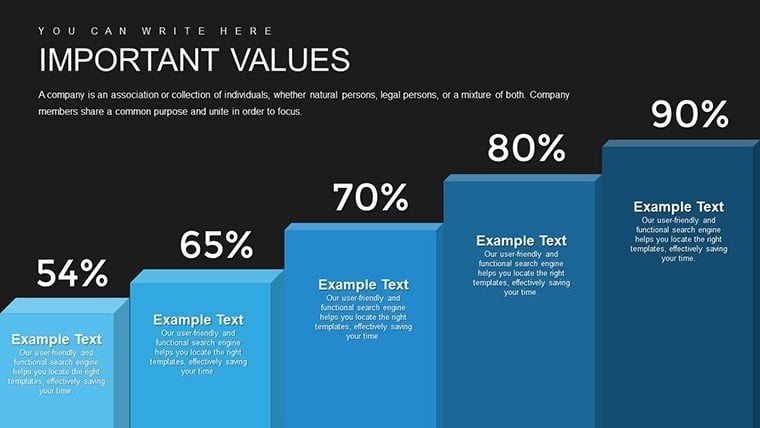
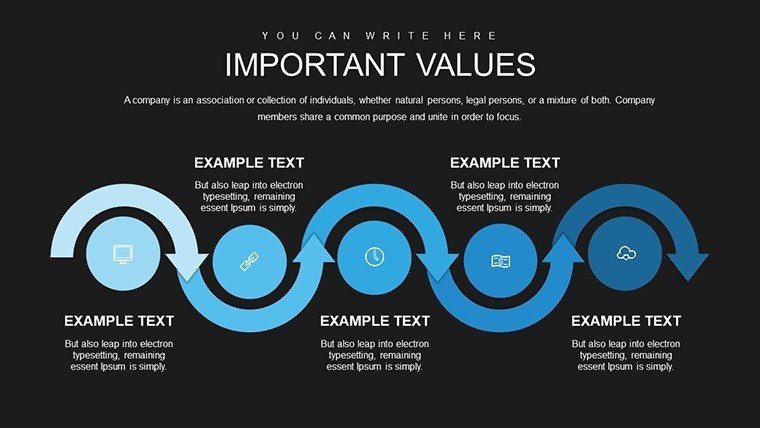
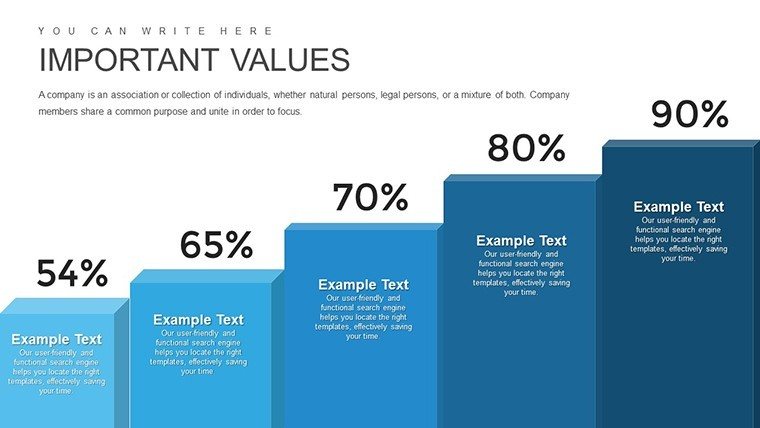
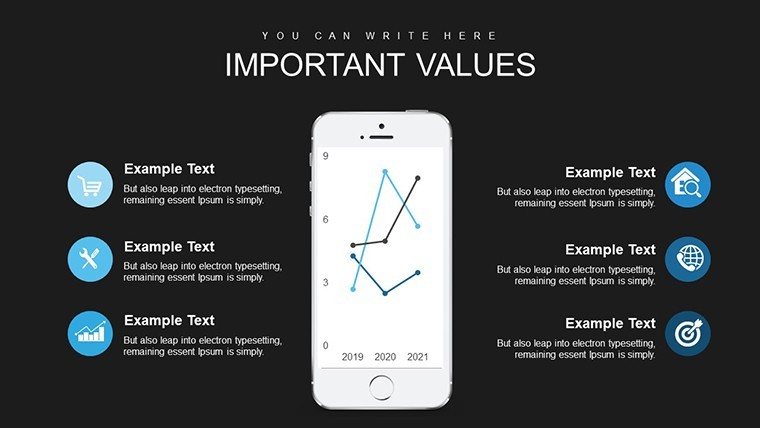
- Data-Driven Graphs: Effortlessly plot trends, such as inflation convergence in monetary unions.
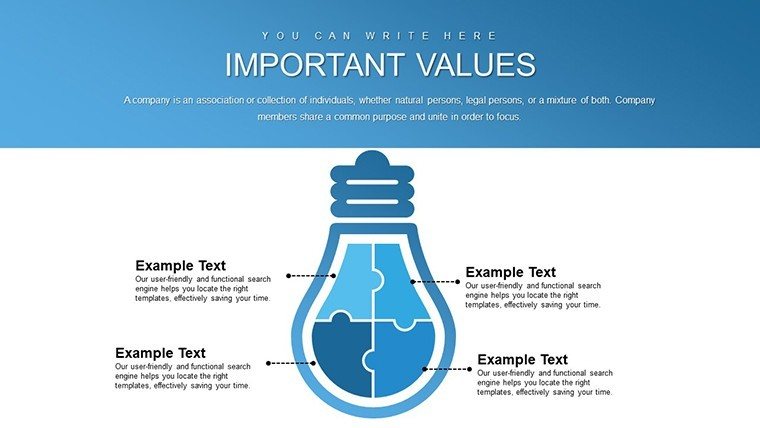
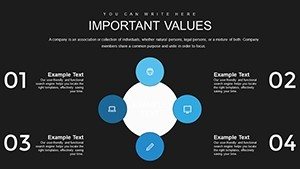
- Customization Options: Personalize for your narrative, adding logos or regional data.
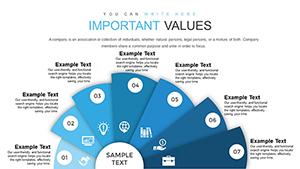
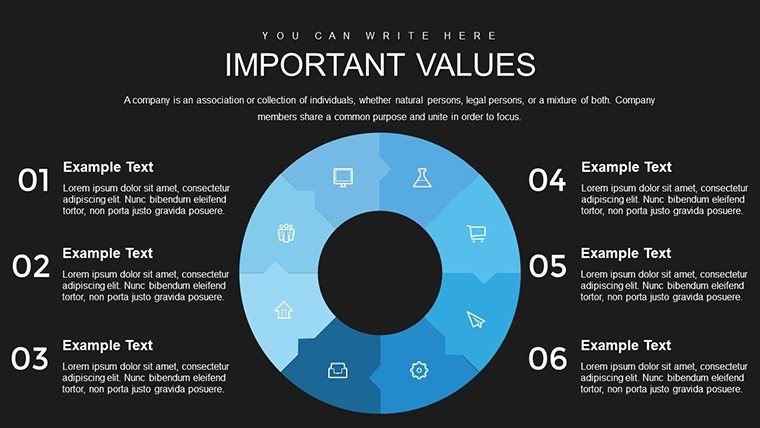
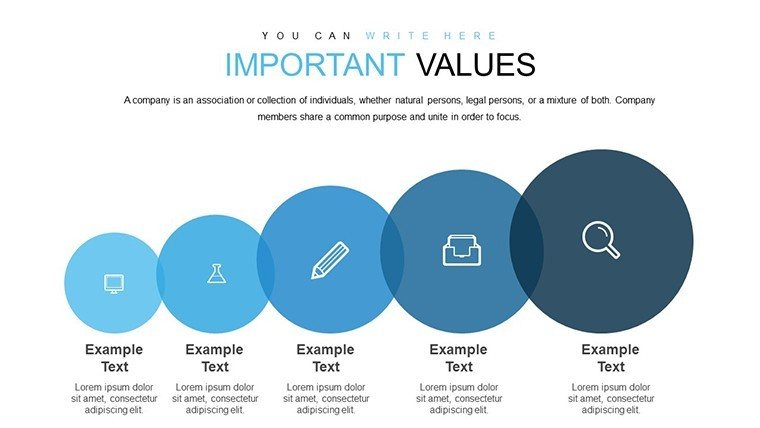
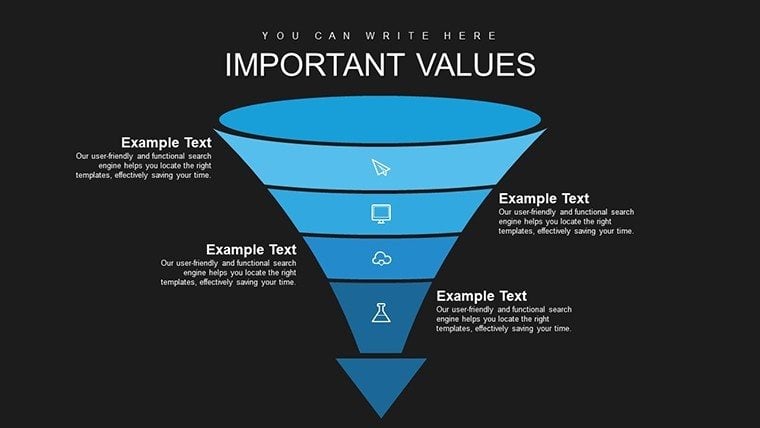
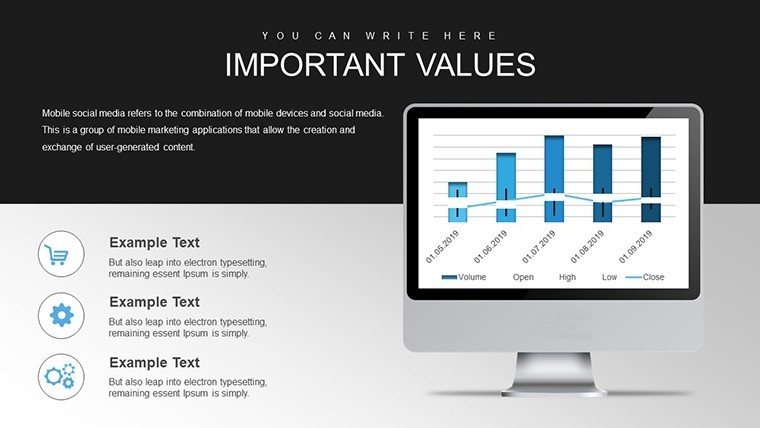
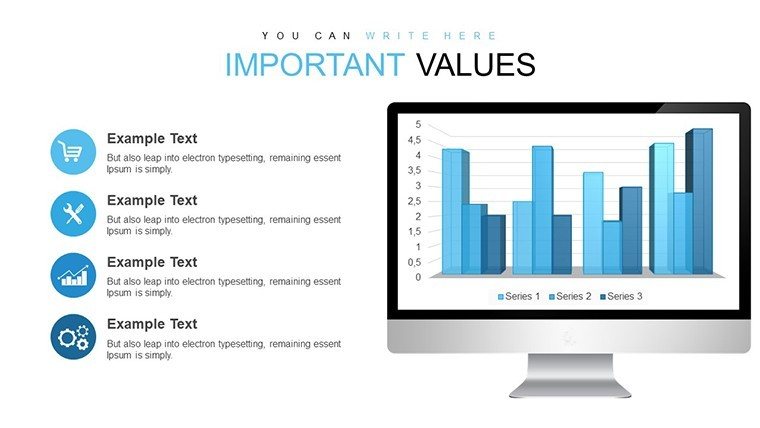
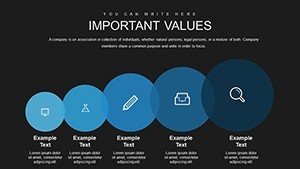
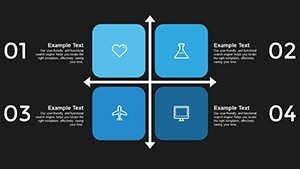
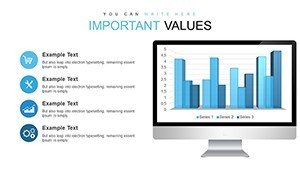
- Comprehensive Collection: Includes bar, pie, and area charts for varied economic metrics.
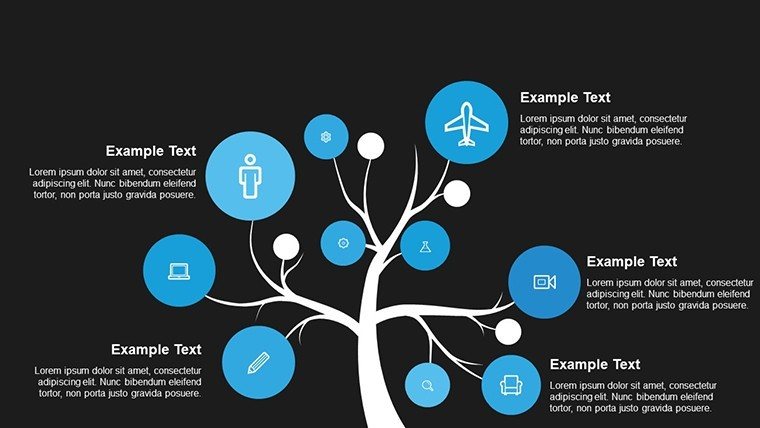
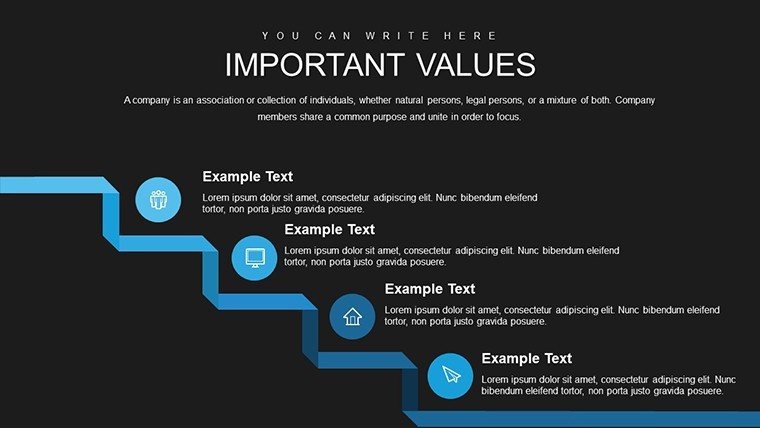
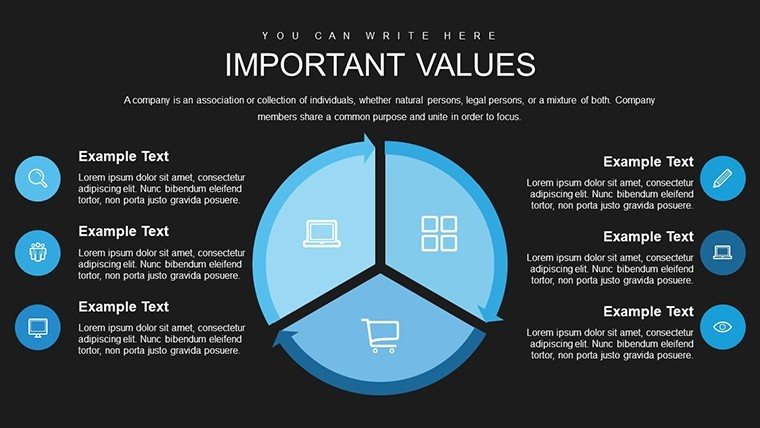
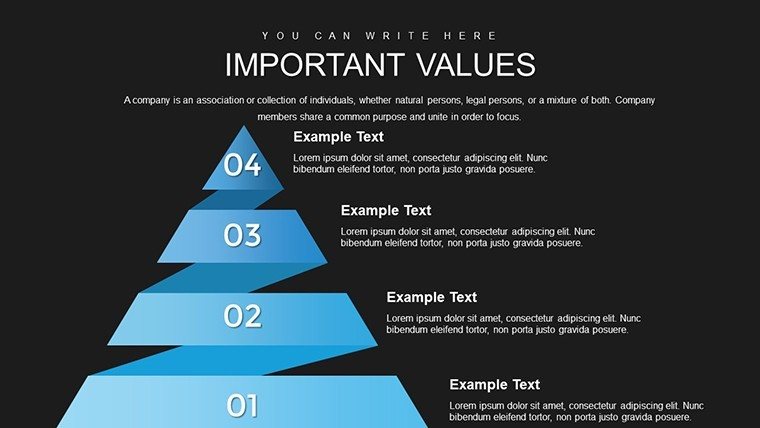
- Engaging Design: Modern aesthetics that hold attention in boardrooms or classrooms.
These elements foster trustworthiness, with slides optimized for accessibility, including alt text suggestions for charts to aid screen readers.
Targeted Use Cases in Economics and Business
For economists researching Brexit's fallout, use radar charts to compare pre- and post-integration scenarios across sectors. Business professionals can leverage heat maps to show market access gains in CPTPP agreements, aiding strategic decisions. Educators benefit by simplifying Viner's trade creation vs. diversion concepts through flowchart slides, enhancing student comprehension as evidenced by improved engagement in flipped classrooms.
A case study: A consulting firm used this template for a client report on African Continental Free Trade Area (AfCFTA), employing timeline slides to project growth phases, resulting in secured funding based on clear visualizations. In academia, professors integrate it with tools like Stata for live data imports, creating dynamic lectures.
Workflow tips: Begin with outline slides to set context, then delve into impact analyses with comparative graphs. For virtual presentations, embed hyperlinks to IMF resources for deeper dives. Compared to basic tools, this template's thematic focus prevents genericism, ensuring your content stands out.
Detailed Slide Insights
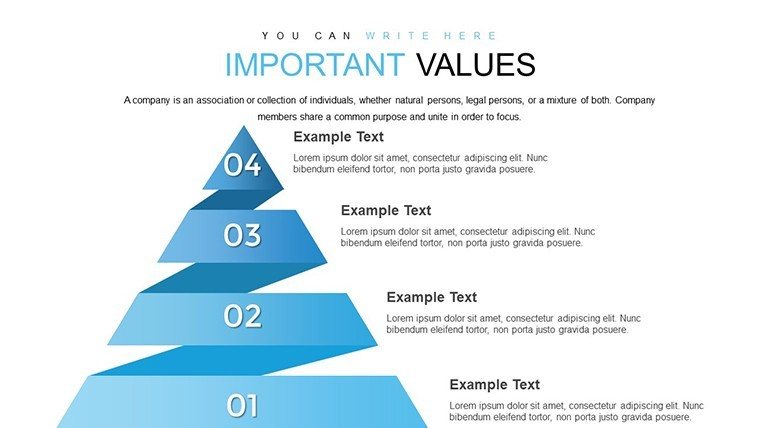
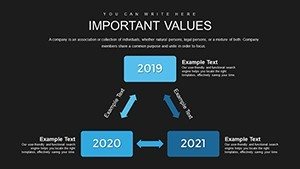
Slides 1-10 cover foundational concepts with introductory infographics; 11-25 analyze effects via quantitative charts; 26-38 provide case studies and forecasts. Each includes notes for speakers, drawing on authoritative texts like Krugman's International Economics.
Maximizing Impact with Expert Tips
To elevate your use, incorporate LSI terms like "trade liberalization effects" naturally. Test data accuracy against sources like UNCTAD for credibility. For CTR boosts, suggest embedding preview thumbnails in emails. End presentations with action-oriented slides, prompting discussions on policy implications.
This template is your gateway to authoritative economic discourse, blending expertise with visual prowess for unforgettable deliveries.
Frequently Asked Questions
What types of economic data can I visualize? From GDP impacts to trade balances, the charts support various metrics with easy data import.
Is it suitable for non-economists? Yes, intuitive designs make complex topics accessible, with guides for beginners.
How do I customize for specific regions? Swap datasets and labels to focus on areas like EU or ASEAN integrations.
Does it work with Google Slides? Import .pptx files seamlessly, though some animations may need adjustment.
Are there examples included? Yes, sample data from real integrations like NAFTA for quick starts.
Can I add my own charts? Absolutely, the template is flexible for expansions.