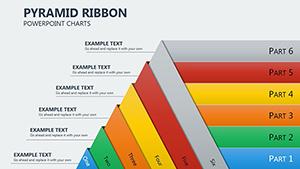
Ribbon Interconnections PowerPoint Charts: Connect Ideas Seamlessly


Type: PowerPoint Charts template
Category: Cycle
Sources Available: .pptx
Product ID: PC00693
Template incl.: 20 editable slides
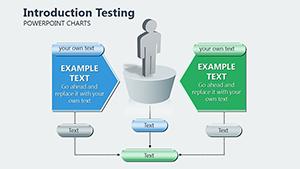
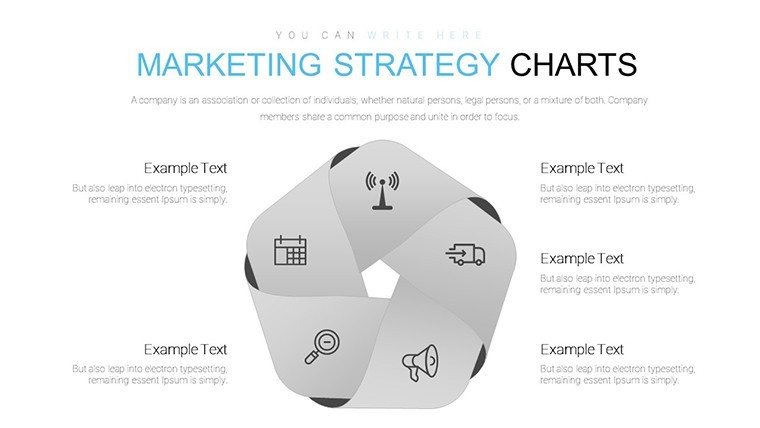
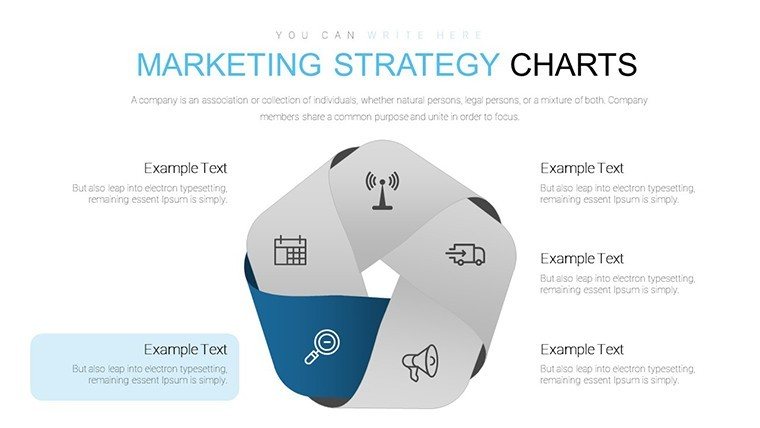
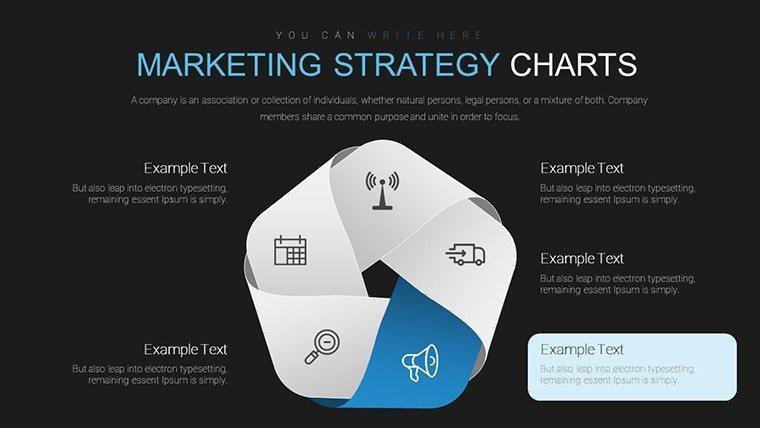
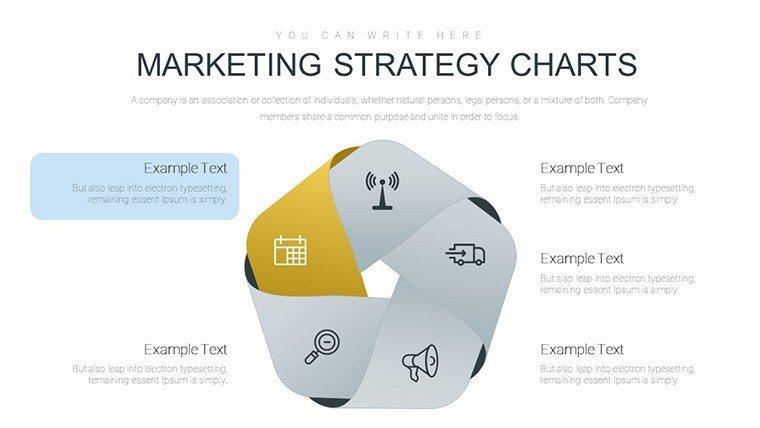
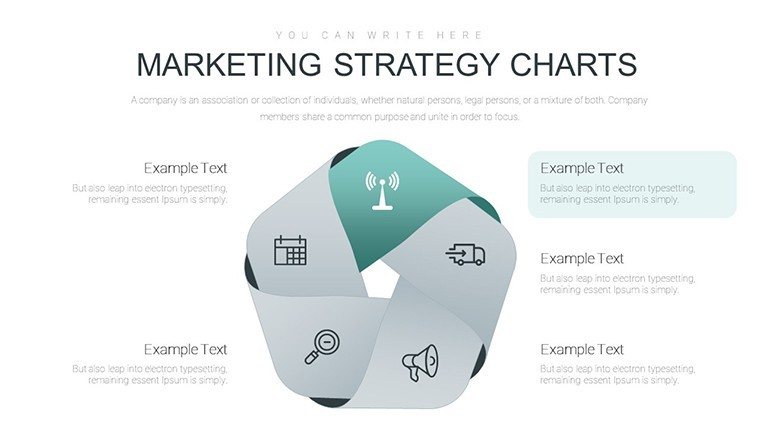
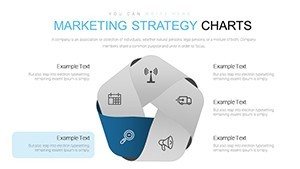
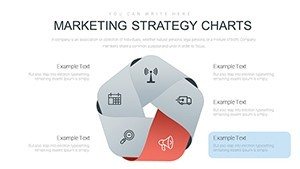
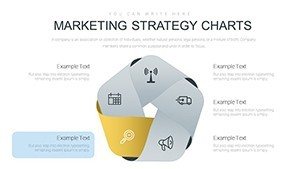
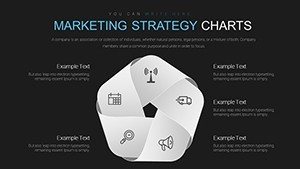
In an interconnected world, presenting relationships between ideas shouldn't feel disjointed. Our Ribbon Interconnections PowerPoint Charts Template bridges that gap with 20 editable slides, crafted to showcase processes, hierarchies, and data flows in a visually cohesive manner. Ideal for project managers, marketers, and educators, this template turns intricate connections into elegant ribbons that guide your audience through your narrative effortlessly.
Think of mapping a customer journey: Ribbons weave through stages, highlighting touchpoints with intuitive icons. This design, inspired by user experience principles from the Interaction Design Foundation, ensures your message flows naturally, enhancing comprehension and retention.
Standout Features for Visual Mastery
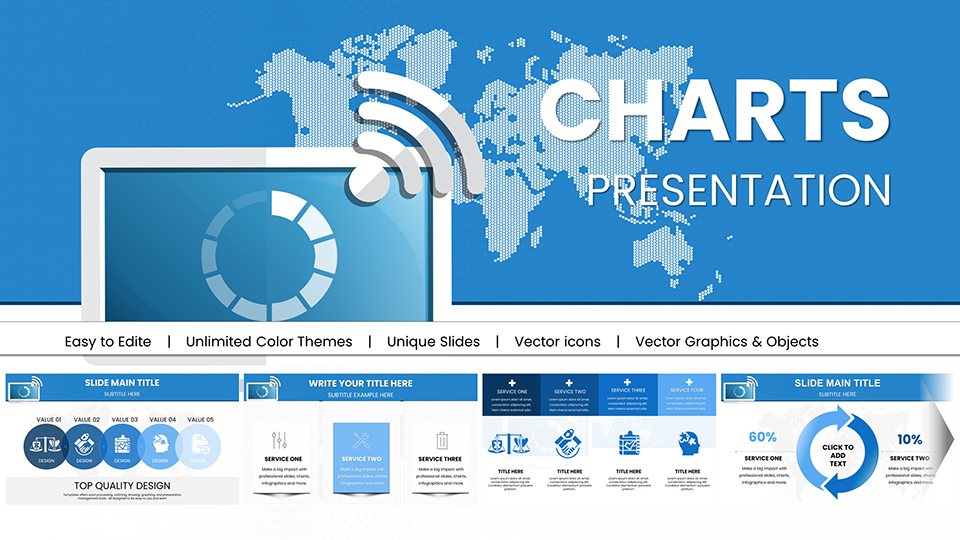
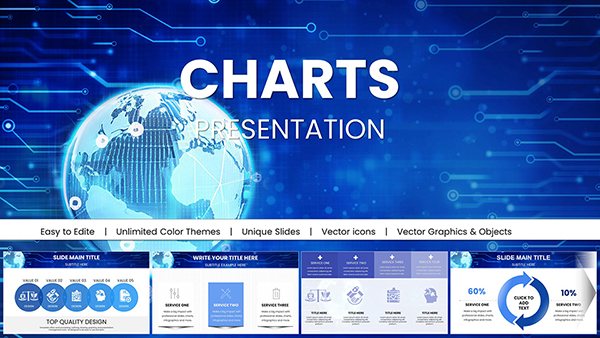
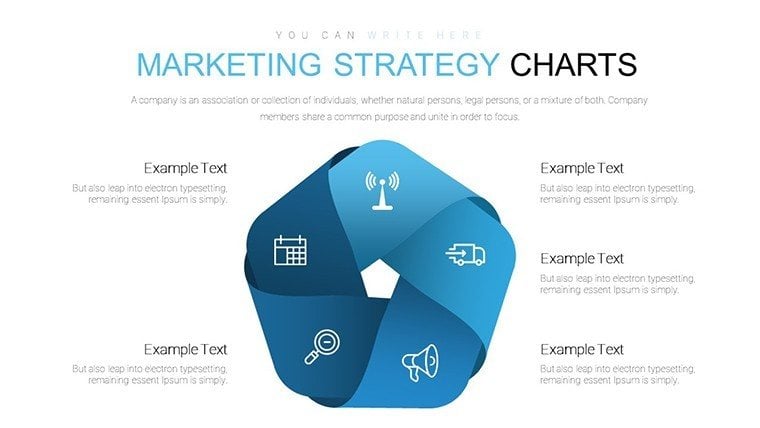
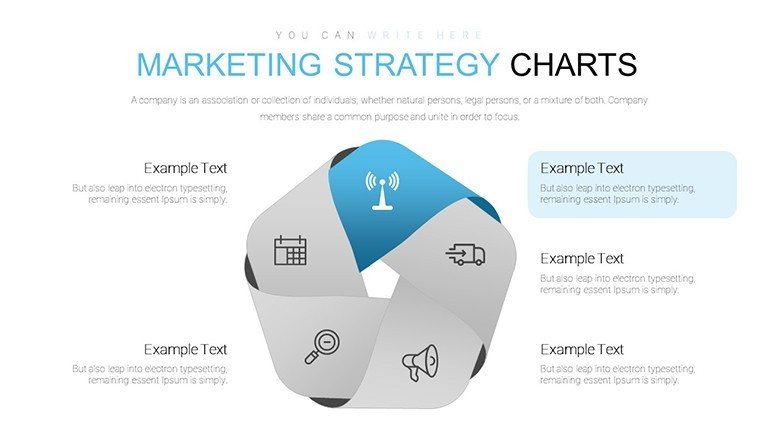
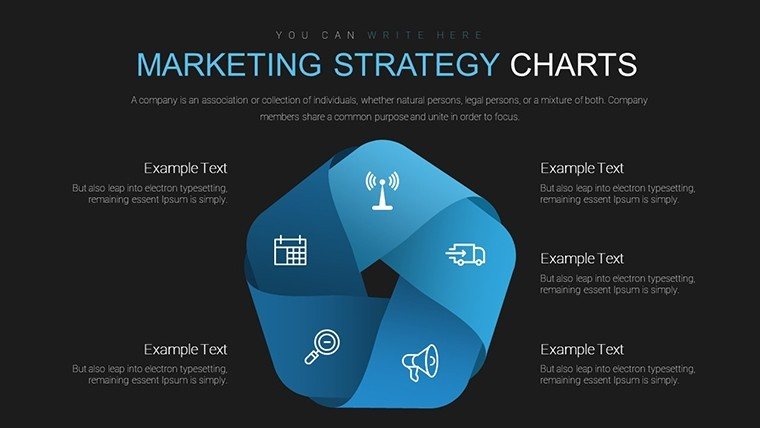
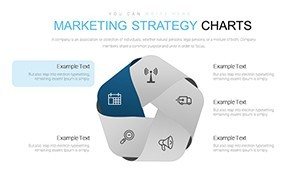
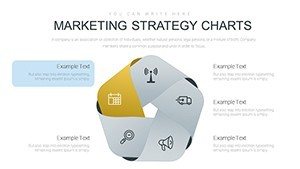
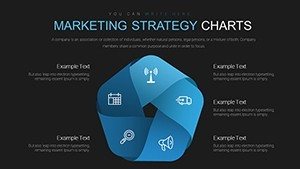
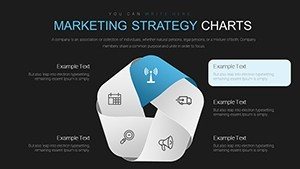
The template's vector-based graphics guarantee crisp visuals at any scale, from laptops to projectors. Customize ribbons with your colors, shapes, and text - no design degree needed. This ease of use democratizes professional presentations, aligning with agile methodologies where quick iterations are key.
Versatility is baked in: Use for corporate reports detailing workflow efficiencies or academic lectures on system theories. A marketing agency, for instance, employed ribbon diagrams to illustrate campaign funnels, resulting in clearer client approvals and faster launches.
Advantages in Professional Settings
Project managers benefit from slides depicting task dependencies, reducing miscommunications in teams. Compared to static charts, these dynamic interconnections foster better collaboration, as per Project Management Institute (PMI) guidelines.
- Engaging Designs: Modern styles that captivate without overwhelming.
- Time-Saving: Pre-made elements accelerate creation.
- Scalability: High-quality for any presentation size.
Marketing and Educational Applications
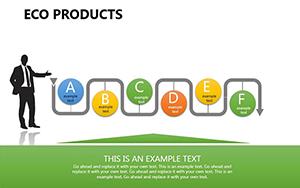
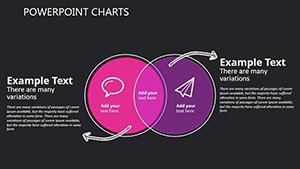
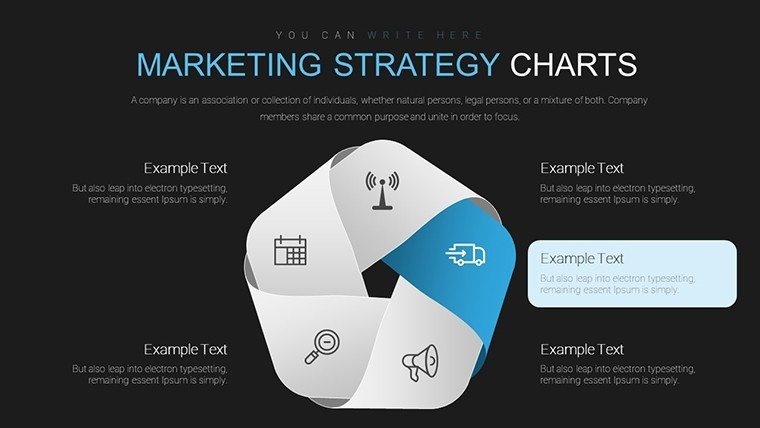
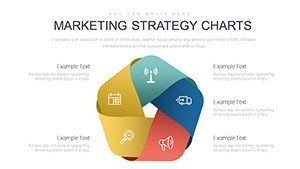
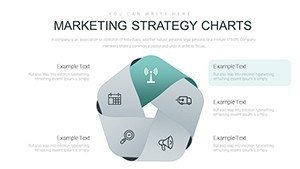
Marketers can visualize customer lifecycles, from awareness to loyalty, using callouts for key metrics. Educators simplify complex topics like ecological chains, making abstract concepts concrete and memorable.
Step-by-step: Select a slide, input data, adjust ribbons for emphasis. This workflow integrates with tools like MindMeister for brainstorming, ensuring a smooth transition from idea to presentation.
Enhancing Reports and Plans
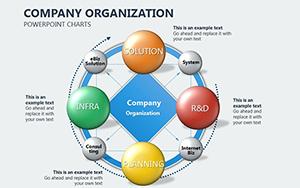
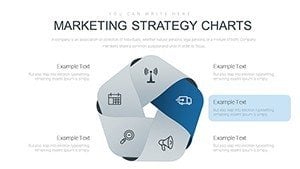
For strategic planning, ribbon charts clarify organizational structures, spotlighting interconnections that drive efficiency. A case from a non-profit: Mapping donor engagement paths led to optimized fundraising, increasing contributions by 20%.
- Identify core elements.
- Connect with ribbons.
- Refine for clarity.
Practical Tips and Integrations
Tips include balancing text with visuals to avoid clutter, and using animations to reveal connections progressively. Integrate with Excel for data-driven updates, solving common issues like outdated info.
This template isn't just slides - it's a tool for clearer communication in a connected era.
Frequently Asked Questions
Are the ribbons fully customizable?
Yes, alter shapes, colors, and paths to suit your needs.
Does it support animations?
Absolutely, add transitions for dynamic reveals.
Compatible with Google Slides?
Yes, for cross-platform use.
What types of diagrams are included?
Ribbon charts, interconnection diagrams, and more.
Any licensing limits?
Unlimited use post-purchase.
Connect your ideas brilliantly - grab this template and innovate.