4-Step Circular PowerPoint Charts Template - Download Presentation

Type: PowerPoint Charts template
Category: Cycle
Sources Available: .pptx
Product ID: PC00690
Template incl.: 17 editable slides
Ever struggled to convey cyclical processes in a way that's both intuitive and visually compelling? Our 4-Step Circular PowerPoint Charts Template is your solution, offering 17 editable slides that map out workflows, strategies, and trends with elegant circular designs. Tailored for dynamic professionals like marketers outlining campaign phases or educators breaking down learning cycles, this template turns abstract ideas into tangible visuals. Forget linear boredom; embrace the flow of circles that represent continuity and progression, making your message stick. With built-in customization, you can adapt every element to fit your narrative, ensuring presentations that not only inform but inspire action. Compatible with PowerPoint and beyond, it's a versatile tool that enhances communication across sectors. Step into a realm where clarity meets creativity, and watch as your audiences connect the dots effortlessly, leading to better decisions and deeper insights.
Harness the Flow of Circular Design for Effective Storytelling
Circular charts excel at depicting repetition and interconnection, a principle rooted in Gestalt psychology where wholes are perceived before parts. This template leverages that by structuring content in four intuitive steps, ideal for processes like product development cycles or annual business reviews. Each circle segment can highlight a phase, with arrows guiding the eye to show progression or feedback loops. In practice, a startup founder might use it to illustrate the lean methodology - build, measure, learn, repeat - helping investors grasp the iterative nature quickly. Informed by design best practices from sources like the Interaction Design Foundation, the template minimizes cognitive load, allowing focus on content. Its 17 slides provide ample variety, from simple overviews to detailed breakdowns, all optimized for widescreen formats to suit modern projectors and screens.
Essential Features Driving Presentation Success
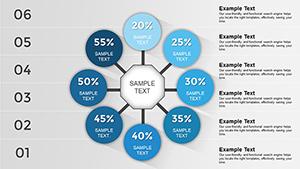
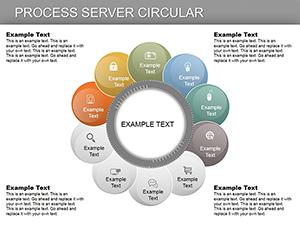
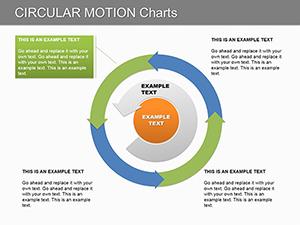
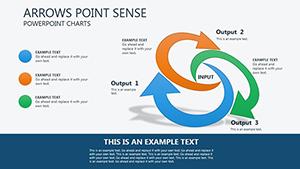
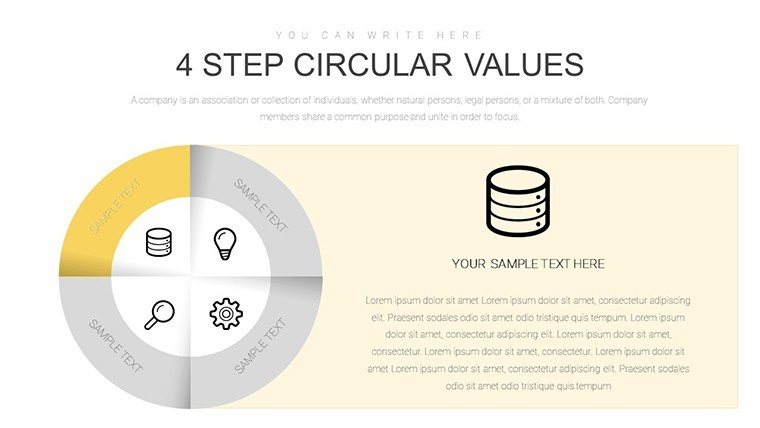
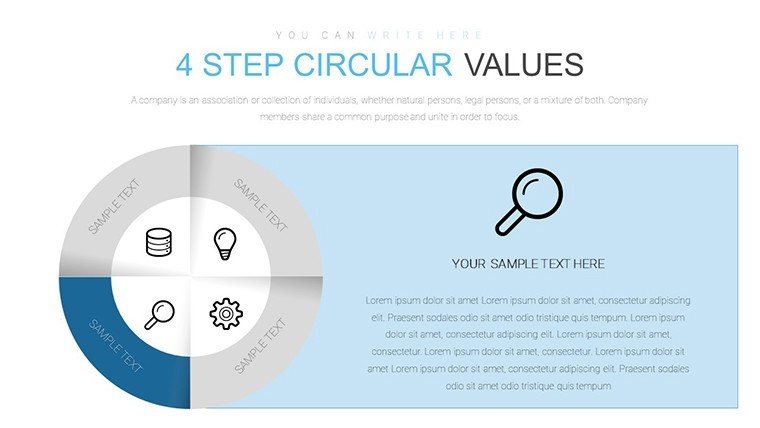
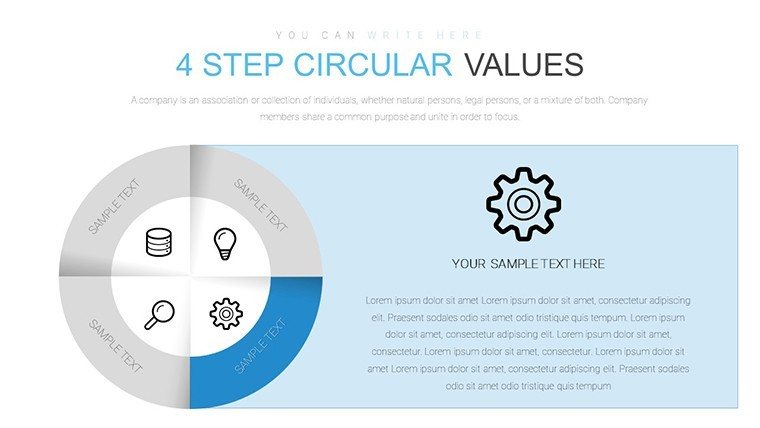
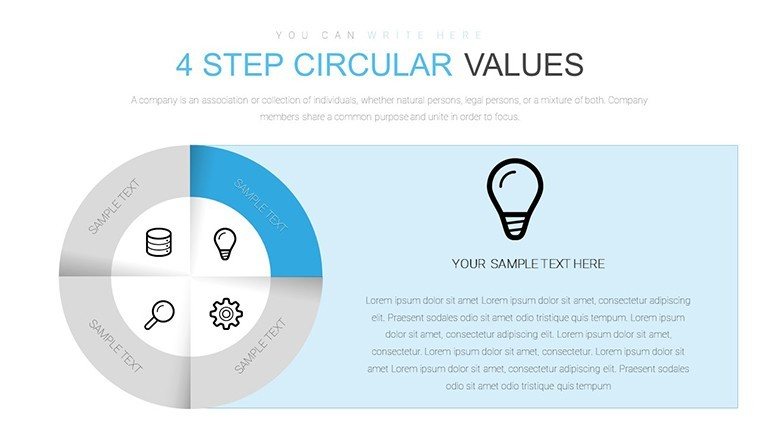
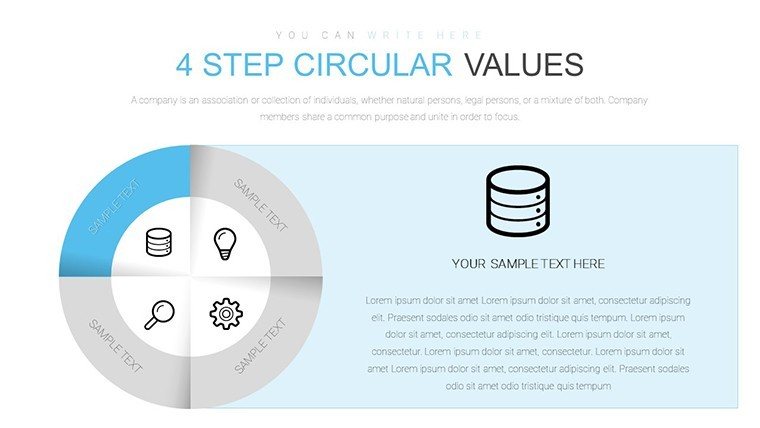
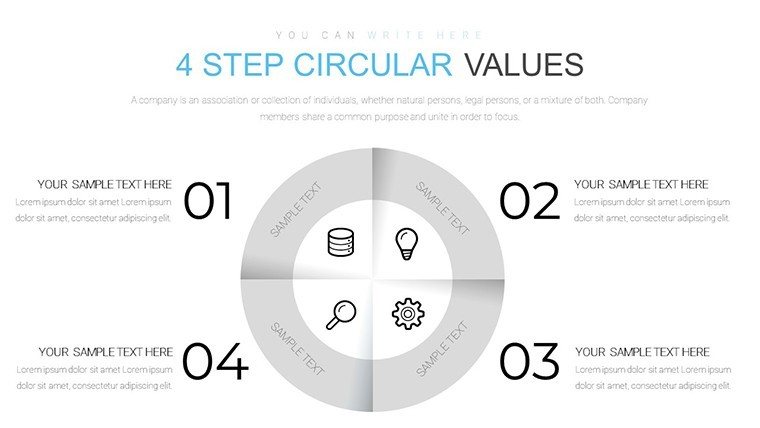
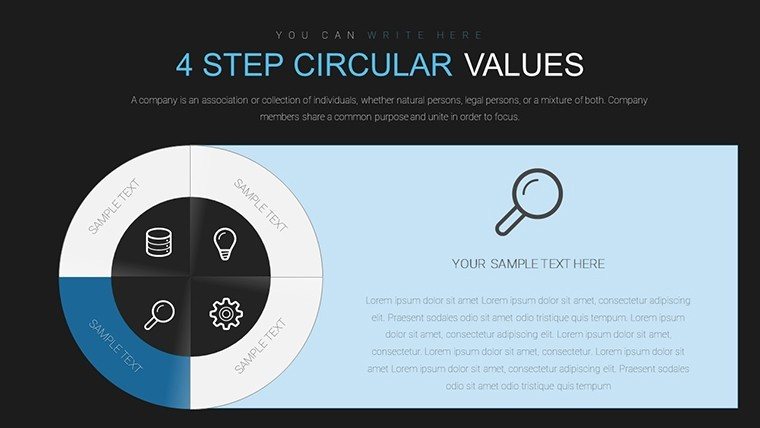
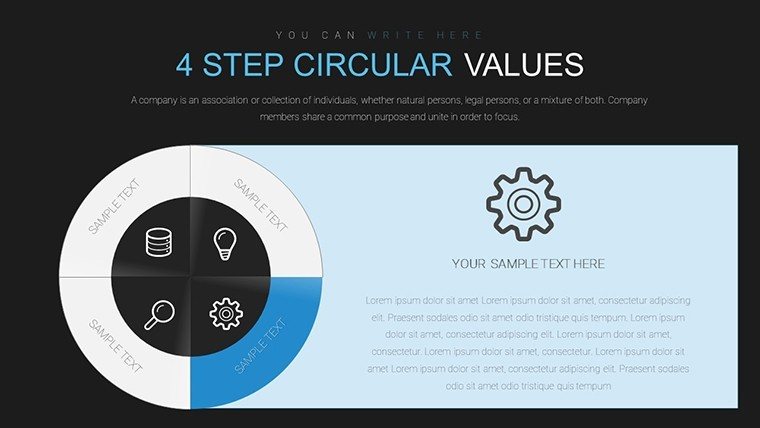
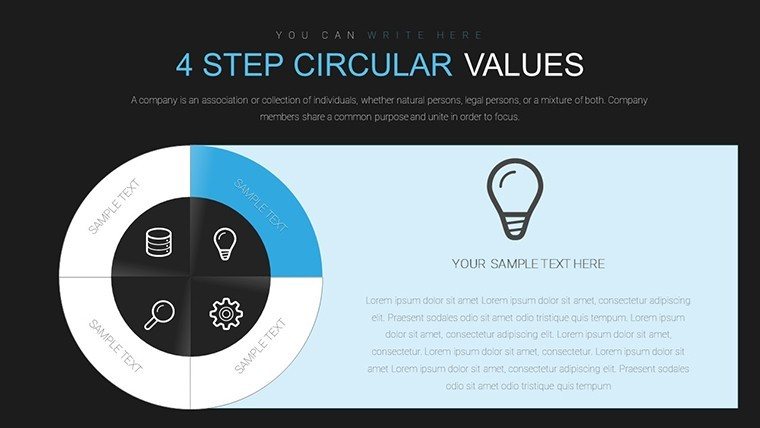
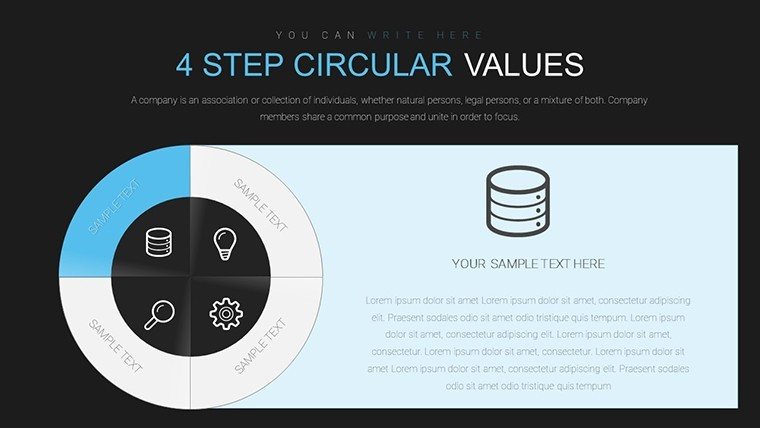
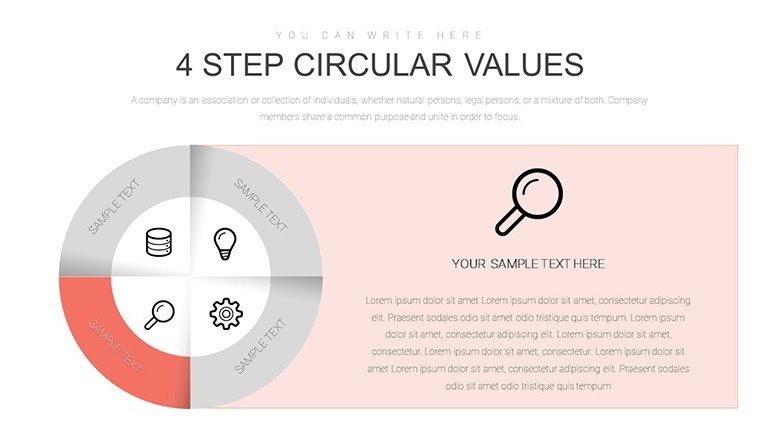
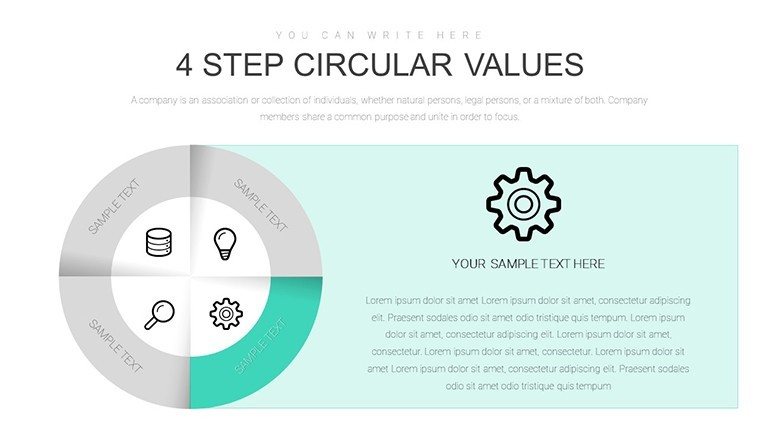
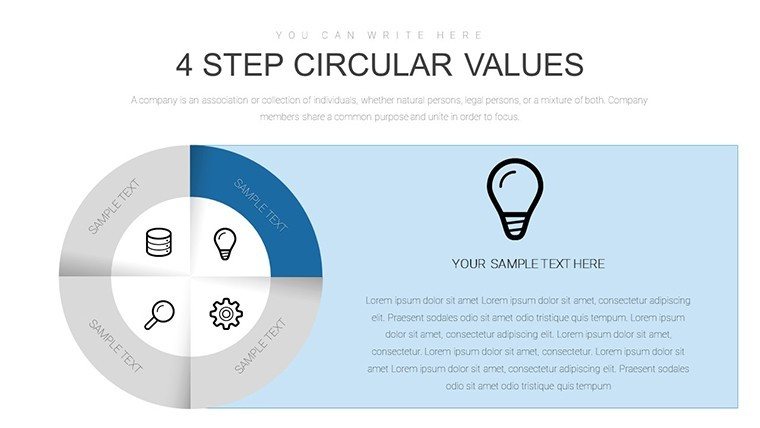
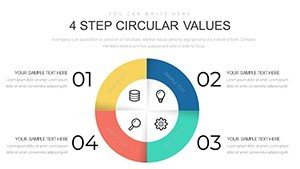
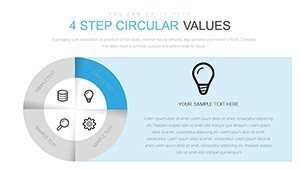
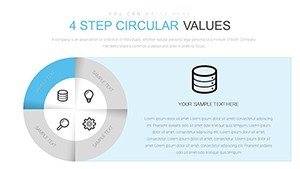
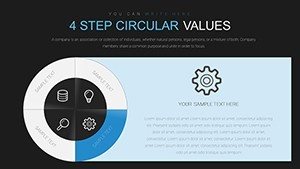
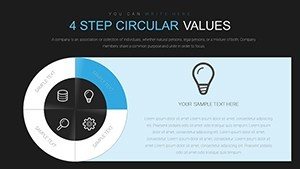
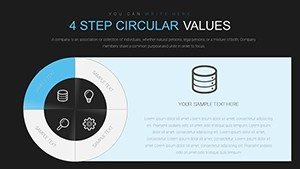
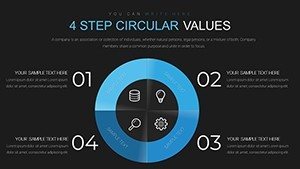
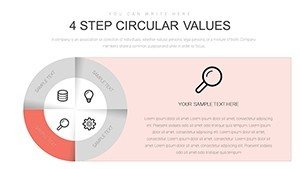
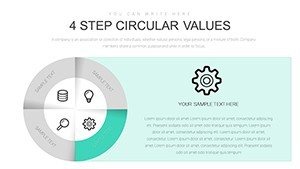
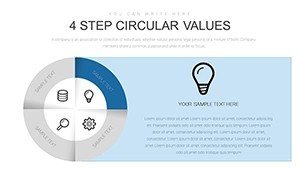
- Engaging Circular Layouts: Core to the design, these charts visualize steps in a non-linear fashion, perfect for agile methodologies or marketing funnels where stages interconnect.
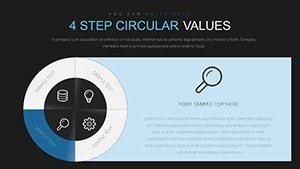
- Extensive Customization: Modify hues to match corporate palettes, tweak fonts for readability, and rearrange layouts for emphasis, aligning with WCAG accessibility standards.
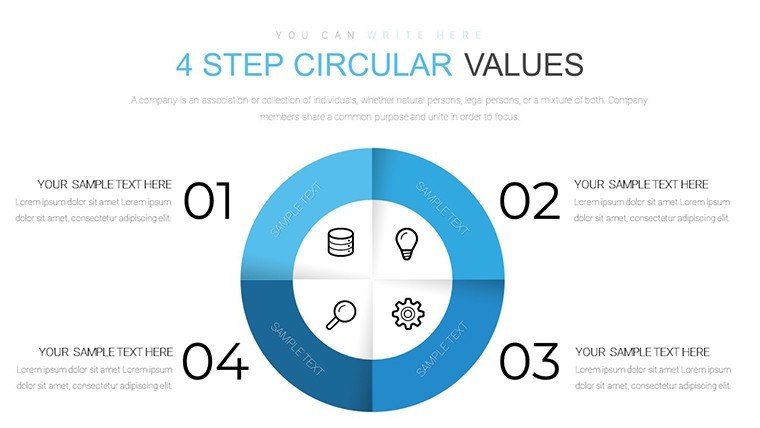
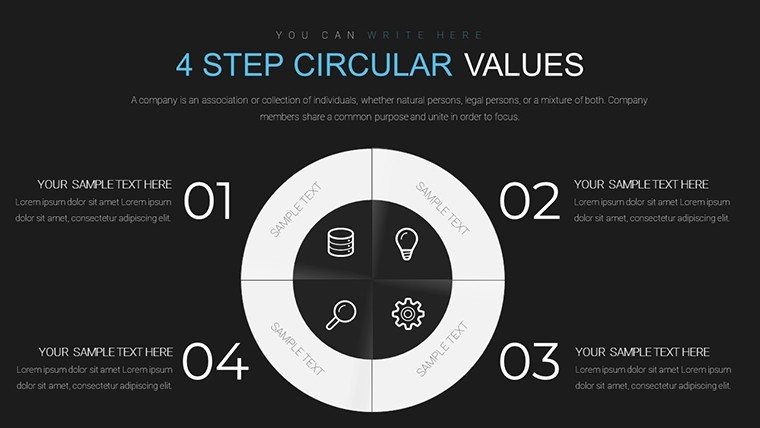
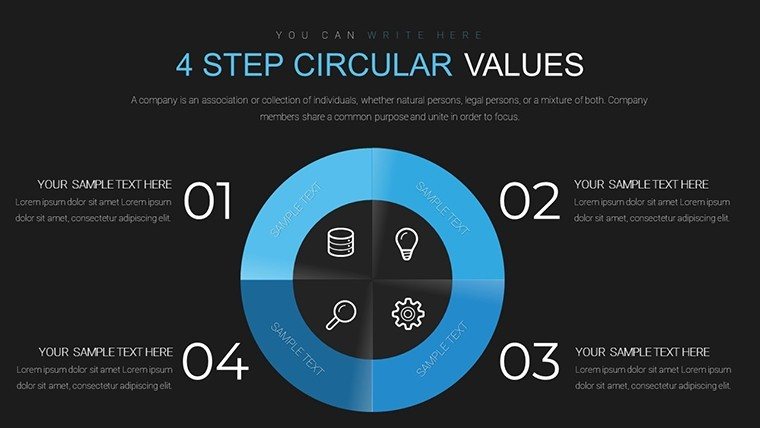
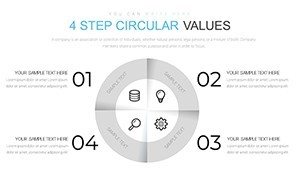
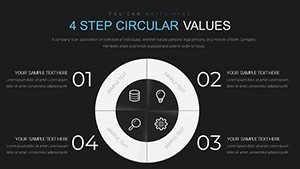
- Step-by-Step Guidance: Built-in placeholders for each of the four steps simplify content insertion, reducing preparation time significantly.
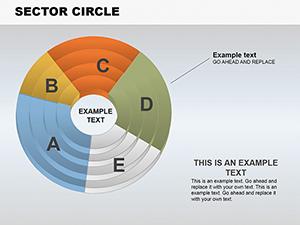
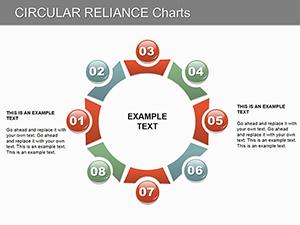
- Versatile Applications: From SWOT analyses in circular form to timeline cycles, the template adapts to diverse needs without losing coherence.
- Smooth Integration: Fully compatible with PowerPoint, including animation support for revealing steps sequentially.
With 869 ratings backing its efficacy, this template is a trusted choice for those seeking professional polish.
Practical Use Cases Across Industries
In the corporate world, imagine a project manager using the 4-step circles to outline risk assessment phases - identify, analyze, mitigate, monitor - facilitating team alignment and proactive planning. Educators might adapt it for lesson plans, cycling through introduce, engage, assess, reinforce, making abstract curricula concrete. Marketers find value in depicting customer journeys, from awareness to loyalty, with data points embedded in each segment for evidence-based pitches. Drawing from real-world examples like how companies such as Google use circular models in OKR frameworks, this template empowers users to mirror successful strategies. Entrepreneurs pitching to VCs can showcase business models with visual loops, emphasizing sustainability and growth potential. Unlike rigid table formats, circles invite exploration, encouraging audience interaction during Q&A. This approach aligns with TED Talk principles, where visuals amplify narratives for memorable impact.
In-Depth Look at the Slide Collection
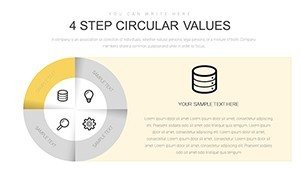
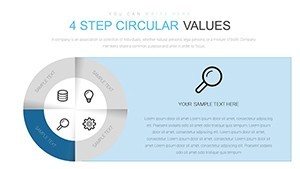
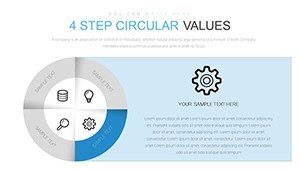
The 17 slides are thoughtfully sequenced for narrative build-up. Slide 1 introduces the theme with a bold circular graphic and title space. Slides 2-6 offer basic 4-step templates with varying emphases - one with icons for visual appeal, another with text-heavy segments for detailed explanations. Midway (slides 7-12), advanced variations appear, like nested circles for sub-steps or integrated graphs showing metrics per phase. For instance, slide 9 might feature a donut chart within the circle, ideal for percentage breakdowns in sales cycles. Closing slides (13-17) include summary views, comparison circles for before-after analyses, and action-oriented calls with embedded buttons. Each incorporates thematic icons from a cycle library, enhancing thematic consistency. Tip: Layer animations to unveil steps one by one, building anticipation and aiding retention, a technique proven in educational psychology research.
Expert Customization Strategies
Begin customization by defining your core message - what cycle are you illustrating? Then, select complementary colors; for eco-friendly topics, greens evoke growth. Use PowerPoint's shape tools to resize segments proportionally, maintaining balance. Integrate data from Excel for live updates, ensuring accuracy in fluctuating environments like financial reporting. Per insights from design gurus like Nancy Duarte, align visuals with story arcs for emotional resonance. Test for mobile compatibility, as remote presentations rise. Avoid clutter by limiting text per segment - aim for 5-7 words max. These steps transform the template into a bespoke tool, elevating your professional presence.
Superiority Over Generic Chart Tools
Standard PowerPoint circles often lack depth, resulting in flat presentations. This template elevates with pre-designed harmony and animations, cutting design time by half. At $15, it's cost-effective, with user testimonials noting increased engagement rates. Exportable to Google Slides for collaboration, it supports hybrid teams. Backed by 869 ratings, it's reliable for high-stakes scenarios.
Seize the cycle of success - download this 4-Step Circular PowerPoint Charts Template now and loop in your audience like never before.
Frequently Asked Questions
What makes the circular charts effective for processes?
They represent continuity and interconnection, making complex cycles easier to understand and remember.
Can I add more than four steps?
Yes, the editable design allows expansion or contraction of steps to fit your needs.
Is animation included?
Absolutely, with options for sequential reveals to enhance storytelling.
Compatible with Google Slides?
Yes, export the .pptx file seamlessly for use in Google Slides.
How do I integrate my data?
Use placeholders or link to Excel for dynamic updates.