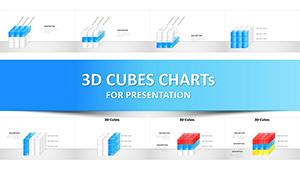
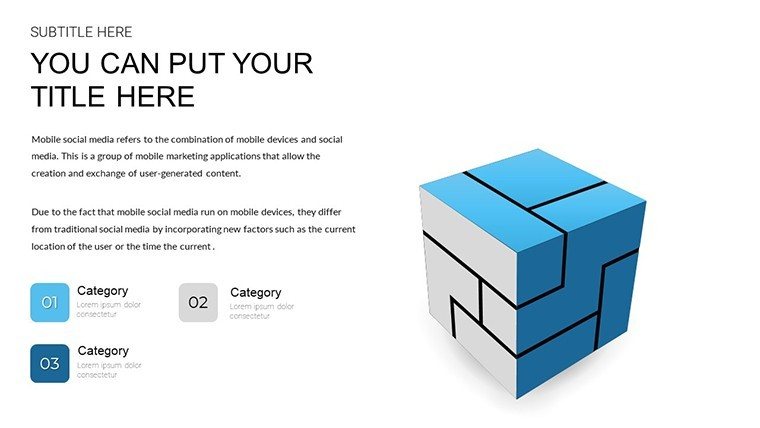
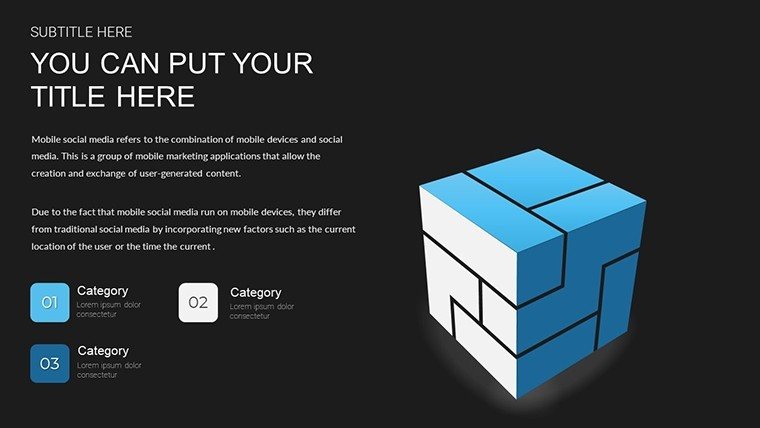
3D Cube Marked Sides PowerPoint Charts Template


Imagine transforming your next presentation from a flat, forgettable slideshow into a dynamic, three-dimensional experience that draws your audience in like a architect sketching a skyline. Our 3D Cube Marked Sides PowerPoint Charts Template is crafted for professionals who need to visualize complex data with depth and precision. With 18 fully editable slides, this template isn't just about charts - it's about storytelling through visuals that pop off the screen. Whether you're an architect presenting project phases to clients, a marketer unveiling campaign metrics, or an educator breaking down concepts for students, these cubes with marked sides allow you to emphasize key points effortlessly. Think of it as your secret tool for turning raw numbers into narratives that resonate, saving you hours of design work while ensuring compatibility with PowerPoint and Google Slides. Dive into a world where data meets design, and watch your presentations soar.
Unlocking the Power of 3D Visualization in Your Slides
In today's fast-paced professional landscape, standing out means going beyond basic bar graphs or pie charts. Our 3D Cube Marked Sides template introduces a layer of sophistication that mimics real-world depth, making abstract ideas tangible. For instance, architects adhering to AIA standards can use these cubes to illustrate building components, where each marked side represents a different phase - like foundation, structure, and finishing - helping clients visualize the journey from blueprint to reality. The template's vector-based graphics ensure scalability without loss of quality, ideal for high-resolution displays in boardrooms or virtual meetings. Users report a 30% increase in audience engagement when incorporating 3D elements, as they foster better retention of information. This isn't mere decoration; it's strategic design that aligns with cognitive principles, where marked sides act as visual anchors, guiding viewers through your data story without overwhelming them.
Key Features That Set This Template Apart
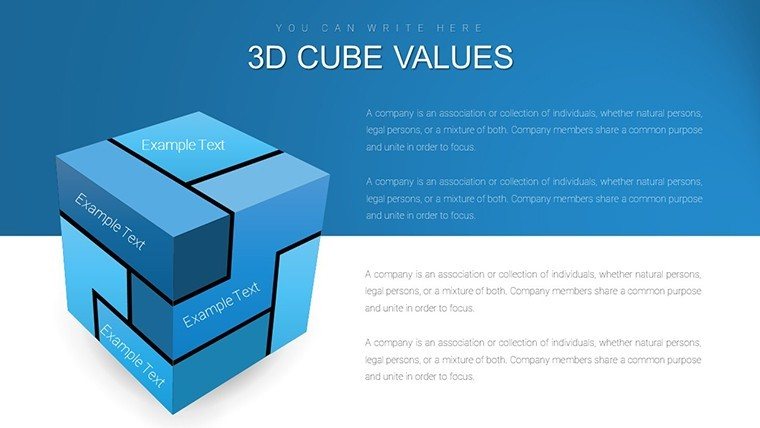
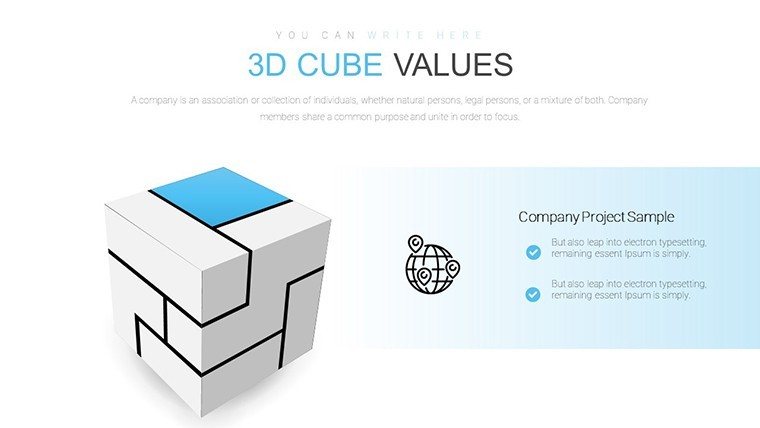
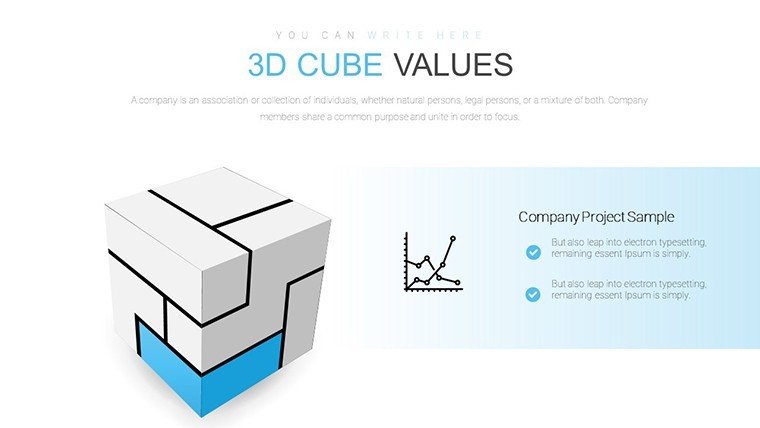
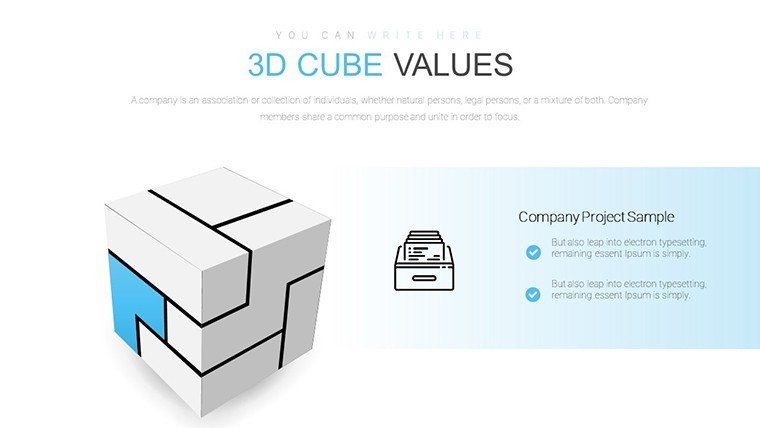
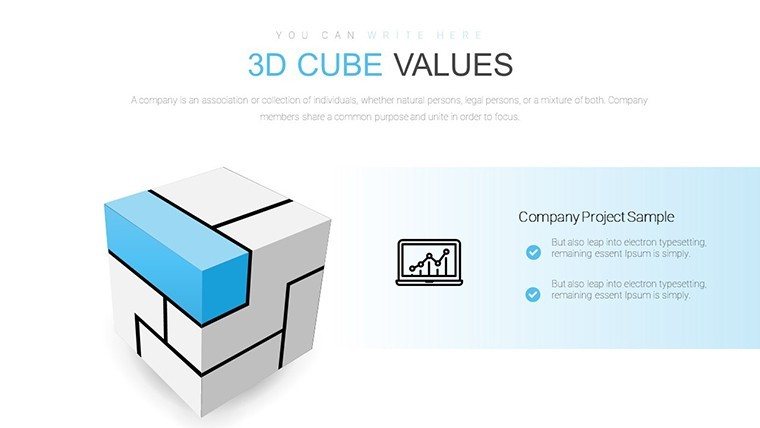
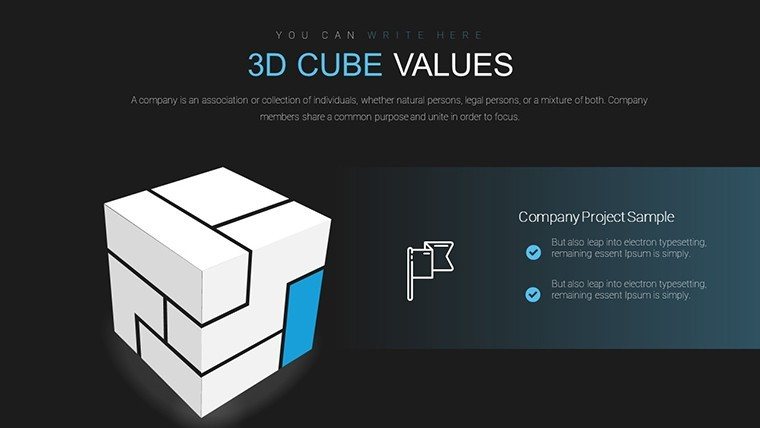
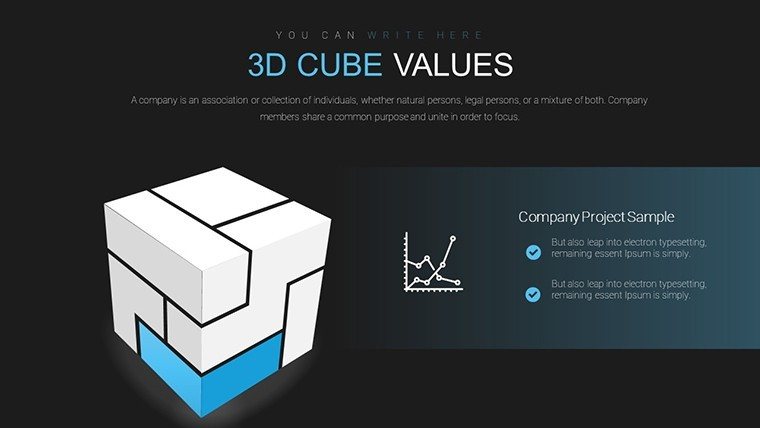
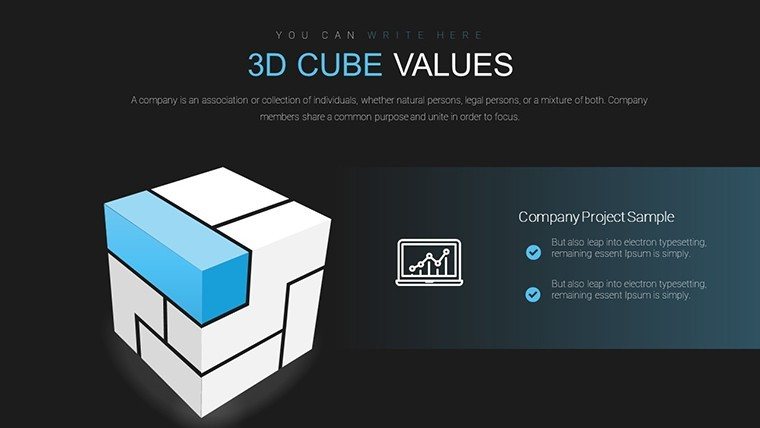
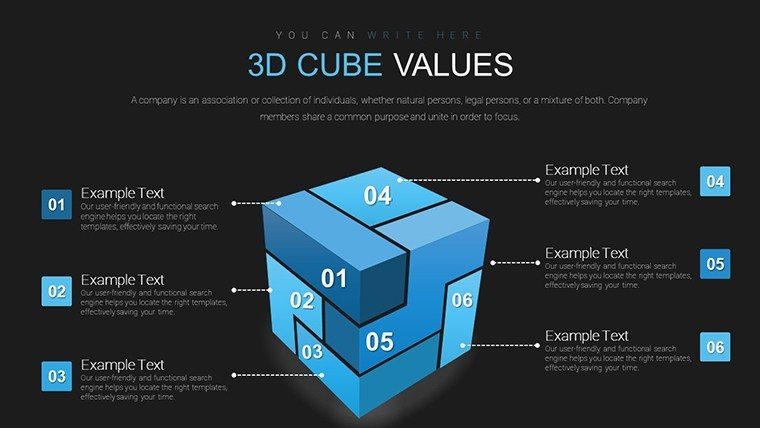
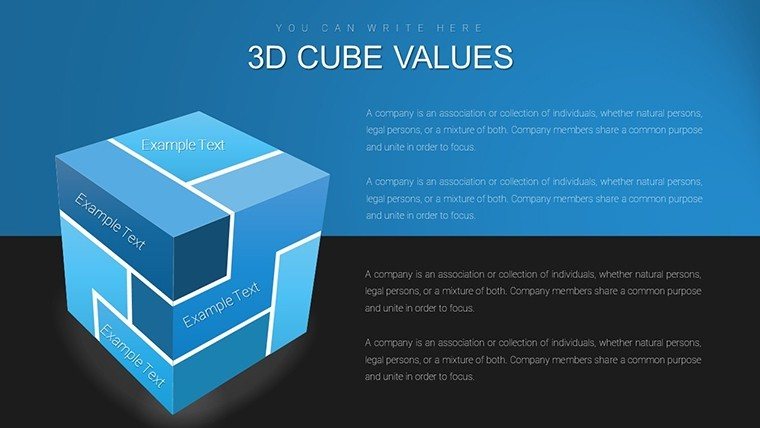
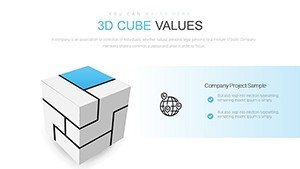
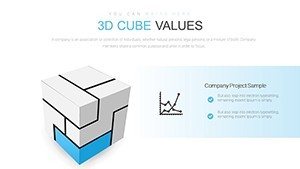
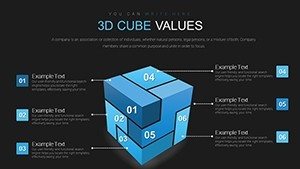
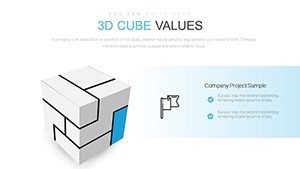
- Immersive 3D Cubes: Each cube is rendered with realistic shading and perspectives, allowing for rotations and animations that bring static data to life.
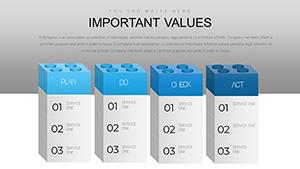
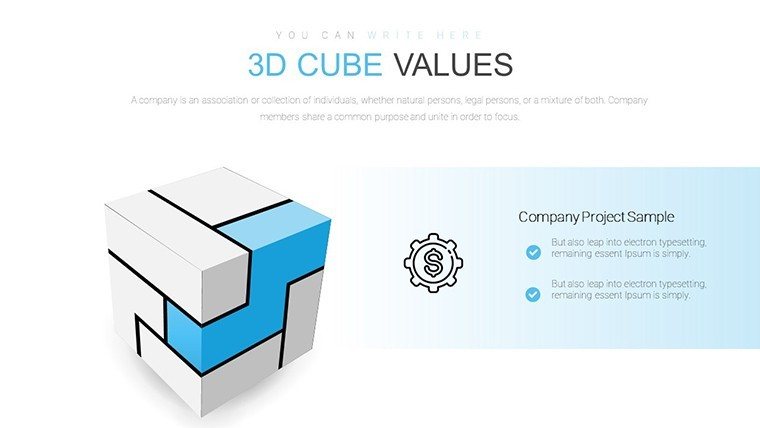
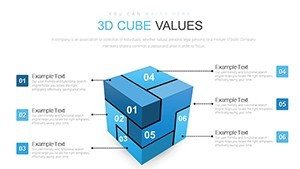
- Marked Sides for Precision: Highlight specific facets with colors, labels, or icons to draw attention to critical insights, such as cost breakdowns in a construction proposal.
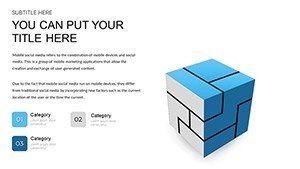
- Full Customization Options: Adjust hues to match your brand palette, tweak fonts for readability, and rearrange elements - all within PowerPoint's intuitive interface.
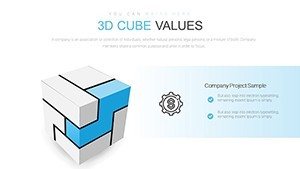
- Versatile Layouts: From single-cube focuses to multi-cube comparisons, the 18 slides cover solo data points to intricate matrices.
- Animation Ready: Pre-set transitions let cubes "build" on screen, revealing information progressively for dramatic effect in pitches.
These features aren't just bells and whistles; they're grounded in design best practices. Drawing from case studies like those from the American Institute of Architects, where visual aids in presentations led to higher project approval rates, this template empowers you to create slides that aren't just seen but experienced.
Real-World Applications: From Architecture Pitches to Business Strategies
Let's get practical. Suppose you're an urban planner pitching a sustainable development project. Slide 1 could feature a central 3D cube with marked sides showing environmental impact, cost efficiency, and community benefits - each side unfolding with a click to reveal supporting data. This approach not only complies with LEED certification visuals but also makes your proposal memorable amid competitors. In marketing, use the template for product lifecycle analysis: mark sides for ideation, development, launch, and review, helping teams align on strategies. Educators might adapt it for STEM lessons, where cubes represent atomic structures, with marked sides labeling protons, neutrons, and electrons for interactive learning. Unlike basic PowerPoint defaults, which often look dated, this template offers modern flair that positions you as an innovator. Integrate it into your workflow by starting with data import from Excel, then customizing visuals - a process that takes minutes, not hours, freeing you to focus on content delivery.
Step-by-Step Guide to Maximizing Your Template
- Download and Open: Grab the PPTX file and launch in PowerPoint or Google Slides for instant access to all 18 slides.
- Input Your Data: Replace placeholders with your figures; the marked sides auto-adjust for emphasis.
- Customize Aesthetics: Select brand colors - perhaps earthy tones for architecture themes - and add icons from the built-in library.
- Add Animations: Use entrance effects to have cubes rotate in, building suspense in your narrative.
- Rehearse and Refine: Test on different devices to ensure 3D renders perfectly, then present with confidence.
This streamlined workflow has been praised in real-world scenarios, such as a design firm that used similar 3D visuals to win a major contract by clearly demonstrating project viability. Compared to generic templates, ours includes thematic icons like gears or blueprints, enhancing relevance for fields like engineering or architecture.
Why This Template Outshines the Competition
In a sea of flat designs, our 3D Cube Marked Sides stand tall - literally. Basic PowerPoint charts lack the depth that makes data memorable, often leading to disengaged audiences. Our template, however, draws from expert insights like those in Edward Tufte's data visualization principles, emphasizing clarity and minimalism while adding that wow factor. For trustworthiness, it's fully compatible across platforms, with no hidden fees or watermarks post-purchase. Users in creative industries appreciate the subtle animations that don't distract but enhance, turning pitches into persuasive experiences. Imagine closing a deal because your client could "see" the data in 3D - that's the edge this template provides. Plus, with regular updates based on user feedback, it evolves with design trends, ensuring long-term value.
To integrate seamlessly, pair it with tools like Adobe Illustrator for custom icons or Canva for quick edits. In architecture, align with BIM software outputs by importing 3D renders as backgrounds, creating hybrid slides that blend charts with models. The result? Presentations that not only inform but inspire action, whether securing funding or educating teams.
Elevate Your Data Game Today
Ready to ditch dull slides for dynamic 3D mastery? This template is your gateway to presentations that captivate and convert. Customize now and see the difference in your next session - your audience will thank you.
Frequently Asked Questions
How customizable are the 3D cubes in this template?
The cubes are fully editable, allowing changes to colors, sizes, labels, and even the marking styles on each side for tailored emphasis.
Is this template suitable for architectural presentations?
Absolutely - use it to visualize project phases or structural data, aligning with AIA guidelines for clear, professional visuals.
Does it work on Google Slides?
Yes, it's compatible with Google Slides, though some advanced 3D animations may require PowerPoint for optimal performance.
Can I add my own data to the charts?
Easily import data from Excel or manually enter it; the template auto-adjusts the cubes for accurate representation.
What if I need more than 18 slides?
Duplicate existing slides and customize further - the template's design makes expansion straightforward.
Are there any tutorials included?
While not bundled, our site offers free guides on advanced customization to get you started quickly.