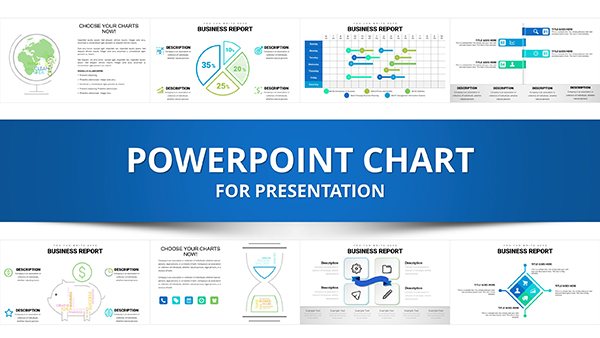
Business PowerPoint Charts for Presentation Template


Type: PowerPoint Charts template
Category: Analysis
Sources Available: .pptx
Product ID: PC00663
Template incl.: 28 editable slides
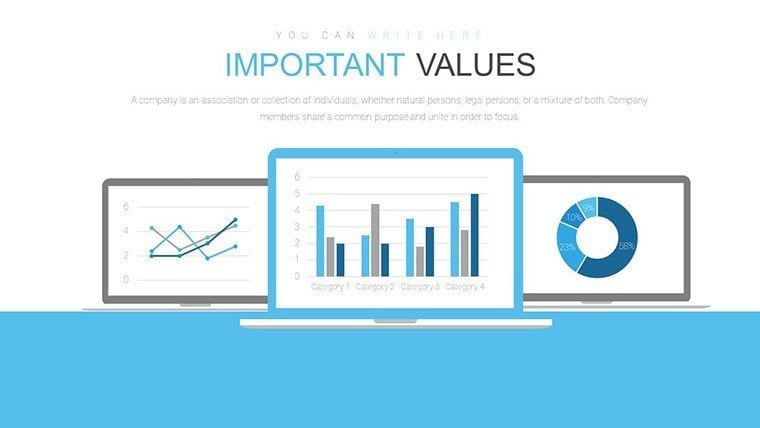
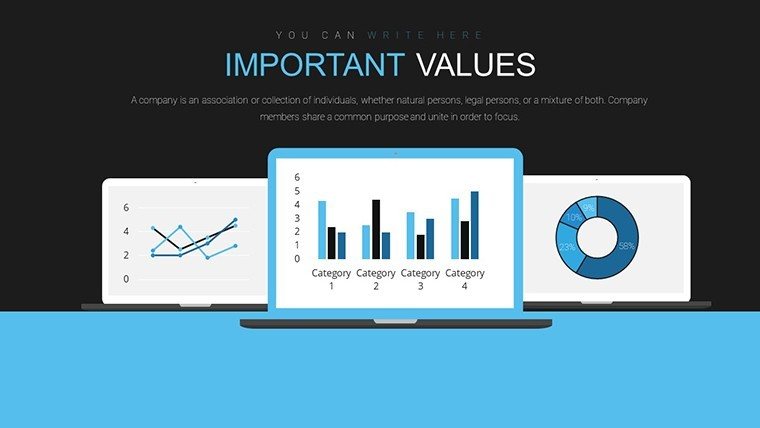
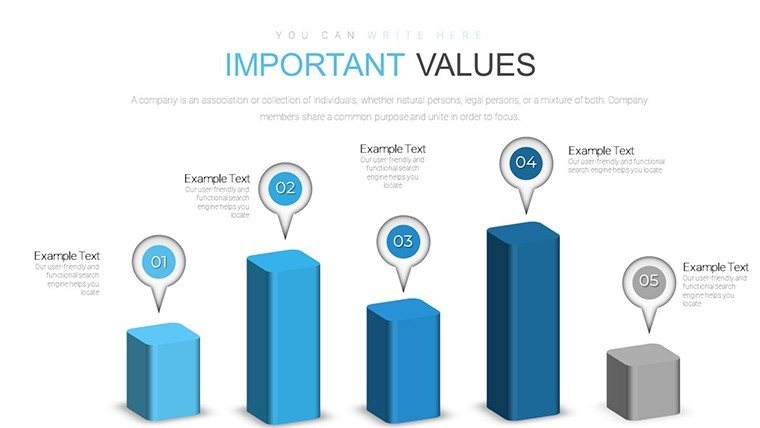
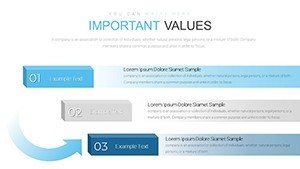
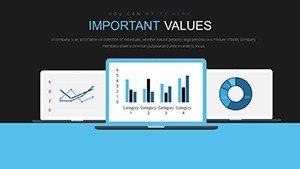
In the competitive world of business, where decisions hinge on clear insights, our Business PowerPoint Charts template emerges as your secret weapon. With 28 editable slides packed with diverse infographics - from bar charts tracking sales growth to pie graphs allocating budgets - this template is crafted for executives who demand precision and polish. Envision presenting a market analysis where data flows seamlessly into visuals, much like in Fortune 500 earnings calls. Tailored for entrepreneurs pitching to venture capitalists or managers reporting KPIs, it ensures compatibility with PowerPoint and Google Slides, allowing effortless tweaks to fonts, colors, and layouts. Beyond mere slides, it's a toolkit for storytelling, transforming raw numbers into narratives that drive action and foster understanding, all while adhering to data visualization best practices from experts like Edward Tufte.
Unlock Professional Edge with Business PowerPoint Charts
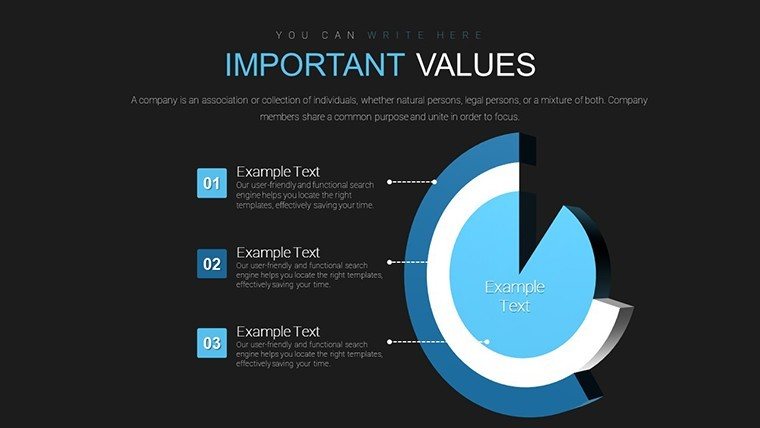
Unparalleled Customizability in Action
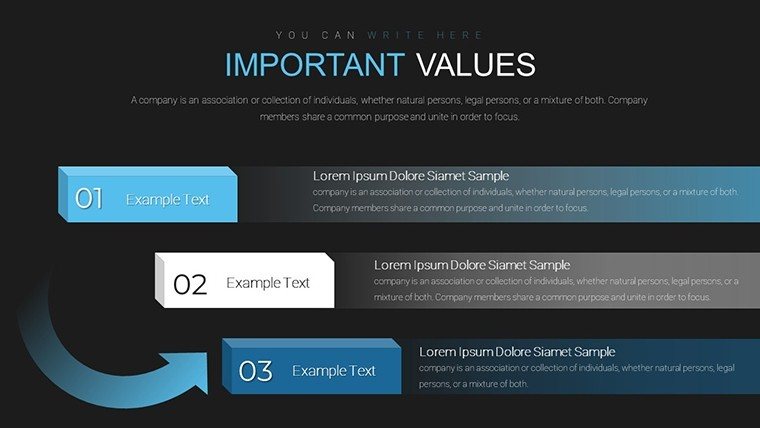
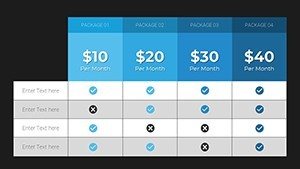
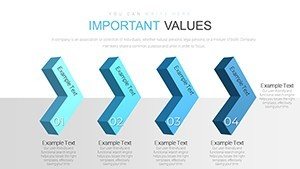
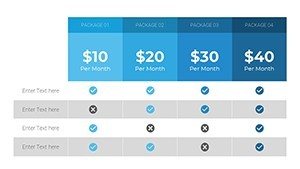
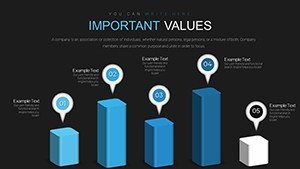
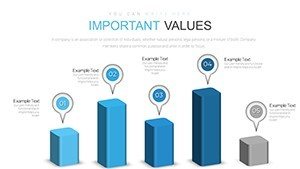
Customization isn't optional; it's essential. Adjust chart elements to reflect your brand - swap blues for corporate reds or resize graphs for emphasis. Slide 12, for instance, might feature a stacked bar chart for revenue streams, editable to include real-time data links.
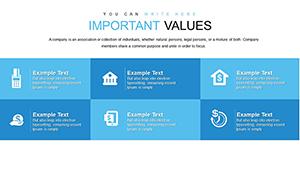
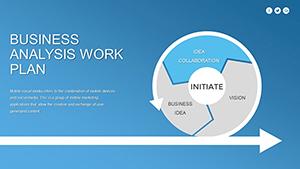
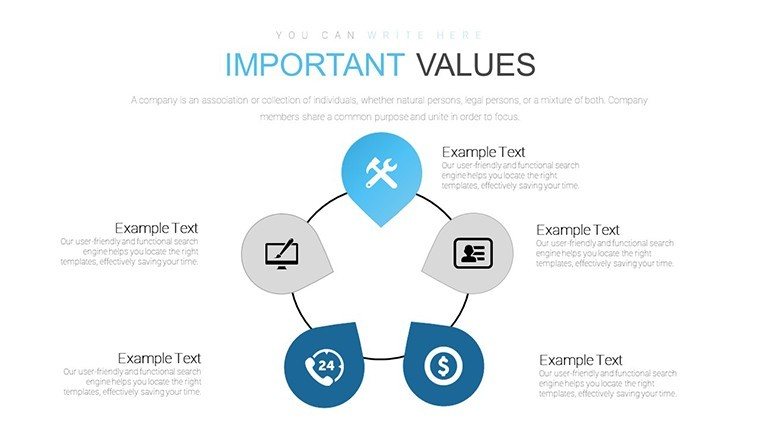
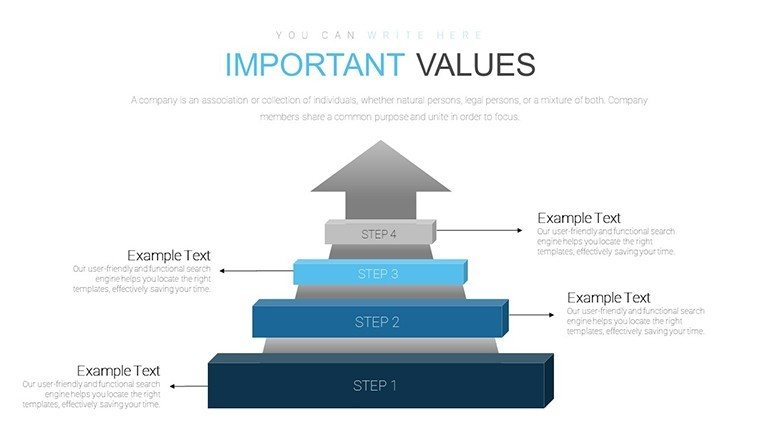
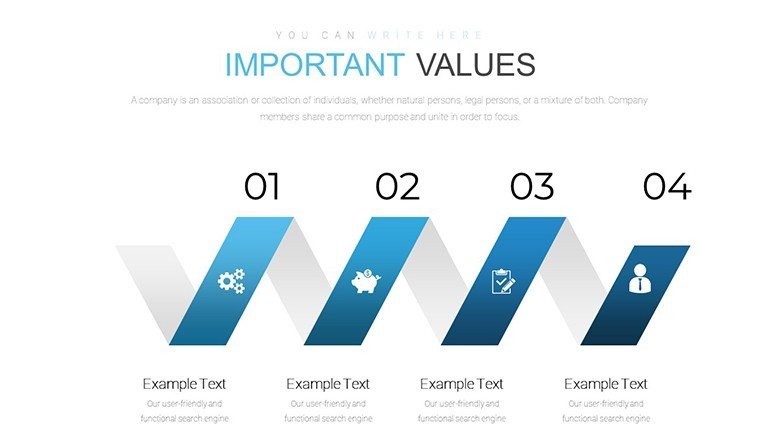
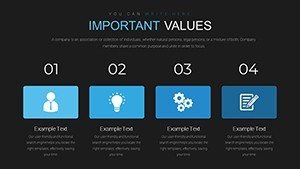
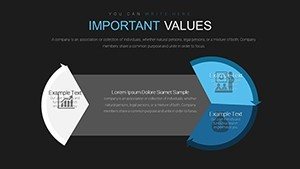
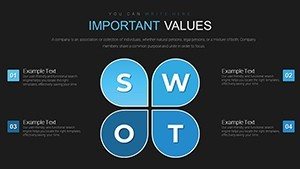
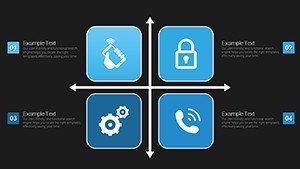
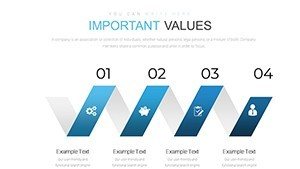
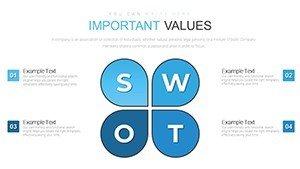
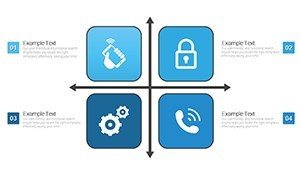
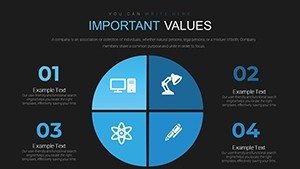
Infographics that Speak Volumes
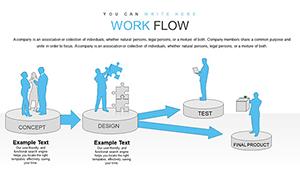
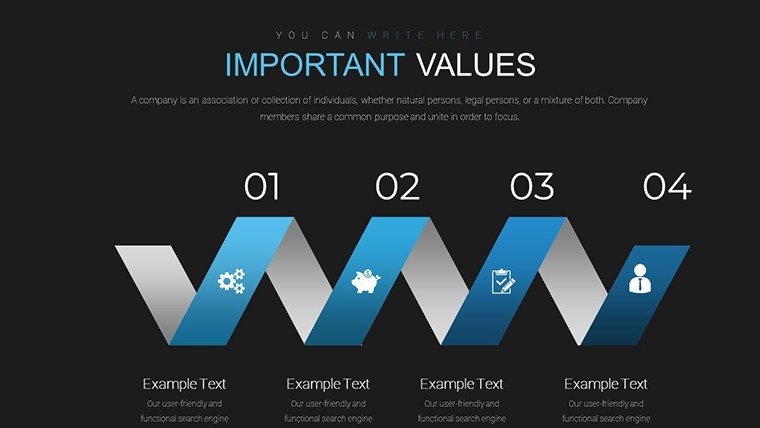
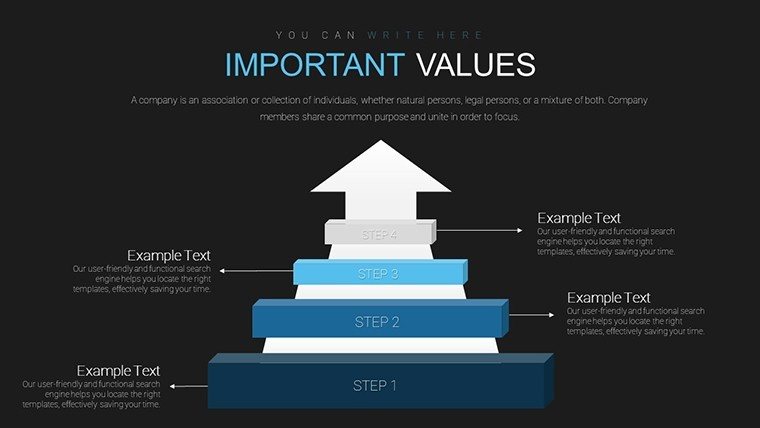
Go beyond basics with infographics that simplify complexities. Use Slide 15's timeline chart for project roadmaps, highlighting milestones with icons, far superior to plain text timelines in engagement and clarity.
Designed for Business Professionals
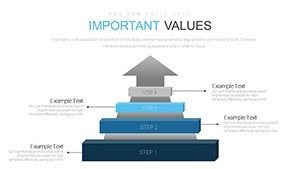
Expertly crafted, these charts meet the rigor of professional environments. In a startup scenario, leverage them for investor decks, piecing financial projections into digestible visuals that secure funding.
Time Efficiency without Sacrificing Quality
Ready-to-use yet flexible, save hours versus designing anew. Integrate into workflows by importing data from Excel, ensuring updates are a click away.
Who Thrives with These Charts?
- Entrepreneurs and Startups: Impress with growth projections in funding rounds.
- Managers and Executives: Clarify strategies in team huddles.
- Educators and Trainers: Teach business concepts with visual aids.
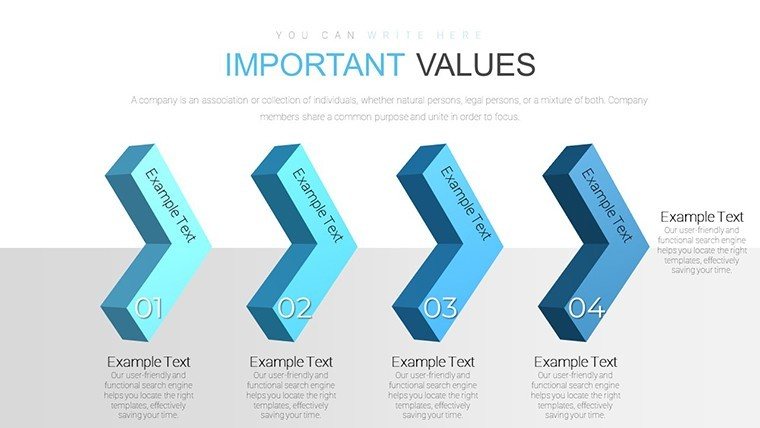
Step-by-step: Load template, populate charts with data, customize aesthetics, add animations for flow. Compared to free tools, premium quality reduces revisions.
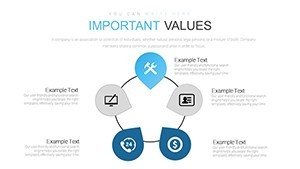
Value in diversity: From funnel charts for sales pipelines to heat maps for risk assessment. Tips: Use consistent color schemes; label axes clearly; avoid chartjunk for clean looks.
Real applications: In urban planning firms, adapt for project budgets; in marketing, for campaign ROI visuals. CTAs: Start visualizing - download today. Or, boost your next report - get it now.
Conclude strongly: Harness these business charts to not just present, but persuade - secure your template and chart a course to success.
Frequently Asked Questions
How do I link data to charts?
Easily connect to Excel for dynamic updates.
Compatible with older PowerPoint?
Best with 2016+, but adaptable.
Can I export to PDF?
Yes, maintain quality for shares.
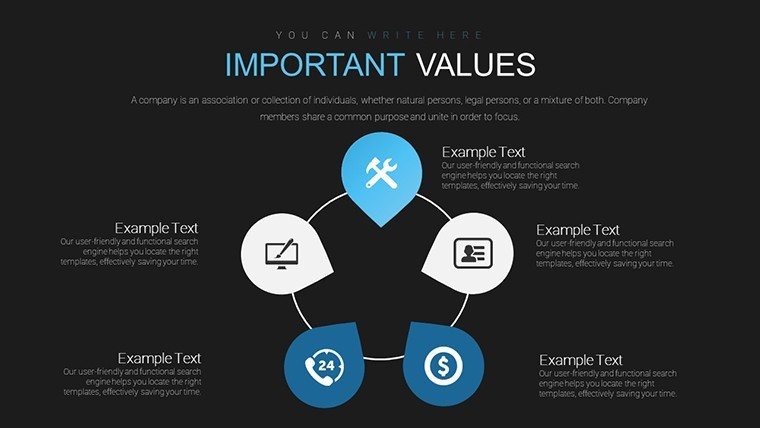
Are icons included?
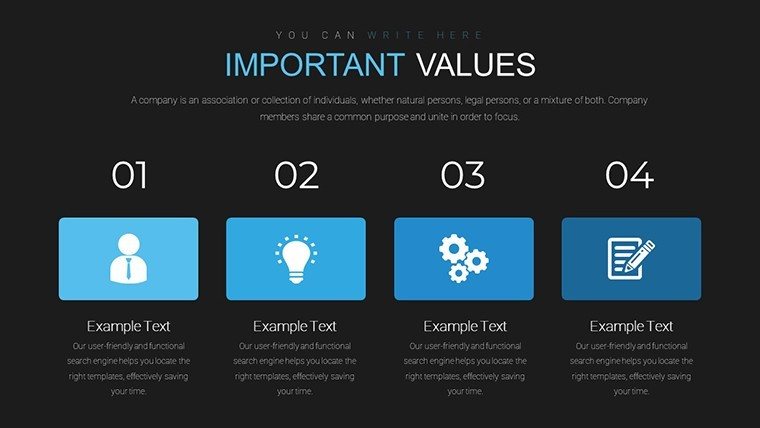
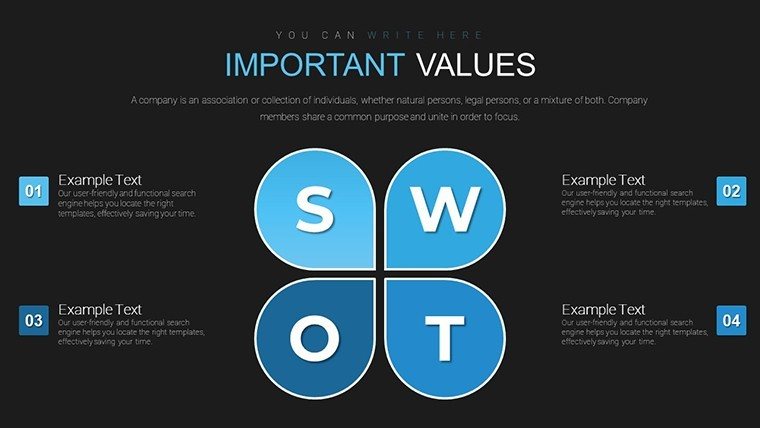
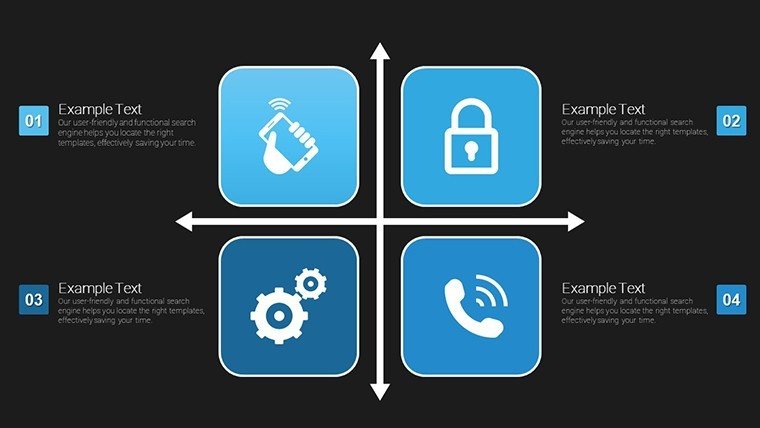
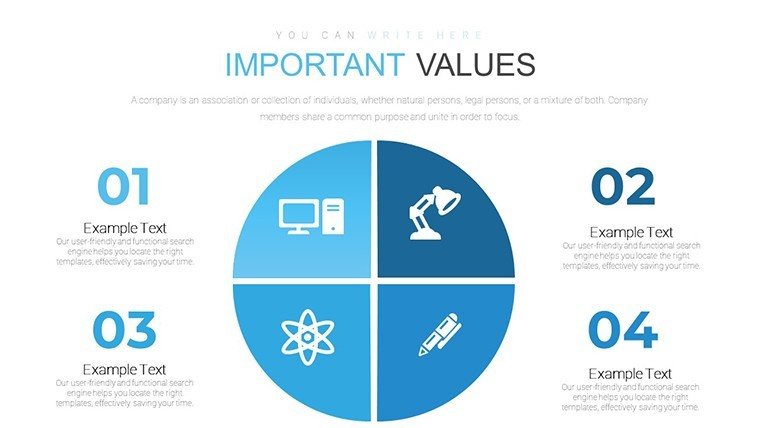
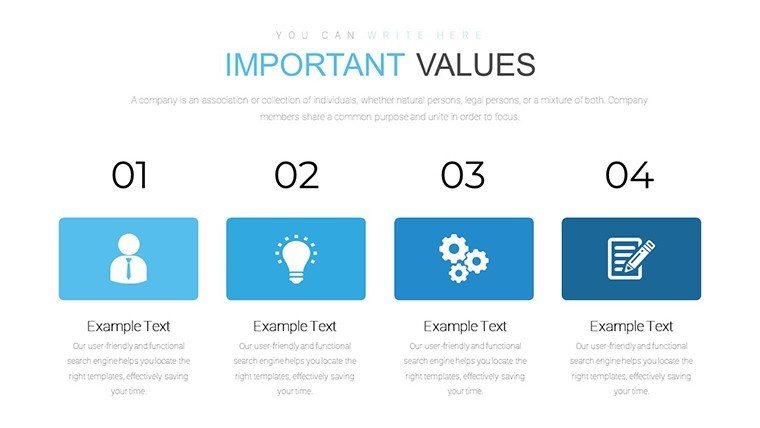
Yes, business-themed for enhancement.
Suitable for virtual meetings?
Optimized for screen sharing.
What chart types are there?
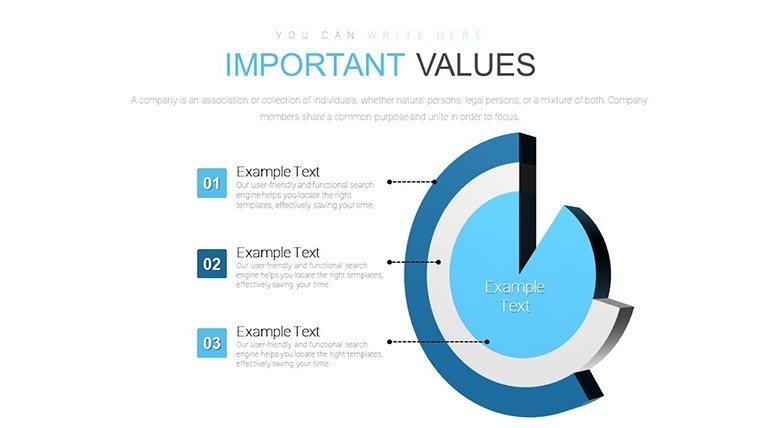
Bar, pie, line, funnel, and more.