Professional Data Analysis PowerPoint Charts Template - Fully Editable & Instant Download


Type: PowerPoint Charts template
Category: Analysis
Sources Available: .pptx
Product ID: PC00662
Template incl.: 24 editable slides
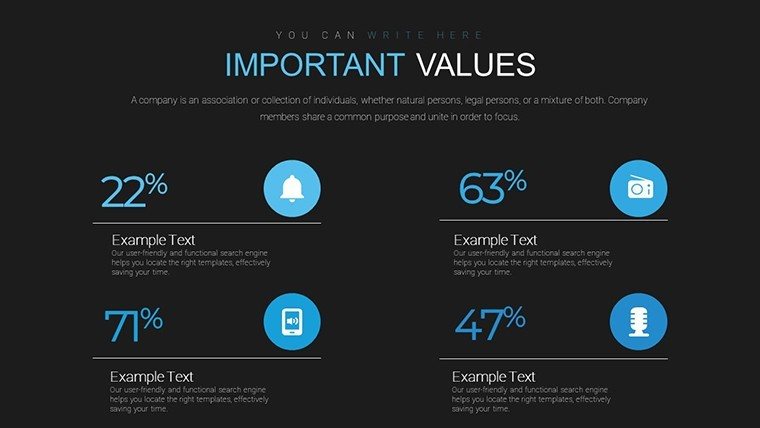
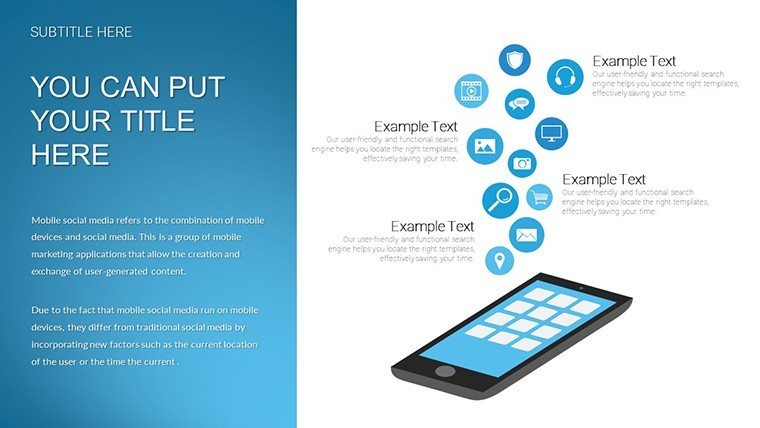
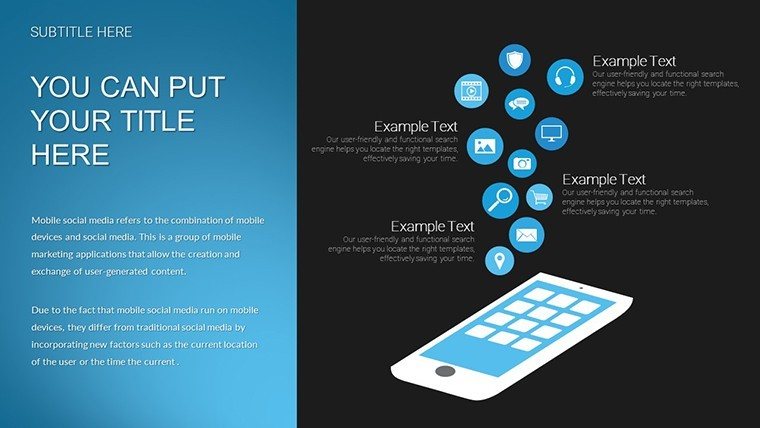
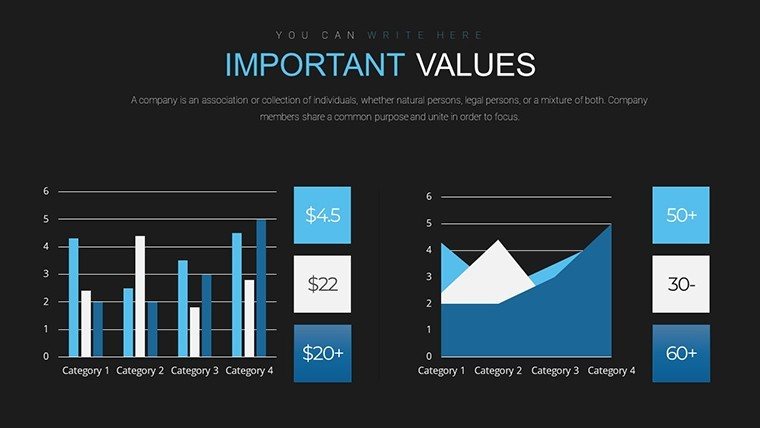
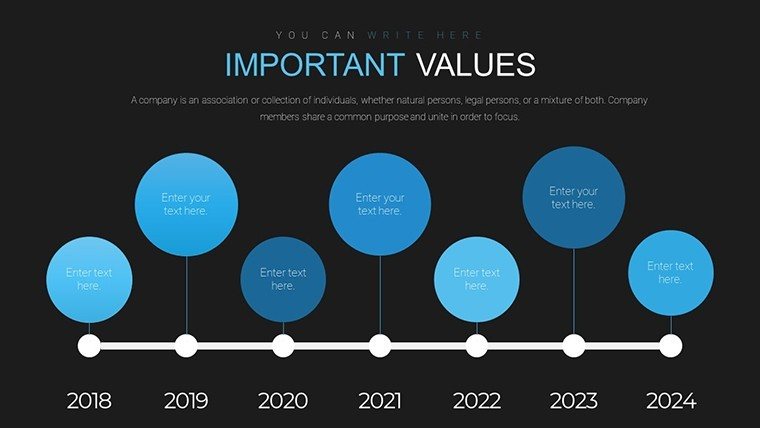
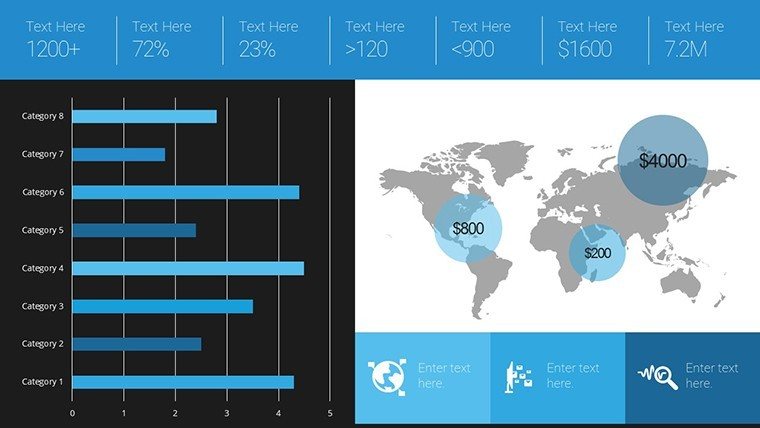
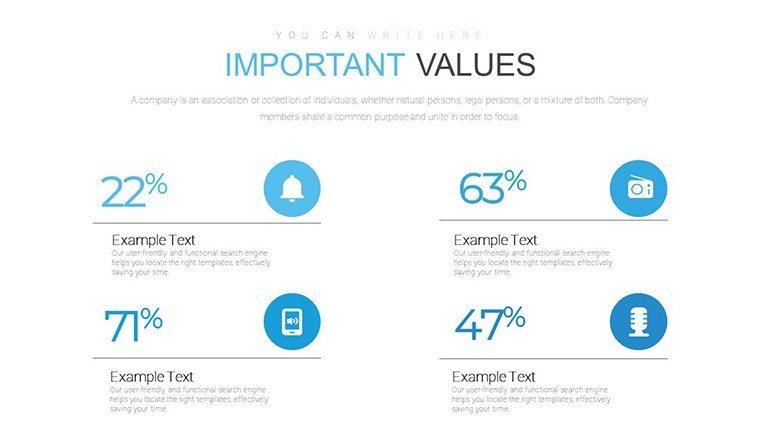
Transform complex datasets into clear, compelling visual stories that drive decisions and influence stakeholders. This professional data analysis PowerPoint charts template includes 24 meticulously designed slides with a variety of chart types engineered for maximum clarity and impact. Whether presenting quarterly results, research findings, or performance metrics, these charts help you communicate insights quickly and confidently in high-stakes environments.
Designed for professionals who need reliable, visually sophisticated tools, this template eliminates hours of manual chart building while ensuring your presentations maintain analytical depth and aesthetic polish.
Key Features
- 24 unique, fully editable slides
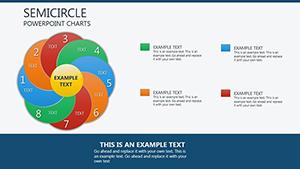
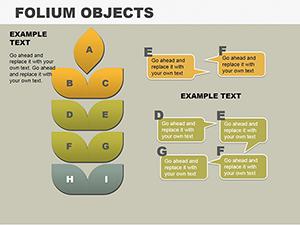
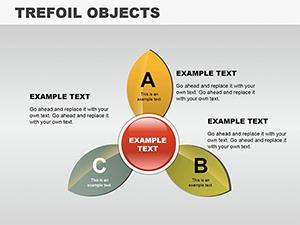
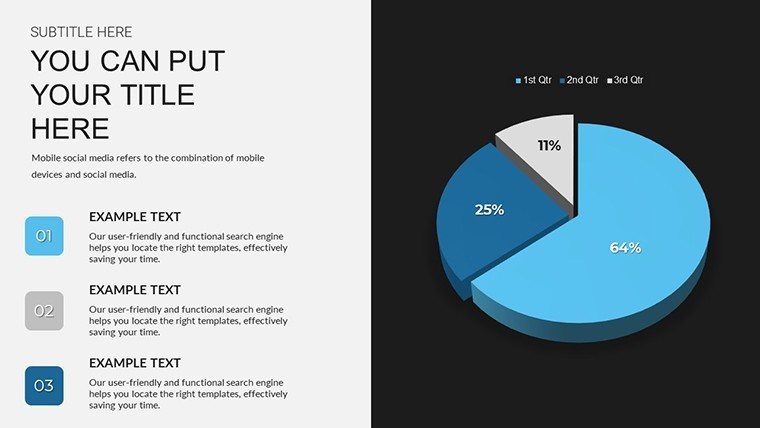
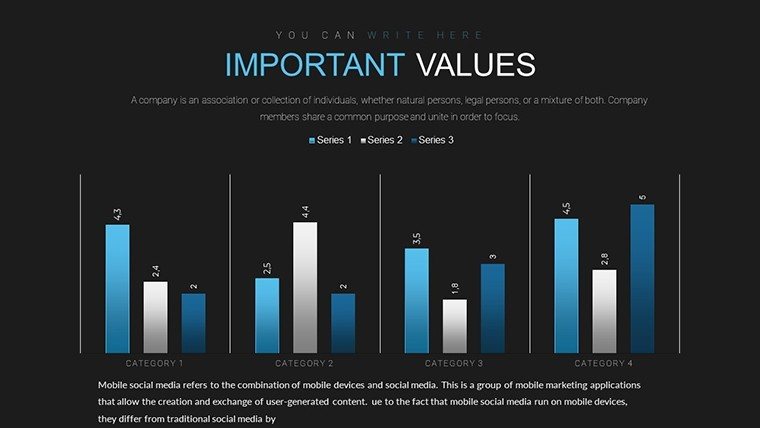
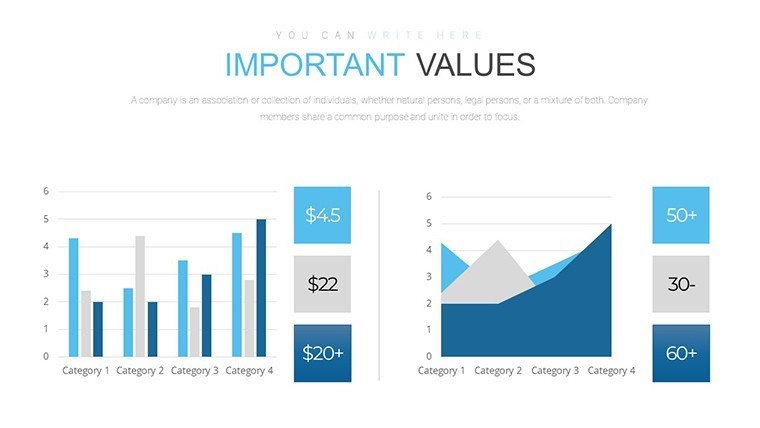
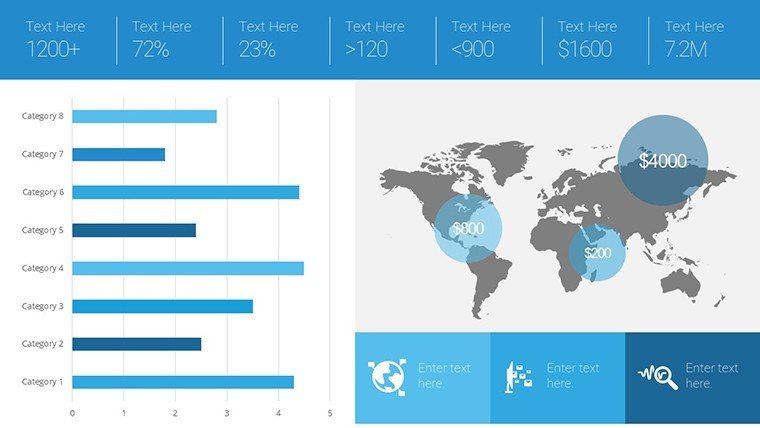
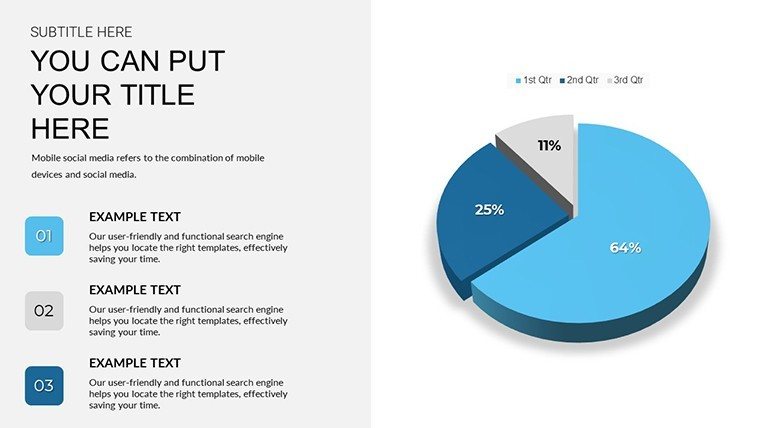
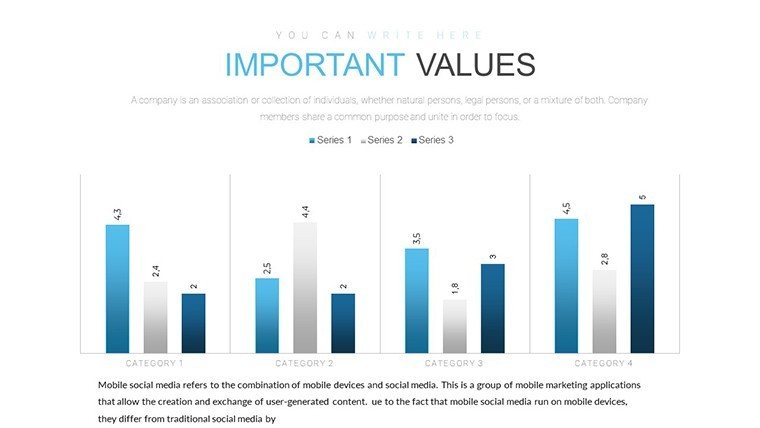
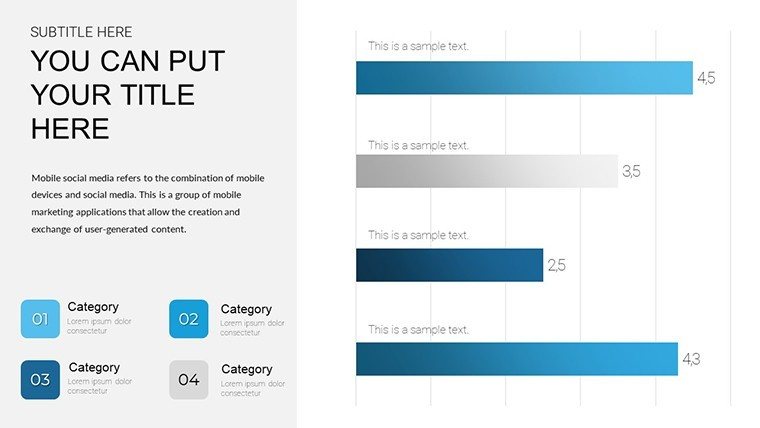
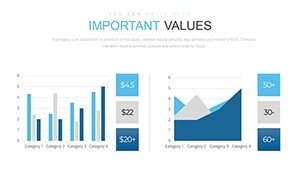
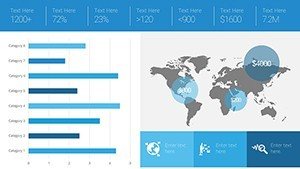
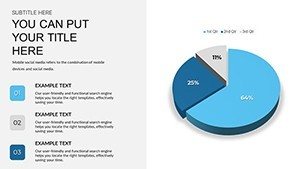
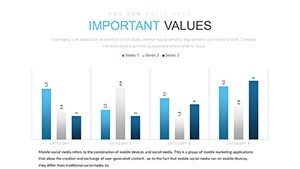
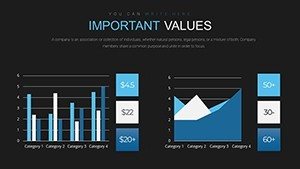
- Multiple chart types including line, bar, pie, donut, scatter, and combination charts
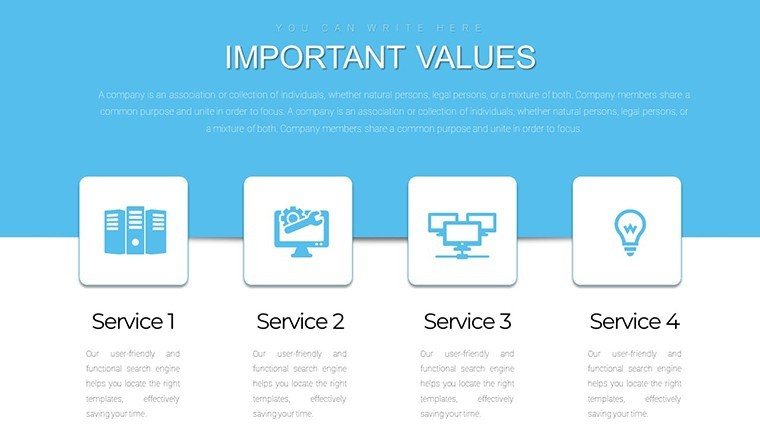
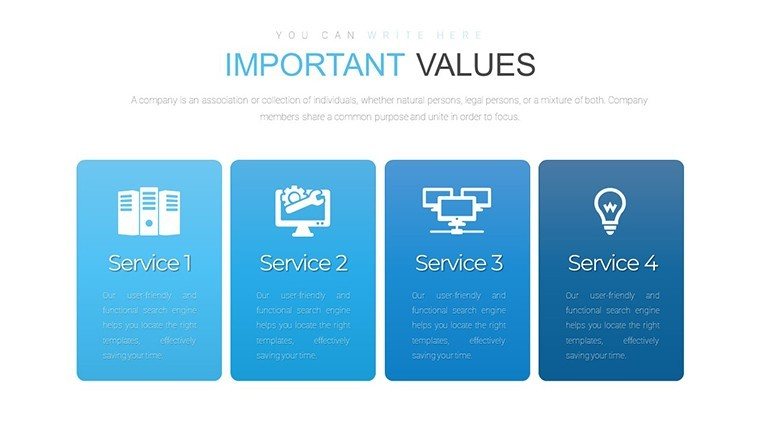
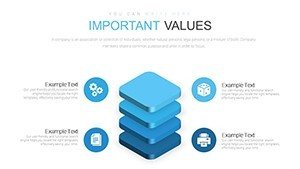
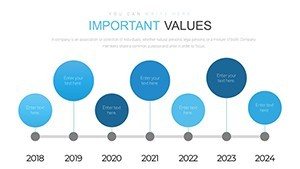
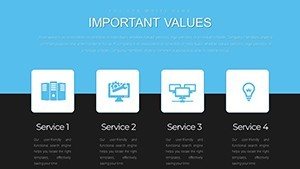
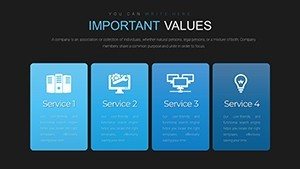
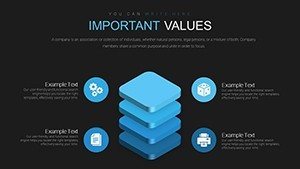
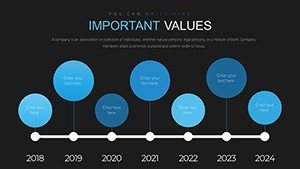
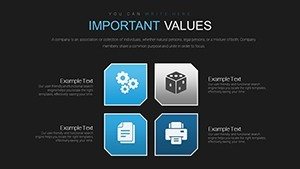
- Clean, modern design optimized for readability and professional impact
- Easy data replacement and full customization of colors, fonts, and layouts
- High-resolution graphics suitable for both screen and projector presentations
Benefits of Professional Data Visualization
Effective data presentation accelerates understanding and strengthens decision-making. This template enables you to highlight trends, comparisons, and proportions with precision, ensuring your audience focuses on the insights rather than deciphering the visuals. The balanced combination of analytical rigor and visual appeal helps maintain credibility while keeping viewers engaged throughout your presentation.
Save significant design time and deliver consistent, high-quality results across all your data-driven reports and pitches.
Professional Use Cases
Business Analytics: Present sales trends, market share, and financial performance using bar and line charts to support strategic recommendations.
Consulting Deliverables: Illustrate client performance gaps and improvement opportunities with combination charts that clearly show correlations and outcomes.
Research Presentations: Display study results and statistical relationships through scatter plots and pie charts at conferences or academic reviews.
Internal Reporting: Track departmental KPIs and operational metrics with professional visualizations that facilitate productive discussions.
How to Customize Your Charts
Open the template in Microsoft PowerPoint and select the slide that best matches your data type. Replace placeholder values with your own numbers - the charts update automatically. Adjust colors to align with your brand guidelines, modify labels for clarity, and resize elements as needed. The fully native PowerPoint construction ensures smooth editing without compatibility issues.
For optimal results, maintain consistent scaling across related charts and limit data points to essential information.
Frequently Asked Questions
What types of charts are included in this data analysis template?
The template features 24 slides with line charts, bar charts, pie and donut charts, scatter plots, and combination charts designed for various data presentation needs.
Is this template fully editable in PowerPoint?
Yes, every element is 100% editable using standard PowerPoint tools - no additional software required. You can modify data, colors, text, sizes, and layouts freely.
Which versions of PowerPoint are supported?
The template is compatible with Microsoft PowerPoint 2010 and newer, including Office 365 and the latest versions on both Windows and Mac.
Can I change the colors to match my company branding?
Absolutely - all colors are fully customizable. Simply select elements and choose from PowerPoint's color palette or enter your exact brand hex codes.
How quickly can I start using the template after purchase?
Immediately - your download link is provided instantly after purchase, allowing you to access and begin editing the template right away.