Free Decision-Making PowerPoint Charts: Streamline Choices


Type: PowerPoint Charts template
Category: Free Templates, 3D
Sources Available: .pptx
Product ID: PC00660
Template incl.: 8 editable slides
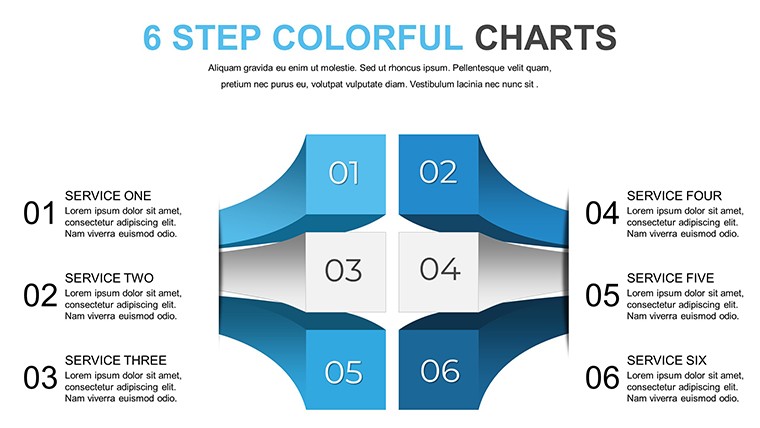
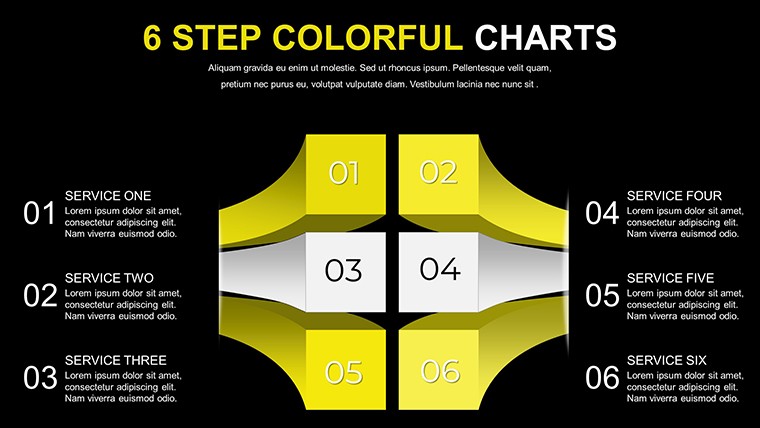
Navigating decisions in business or education often feels like piecing together a puzzle. What if you could visualize options clearly, weighing pros and cons with intuitive charts? Our Free Decision Making PowerPoint Charts Template is your go-to resource for just that. Featuring 8 editable slides packed with pie charts, bar graphs, and flowcharts, this template caters to analysts, consultants, and teachers aiming to clarify complex choices. Whether you're mapping out project strategies or teaching decision theory, these 3D-enhanced visuals bring depth to your slides, making abstract ideas concrete. Compatible with PowerPoint and free to download, it eliminates design barriers, letting you focus on insights. From startup brainstorming to classroom lessons, transform overwhelming data into actionable paths - because better visuals lead to smarter decisions, and this template puts that power in your hands without costing a dime.
Essential Features for Clear Visualization
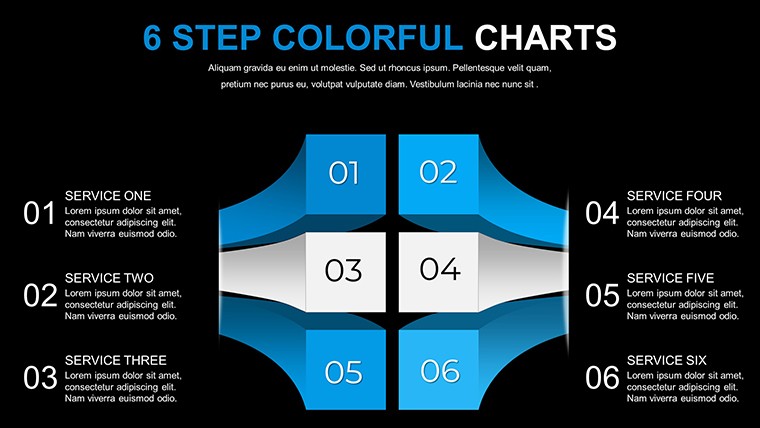
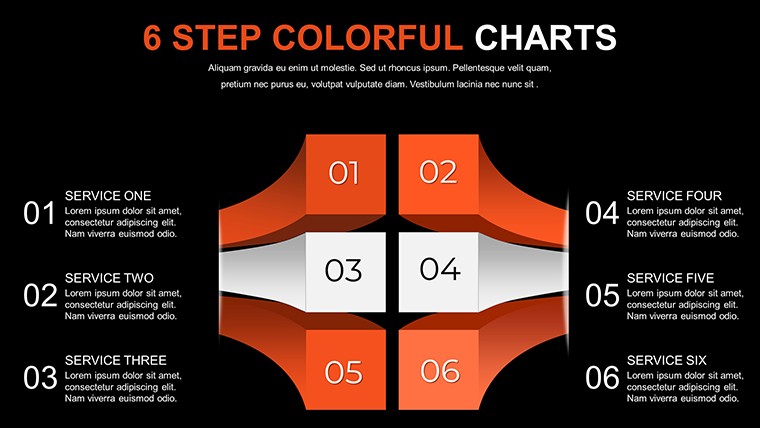
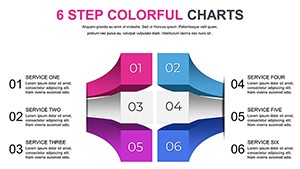
At its core, this template offers a suite of tools designed for efficiency. Each slide is pre-formatted with high-quality 3D elements that add a professional touch without complexity. Customize fonts, colors, and sizes effortlessly to match your theme, ensuring brand consistency. For example, use the pie charts to break down market shares or budget allocations, with segments that adjust automatically to your inputs.
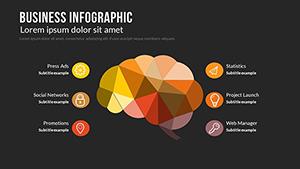
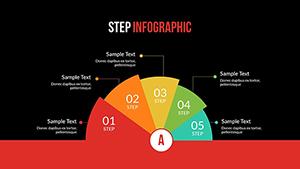
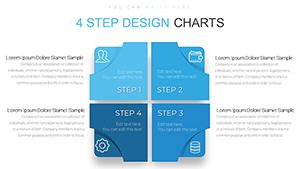
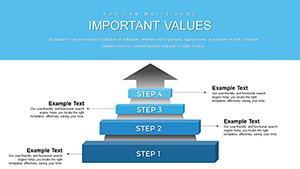
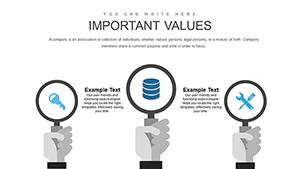
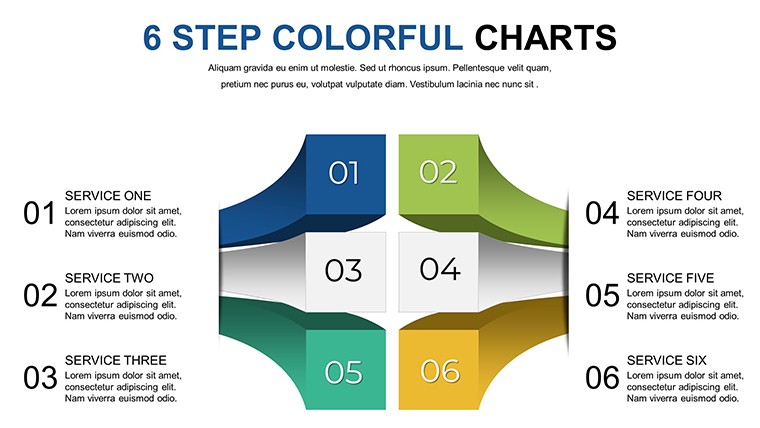
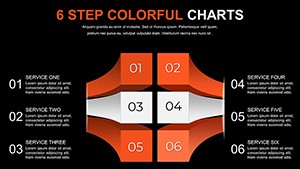
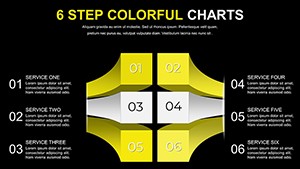
- Varied Chart Types: Includes pie, bar, and flowcharts for diverse decision scenarios.
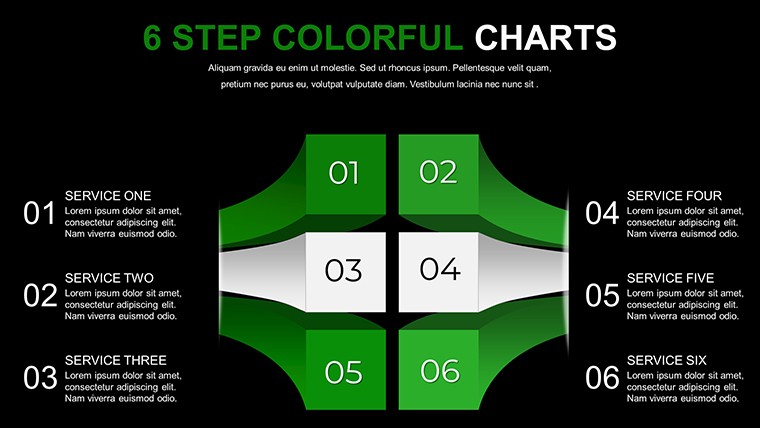
- 3D Enhancements: Adds depth for more engaging visuals, ideal for virtual presentations.
- User-Friendly Instructions: Built-in tips guide even beginners through setup.
- Accessibility Features: Color-blind friendly options and alt text placeholders for inclusivity.
Drawing from cognitive science principles, like those in Daniel Kahneman's work on decision-making, these charts minimize bias by presenting data neutrally, fostering objective analysis.
Practical Benefits and Use Cases
Envision a consultant using these flowcharts to outline risk assessments for clients, mirroring real-world applications in firms adhering to ISO standards for quality management. Educators can employ bar graphs to compare ethical dilemmas in case studies, enhancing student engagement as per pedagogical research from the Journal of Business Ethics. The free aspect democratizes access, allowing small businesses to compete with polished visuals typically reserved for enterprises.
Benefits include accelerated preparation - users save up to 40% time versus scratch builds - and improved comprehension, with visuals boosting retention by 65% according to studies. In architecture contexts, adapt for site selection decisions, visualizing factors like cost versus sustainability, aligning with LEED certification visuals.
- Strategic Planning: Map goals and alternatives in team meetings.
- Project Updates: Track progress with timelines and decision trees.
- Educational Workshops: Illustrate concepts like SWOT analysis interactively.
Unlike standard PowerPoint defaults, this template's pre-designed harmony avoids mismatched elements, ensuring a cohesive narrative flow.
Easy Customization and Integration Tips
Download and dive in: Open in PowerPoint, replace placeholders with your data, and resize as needed. Link to Excel for real-time updates, perfect for dynamic scenarios. Pro tip: Animate transitions to reveal decisions step-by-step, building suspense in pitches. For urban planning pitches, customize flowcharts to show approval processes, incorporating AIA guidelines for visual aids.
Additional advice: Balance visuals with minimal text, use consistent color palettes for branding, and test on multiple devices. This approach echoes design best practices from UX experts, ensuring your decisions are not just made but memorably presented.
Unlock Informed Decisions Today
For trainers and analysts alike, this free template builds authority by delivering clear, trustworthy visuals. Its versatility ensures it evolves with your needs, from one-off reports to ongoing training. Don't let indecision stall progress - grab this decision-making powerhouse now and chart your path to success.
Frequently Asked Questions
- Are the charts fully editable?
- Yes, adjust all elements including data, colors, and layouts to fit your specific decisions.
- Does it work on older PowerPoint versions?
- Compatible with PowerPoint 2010 and later, plus Google Slides for cloud-based editing.
- Is there a limit on usage?
- No limits - use freely for personal, educational, or commercial purposes.
- How do I add my own data?
- Simply edit the chart data tables directly within PowerPoint.
- Can I incorporate 3D effects?
- Pre-included, with options to toggle or enhance for emphasis.
- What if I need more slides?
- Duplicate existing ones and customize further for expansion.