Top Gear System PowerPoint Charts Template - Presentation Designs


Type: PowerPoint Charts template
Category: Process, Illustrations
Sources Available: .pptx
Product ID: PC00655
Template incl.: 20 editable slides
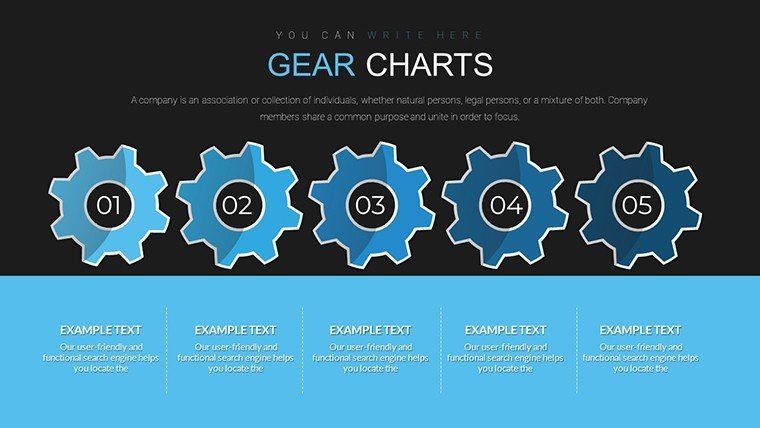
Envision your next board meeting where intricate processes unfold like a well-oiled machine, with gear-infused charts syncing every detail. The Top Gear System PowerPoint Charts Template delivers this precision through 20 editable slides dedicated to processes and illustrations. Geared toward business analysts, educators, and consultants, it simplifies complex workflows - think manufacturing cycles or project timelines - into synchronized visuals. Rooted in engineering principles similar to those in ASME standards for mechanical designs, this template helps you demonstrate interoperability, like gears meshing in a system. Seamlessly works with PowerPoint and Google Slides, it minimizes design hurdles, letting you concentrate on insights that propel your audience forward, fostering better understanding and collaboration in dynamic environments.
Experience Unparalleled Process Visualization
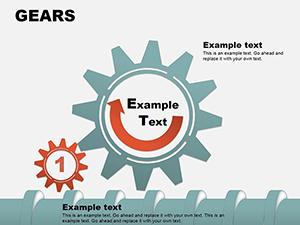
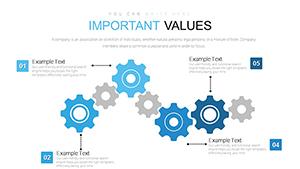
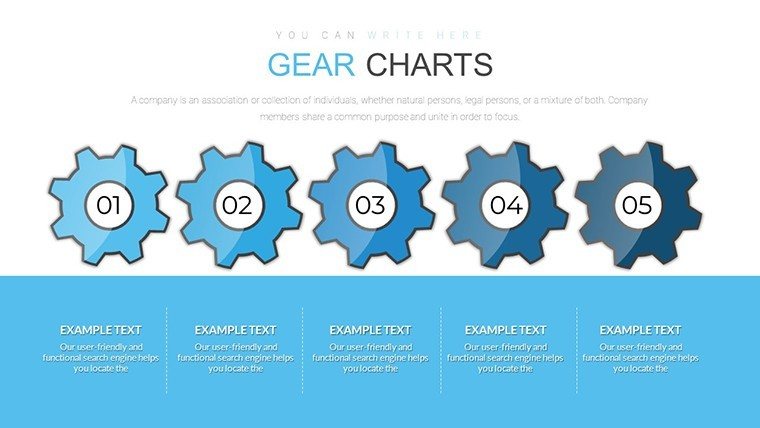
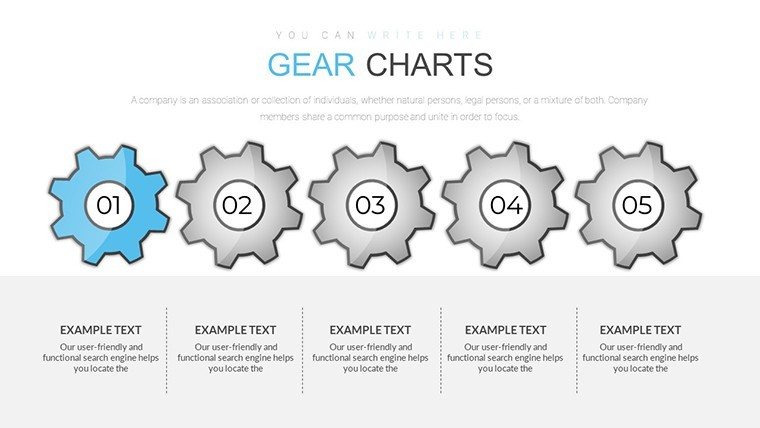
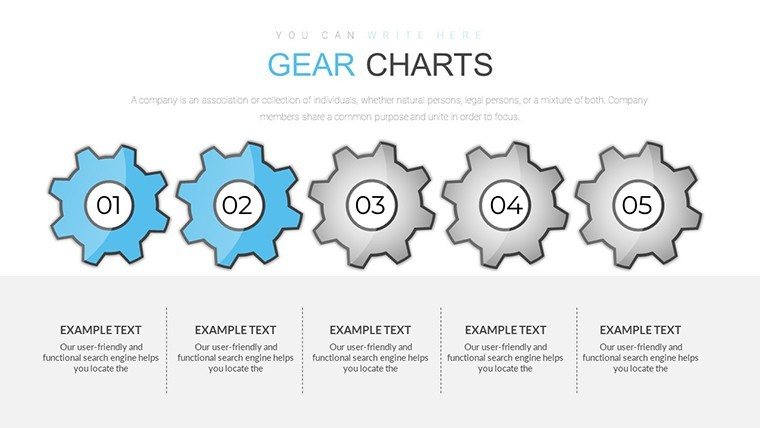
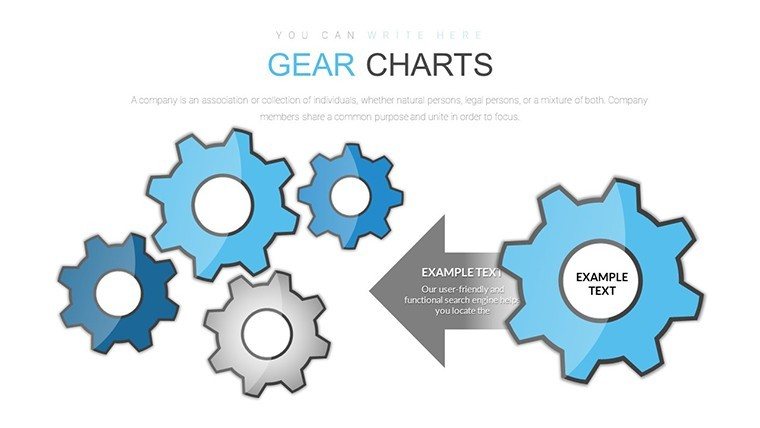
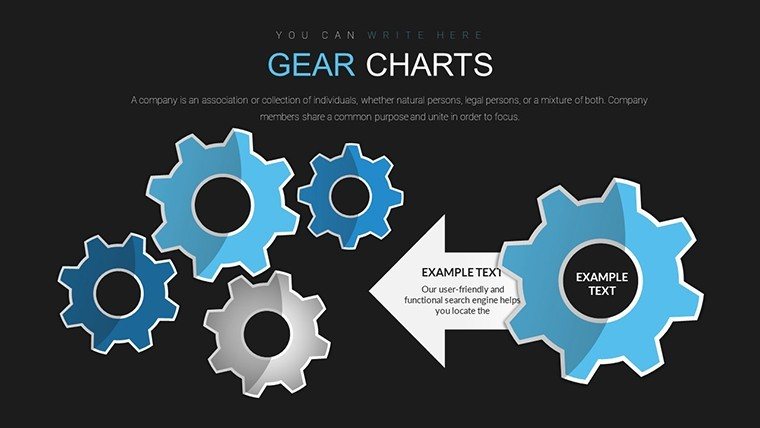
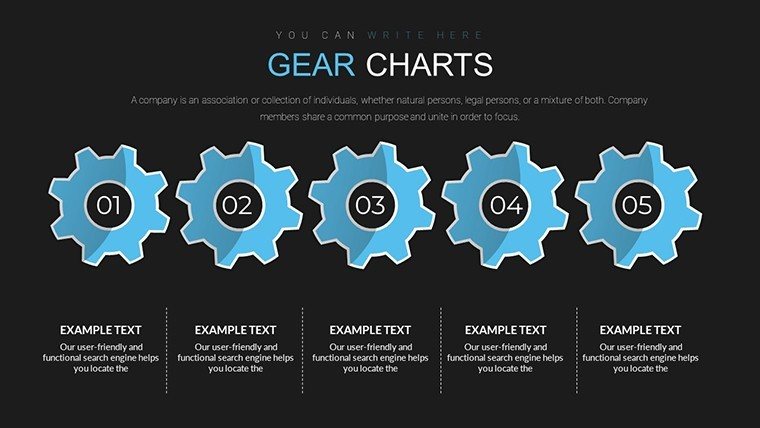
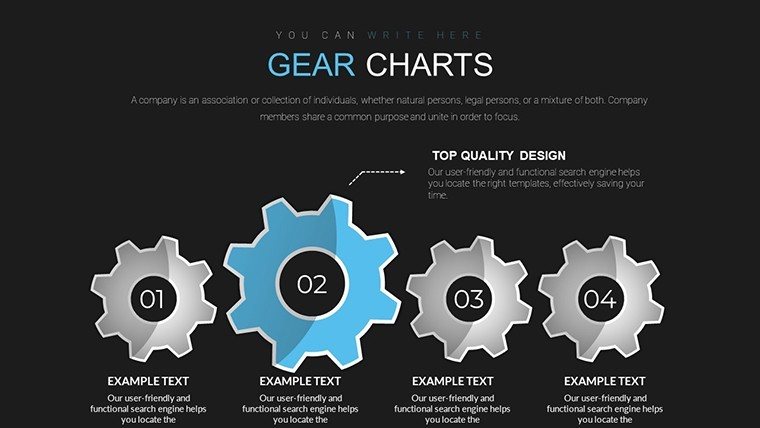
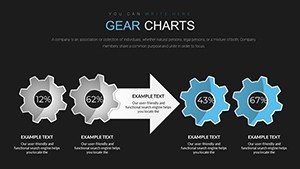
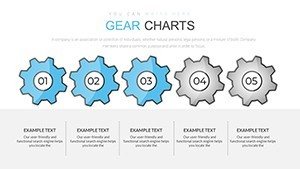
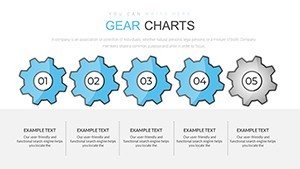
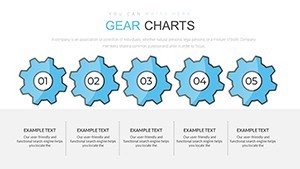
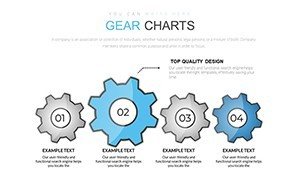
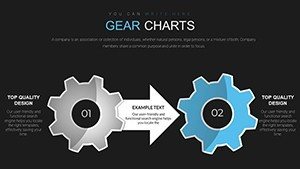
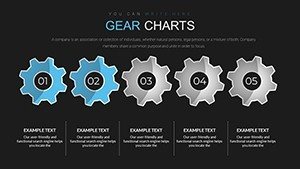
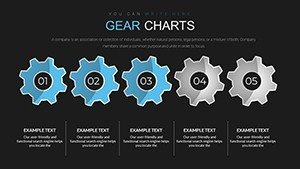
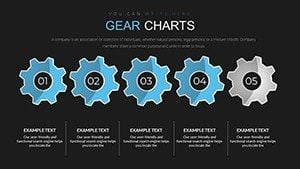
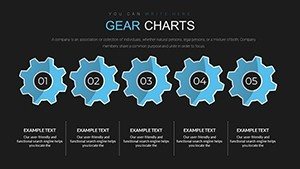
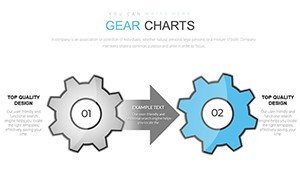
At its essence, this template uses gear motifs to symbolize interconnected steps, turning static data into narrative-driven stories. Slides feature layered gears for multi-phase processes, ideal for depicting supply chain logistics where each cog represents a stage, informed by real operations in companies like Toyota's lean manufacturing.
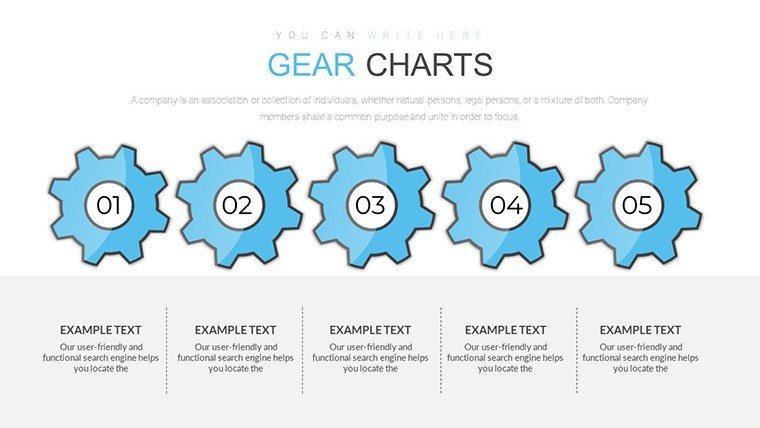
- Gear Diagrams: Illustrate dependencies with rotating elements.
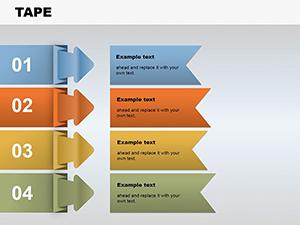
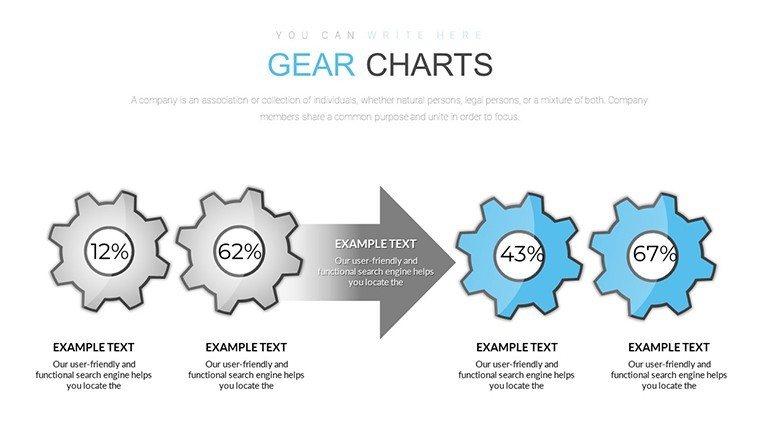
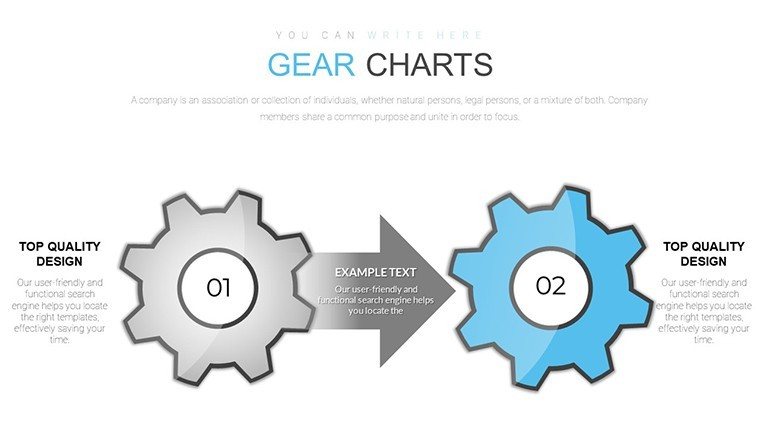
- Process Flows: Linear or cyclic layouts for timelines.
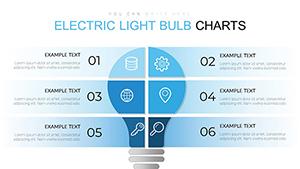
- Illustration Sets: Custom icons for mechanical themes.
Such designs leverage visual psychology, as per Gestalt principles, to group related info, enhancing recall in presentations.
Tailor with Versatile Customization
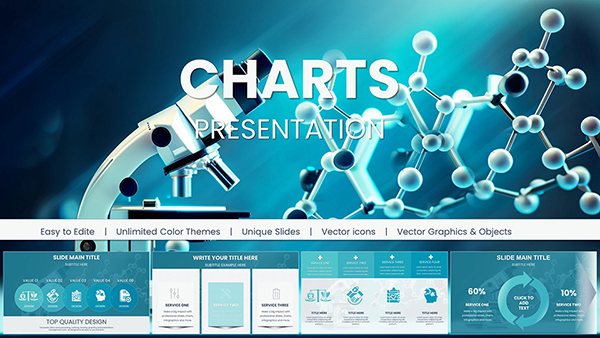
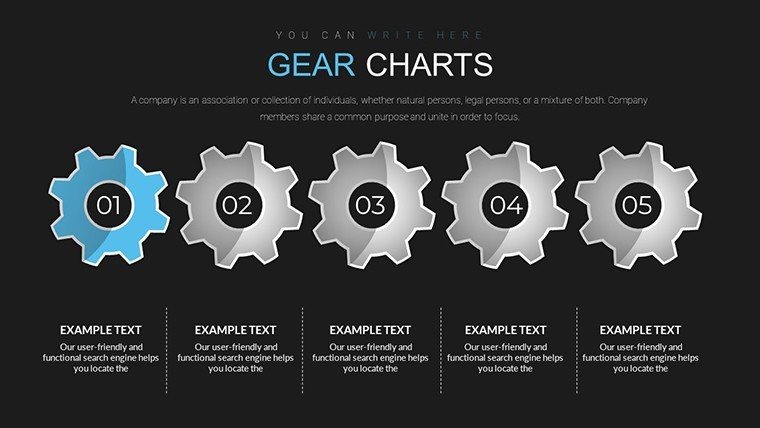
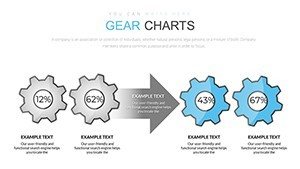
Full control over elements means effortless branding - shift gear colors for emphasis, font tweaks for hierarchy, or layout reshuffles for focus. Animation-ready, add spins to simulate motion, differentiating from flat defaults. Analysts can embed metrics for KPI tracking, while trainers animate steps for workshops.
Vector quality ensures no pixelation, building trust in professional outputs.
Captivate in Diverse Scenarios
From corporate strategies to classroom modules, apply it broadly. Managers map operational efficiencies, akin to Six Sigma case studies; educators diagram scientific processes like energy transfers.
- Step 1: Map Process - Outline stages on gear slides.
- Step 2: Add Data - Input specifics into cogs.
- Step 3: Animate - Bring mechanics to life.
- Step 4: Refine - Test for smooth flow.
This method surpasses basics by offering thematic unity, halving prep time.
Key Features for Seamless Delivery
Integration with tools like Excel for live data, plus animation for engagement, makes it indispensable.
Elevate Your Game - Download Today
Gear up for impactful sessions. Secure this template now to synchronize your ideas perfectly.
FAQ
- How do gear animations work?
- Built-in options allow rotational effects for dynamic process shows.
- Compatible with Google Slides?
- Yes, straightforward import for team edits.
- Suitable for what fields?
- Business operations, engineering, education for process mapping.
- Can I integrate real data?
- Yes, link to spreadsheets for updates.
- Animation customization level?
- Full, from speed to triggers.