Cyclic Gears PowerPoint Charts Template


Type: PowerPoint Charts template
Category: Cycle
Sources Available: .pptx
Product ID: PC00647
Template incl.: 20 editable slides
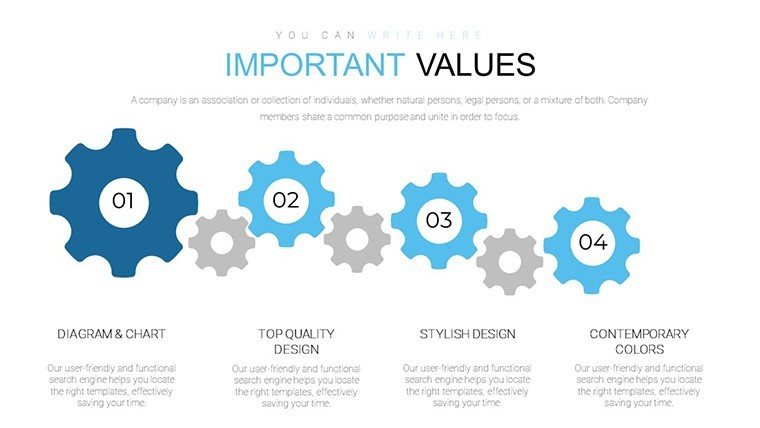
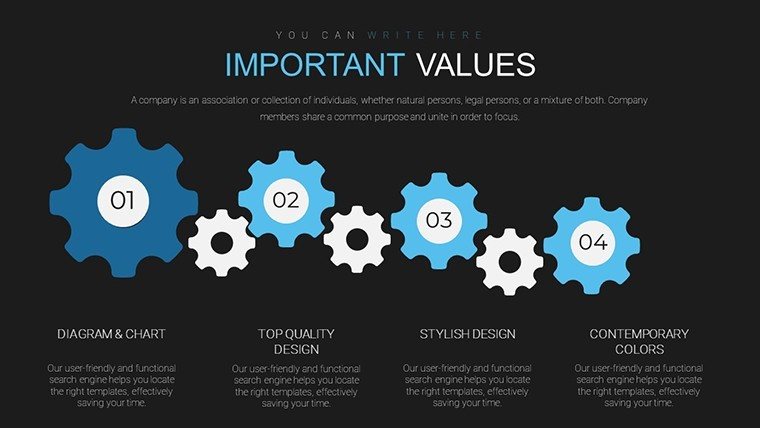
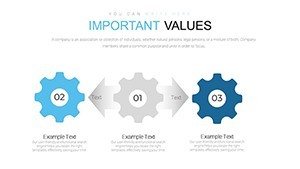
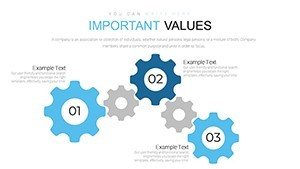
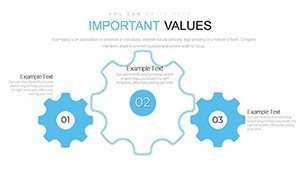
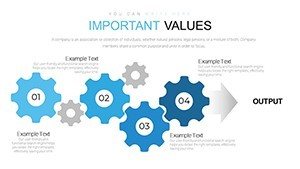
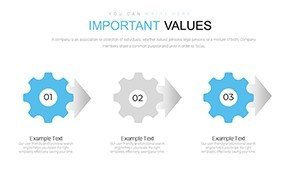
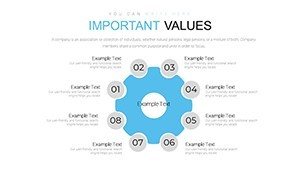
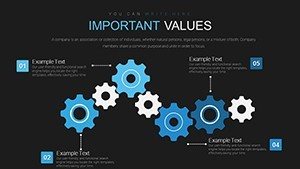
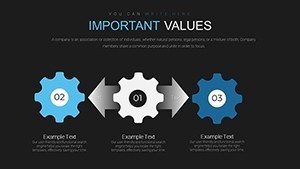
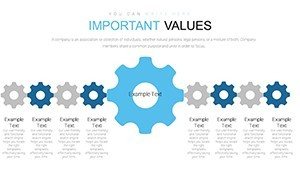
Envision your next presentation as a well-oiled machine, where ideas mesh seamlessly like interlocking gears, driving your message forward with precision and energy. The Cyclic Gears PowerPoint Charts Template is engineered for those who tackle complex systems - project managers charting workflows, educators explaining ecosystems, or analysts modeling business cycles. Boasting 20 editable slides, this template uses gear motifs to represent synergy and progression, turning abstract concepts into tangible visuals. Rooted in mechanical engineering principles akin to those in ASME standards, it provides an authoritative framework for demonstrating interdependencies. Whether you're outlining supply chain dynamics or team collaboration models, this tool helps you craft narratives that resonate, saving time on design while amplifying comprehension. Step into a realm where your slides not only inform but also motivate action, blending professional rigor with creative flair.
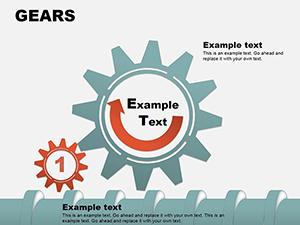
Exploring Interconnected Visuals
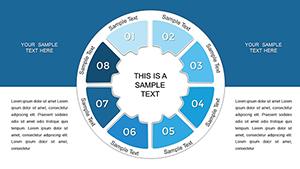
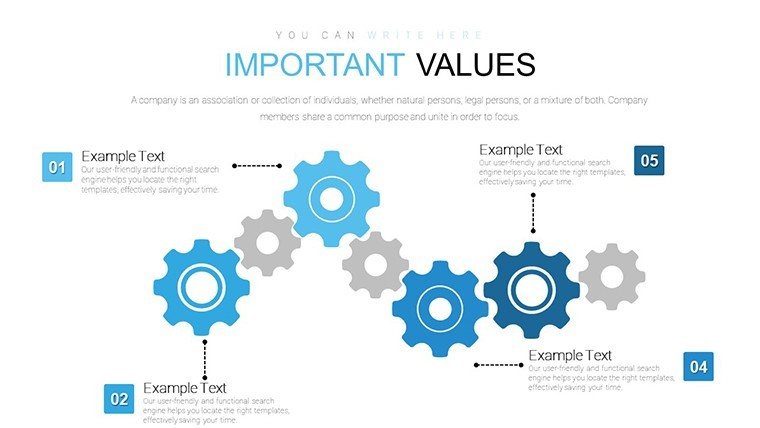
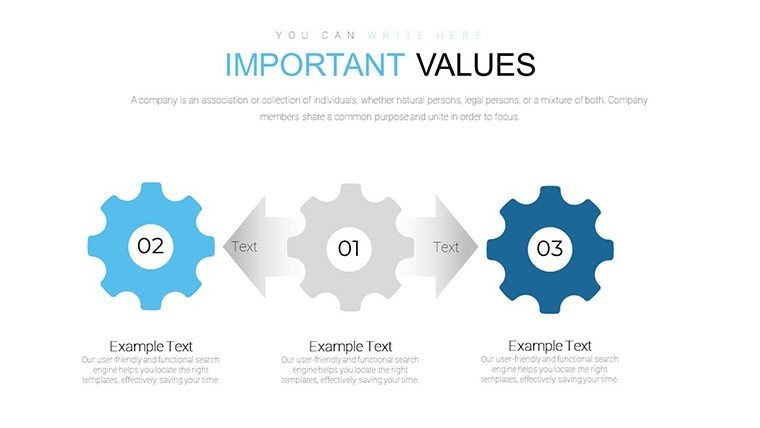
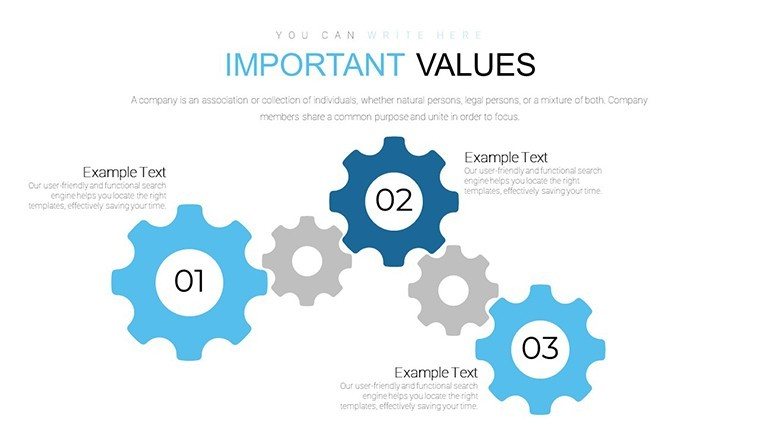
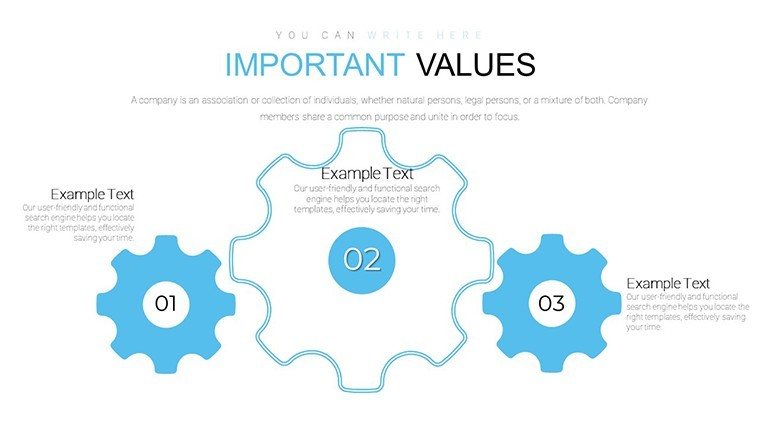
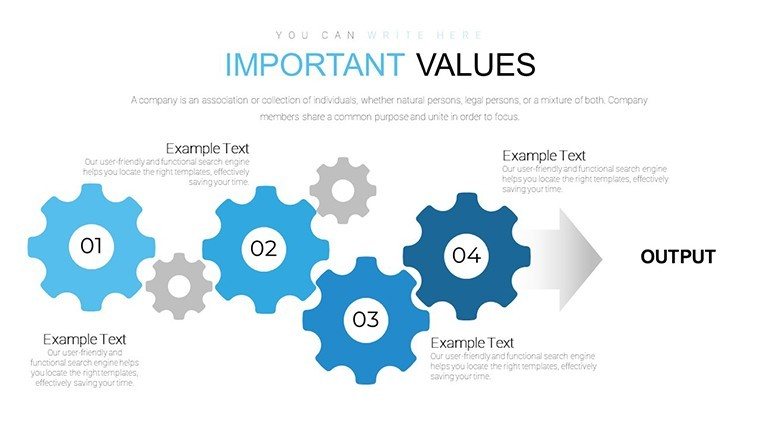
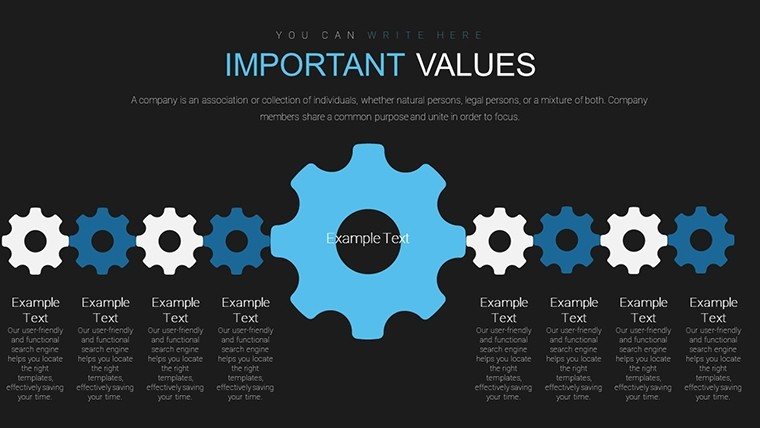
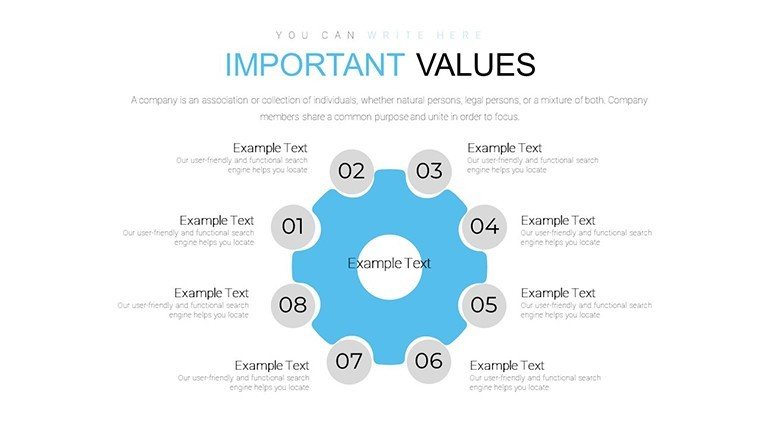
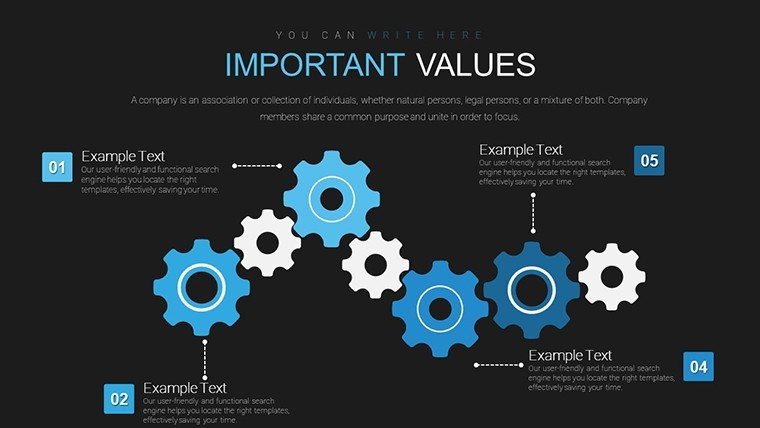
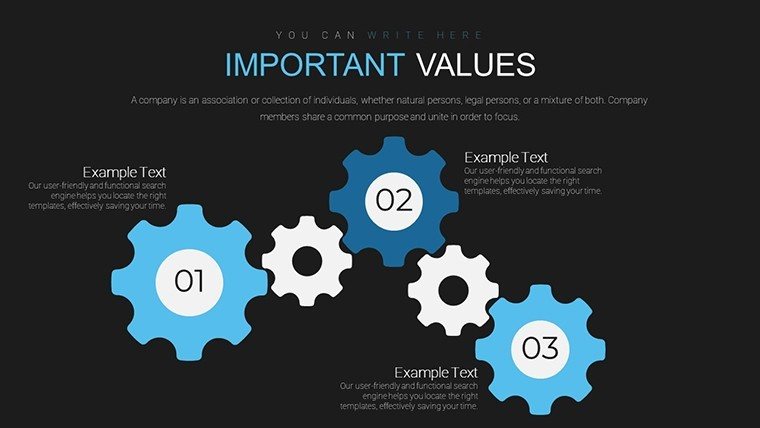
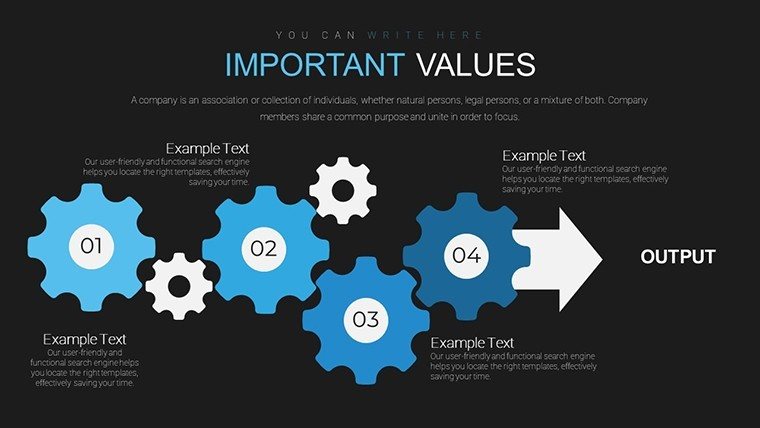
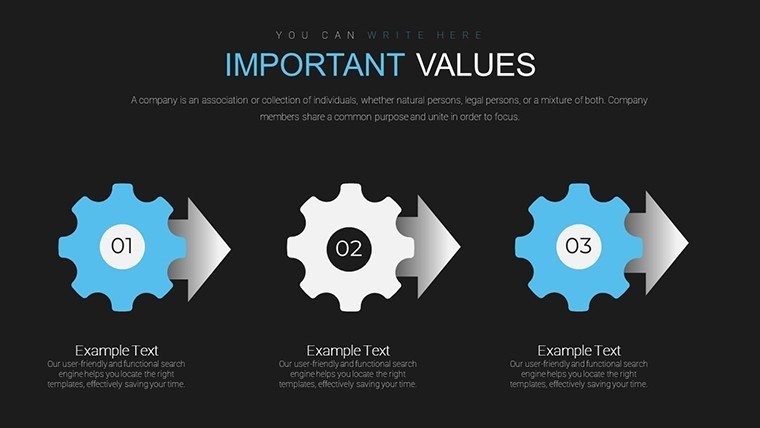
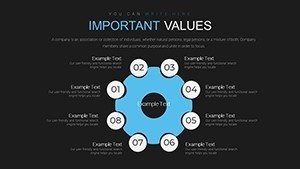
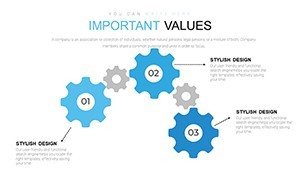
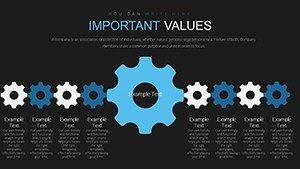
Gears symbolize motion and connection, making them ideal for cyclic processes like feedback loops or iterative developments. This template's designs allow for multi-gear configurations, illustrating how variables influence each other, such as in a DevOps pipeline where code deployment cycles are visualized.
Essential Features for Dynamic Presentations
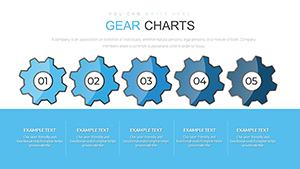
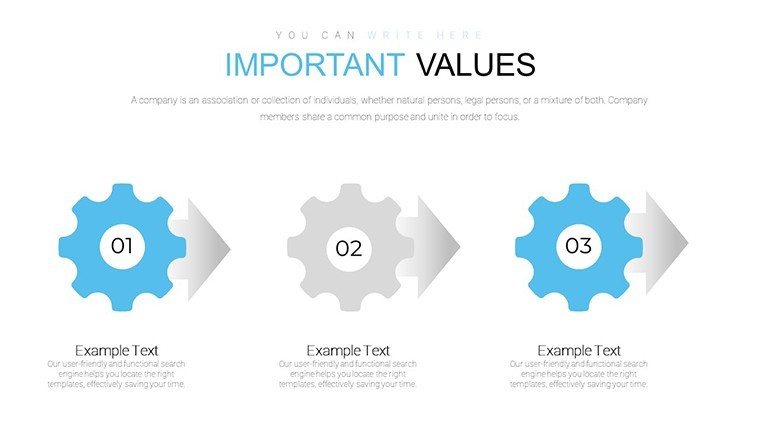
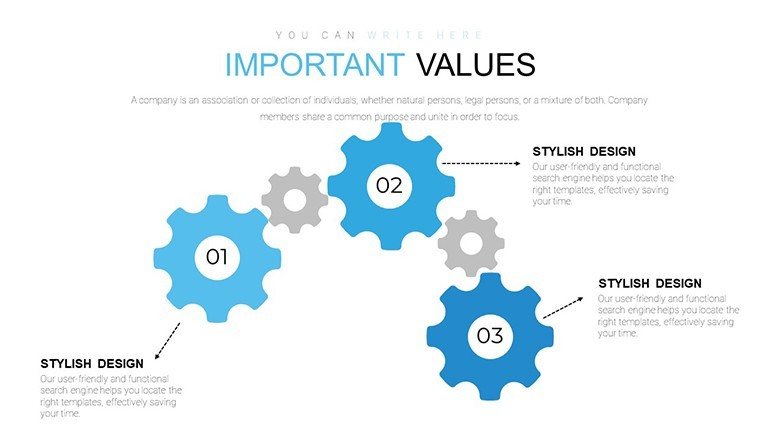
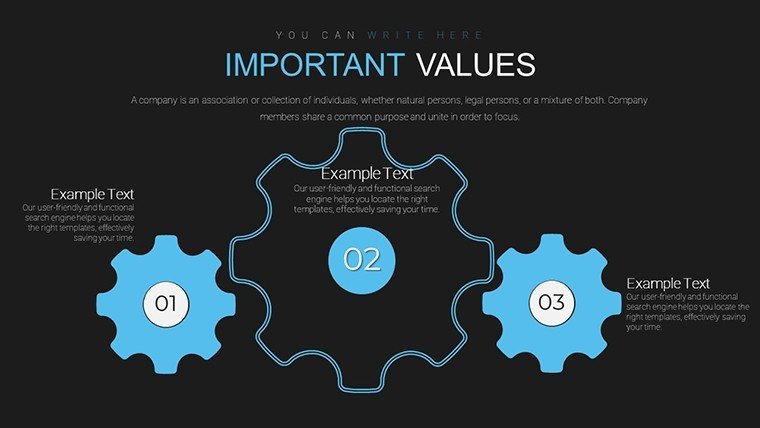
Each slide offers rotatable gears with adjustable sizes and colors, enabling precise data mapping. From single-gear overviews to complex assemblies, the options cater to varied complexity levels, all in high-resolution for professional outputs.
- Interactive Elements: Add animations to simulate gear movement, enhancing engagement.
- Customization Depth: Modify tooth counts, labels, and connectors to fit your data story.
- Broad Compatibility: Integrates with PowerPoint ecosystems, including add-ins for advanced features.
- Thematic Versatility: Adapt for technical or conceptual uses with ease.
These attributes draw from trusted sources like the Project Management Institute, ensuring your visuals align with best practices for clarity and impact.
Practical Applications in Professional Settings
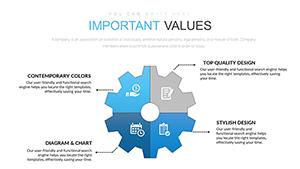
Business leaders can use gears to depict organizational synergies, like how sales and operations interlock for efficiency. In education, illustrate biological cycles, such as the water cycle, making lessons vivid. Data analysts might model economic gears, showing inflation's ripple effects, inspired by case studies from the World Economic Forum.
Implementing the Template Step-by-Step
- Download and launch in PowerPoint.
- Choose a gear layout and populate with your metrics.
- Tweak visuals: colors for emphasis, sizes for hierarchy.
- Incorporate text overlays for explanations.
- Animate for sequential reveals.
- Review and refine for audience fit.
This process meshes with agile workflows, allowing iterative improvements. Compared to default shapes, these pre-engineered gears offer superior aesthetics and functionality.
Advantages Over Standard Tools
Basic PowerPoint lacks the thematic depth of this template, which incorporates motion principles to reduce misinterpretation. Users experience heightened persuasion, as seen in project pitches where gear visuals clarified dependencies, leading to faster approvals. Pro tips: Use neutral palettes for technical audiences, or vibrant ones for creative sessions, adhering to color theory from Adobe's design guides.
Integrate with tools like Visio for diagram imports, enhancing workflow. Our commitment shines through alignments with engineering standards, building trust in your content.
Optimization Techniques
Elevate by embedding data links or using gears for timelines, drawing from Gantt chart evolutions. For virtual presentations, ensure animations sync with narration for immersive experiences.
Gear Up Your Presentations
Time to shift into high gear - download this Cyclic Gears PowerPoint Charts Template and propel your ideas with mechanical precision. Customize and captivate; your next breakthrough awaits.
FAQ
Can I animate the gears?
Yes, built-in animations allow for realistic rotation and interaction.
Are the slides fully customizable?
Every aspect, from colors to layouts, can be tailored.
What software is required?
Microsoft PowerPoint or compatible viewers.
Suitable for non-technical users?
Absolutely, with intuitive drag-and-drop features.
How many gear configurations?
Multiple, from simple to complex assemblies across 20 slides.
Commercial license included?
Yes, for professional and educational use.