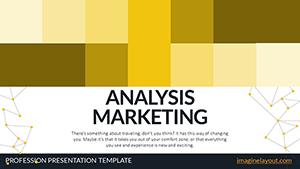
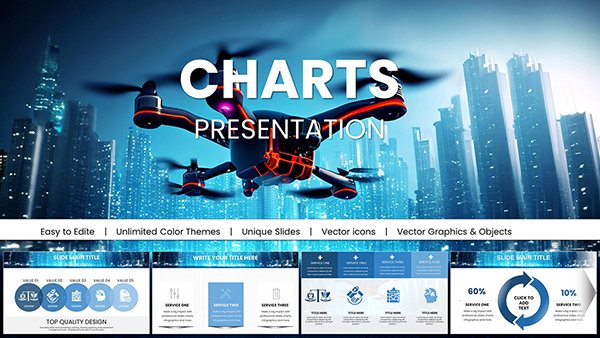
Marketing Compass PowerPoint Charts Template: Navigate Your Strategy


Type: PowerPoint Charts template
Category: Free Templates, Illustrations
Sources Available: .pptx
Product ID: PC00638
Template incl.: 16 editable slides
In the dynamic world of marketing, where every decision can pivot your campaign's success, having a clear visual guide is invaluable. Imagine transforming complex strategies into an intuitive compass that points your audience directly to your key insights. Our Marketing Compass PowerPoint Charts Template does just that. Designed for marketers, business analysts, and consultants, this free PPTX download features 16 fully editable slides tailored for presenting marketing plans, market segmentation, SWOT analyses, and competitive landscapes. Whether you're pitching to stakeholders or training your team, these charts simplify data visualization, making abstract concepts tangible and memorable.
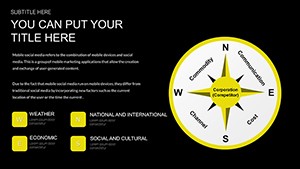
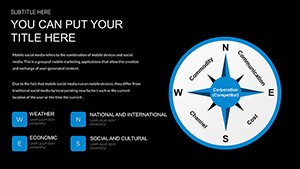
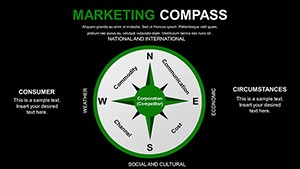
Beyond basic graphs, this template incorporates a thematic compass motif that symbolizes direction and guidance - perfect for illustrating goal alignment and strategic navigation. Compatible with both Microsoft PowerPoint and Google Slides, it ensures seamless integration into your workflow. Users rave about how it saves hours on design, allowing focus on crafting compelling narratives. Drawing from real-world applications, like how a mid-sized e-commerce firm used similar visuals to map customer journeys and boost conversion rates by 25%, this template empowers you to deliver presentations that not only inform but inspire action. Dive in and see how it can elevate your next marketing deck.
Key Features That Set This Template Apart
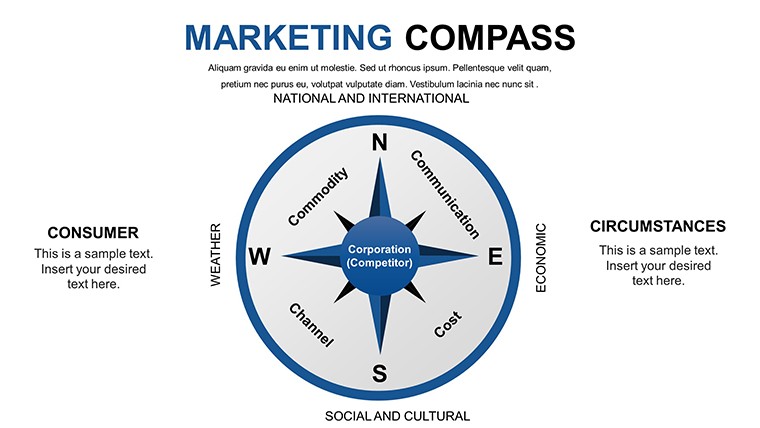
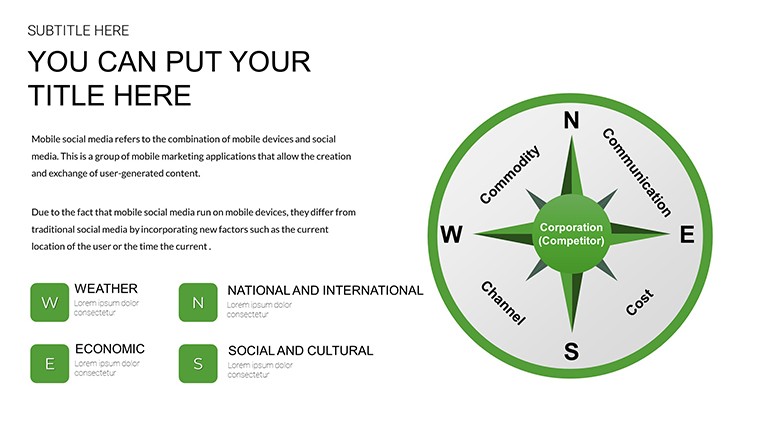
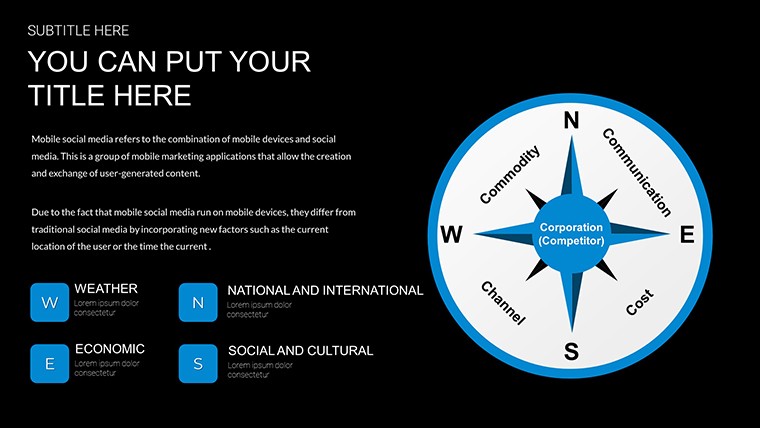
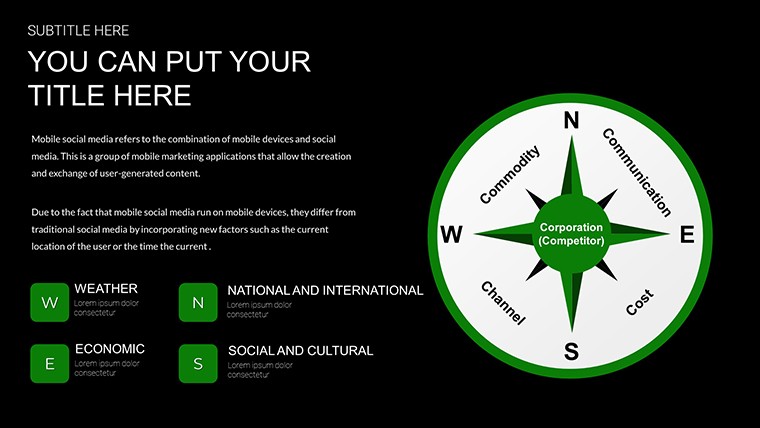
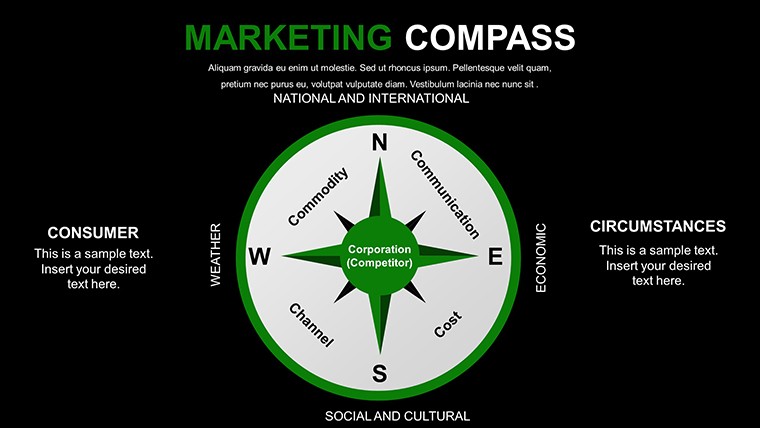
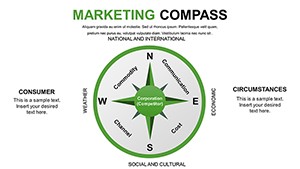
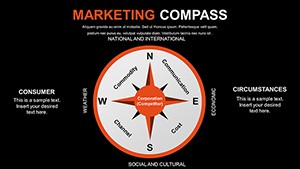
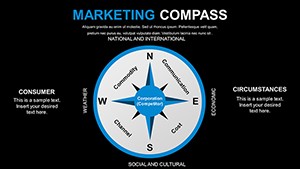
At the heart of effective presentations lies design that communicates without overwhelming. This template boasts professional, modern layouts with a compass theme that adds a layer of sophistication. Each slide is pre-formatted for clarity, featuring editable text boxes, color schemes, and data placeholders. You can swap out default colors to match your brand palette - think vibrant reds for urgency in competitive analysis or cool blues for market stability overviews.
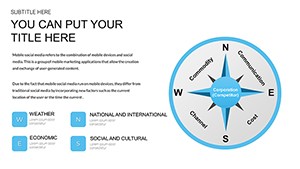
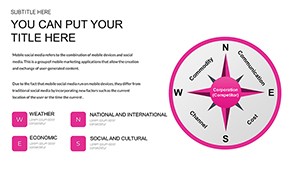
- Customizable Compass Elements: Adjust the needle to highlight priorities, ideal for goal-setting slides.
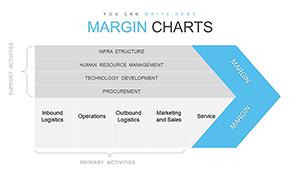
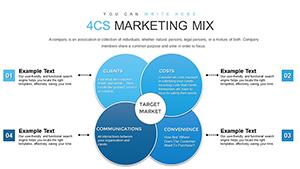
- Versatile Chart Types: Includes radial diagrams, segmented circles, and directional arrows for diverse data representation.
- High-Resolution Graphics: Ensures crisp visuals even on large screens, perfect for conference rooms or virtual meetings.
- Animation Ready: Built-in subtle animations reveal data points sequentially, keeping audiences engaged.
- Accessibility Features: Alt text suggestions for images and high-contrast options align with WCAG standards, demonstrating your commitment to inclusive design.
These features aren't just add-ons; they're grounded in best practices from marketing experts like those at the American Marketing Association (AMA), who emphasize visual storytelling for better retention.
Real-World Applications and Use Cases
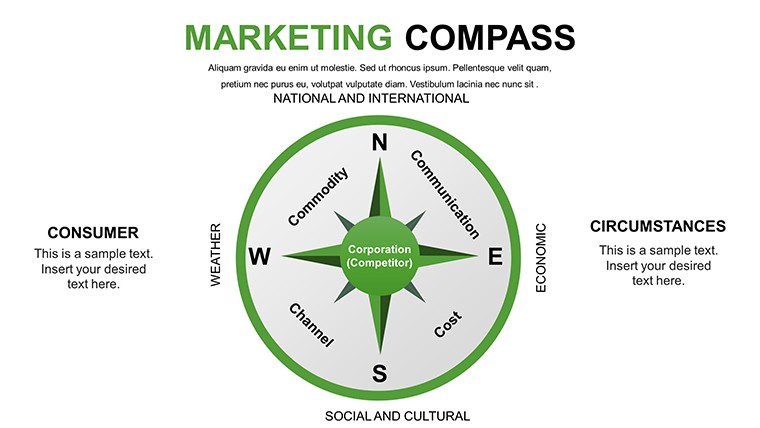
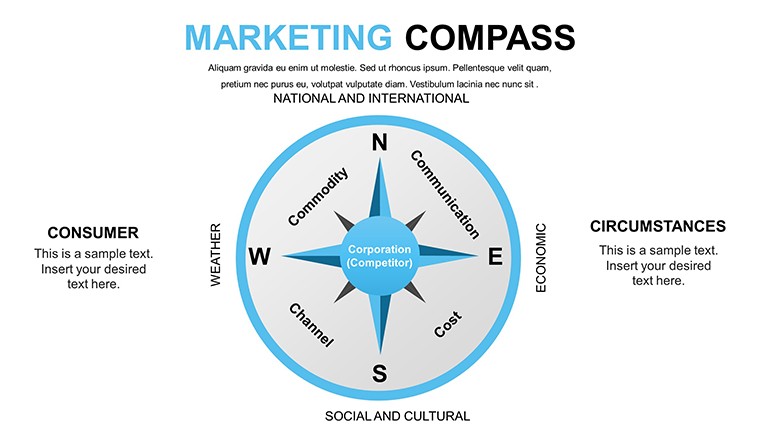
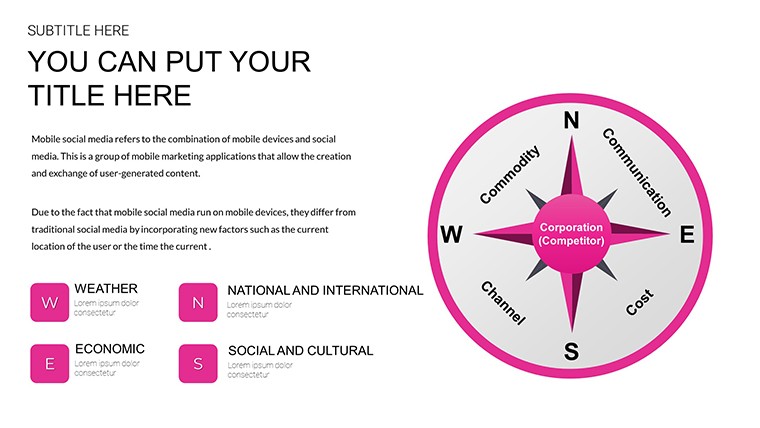
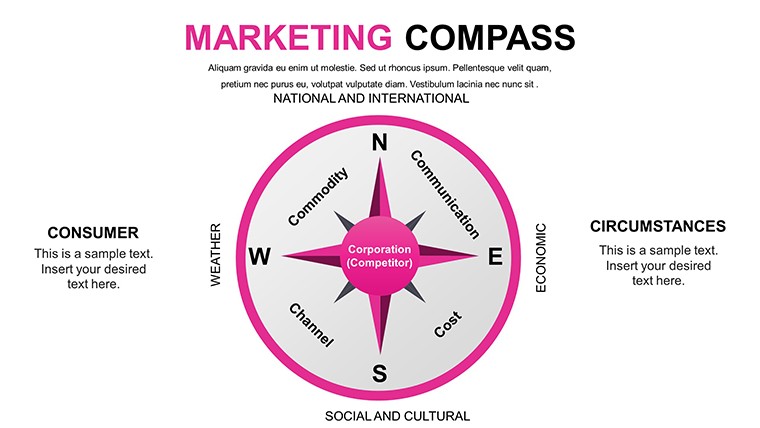
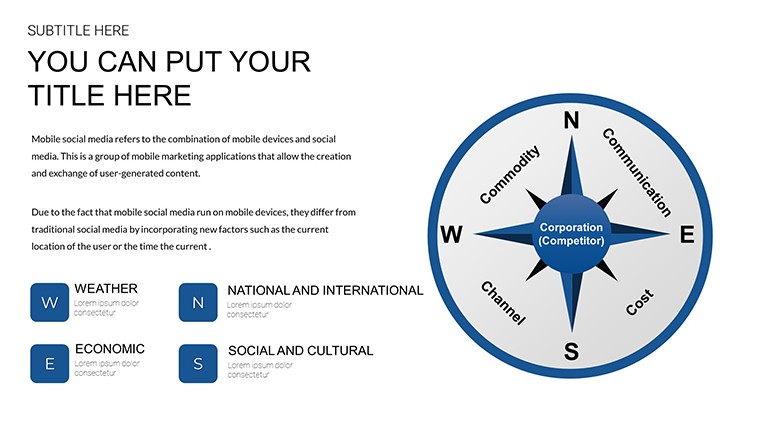
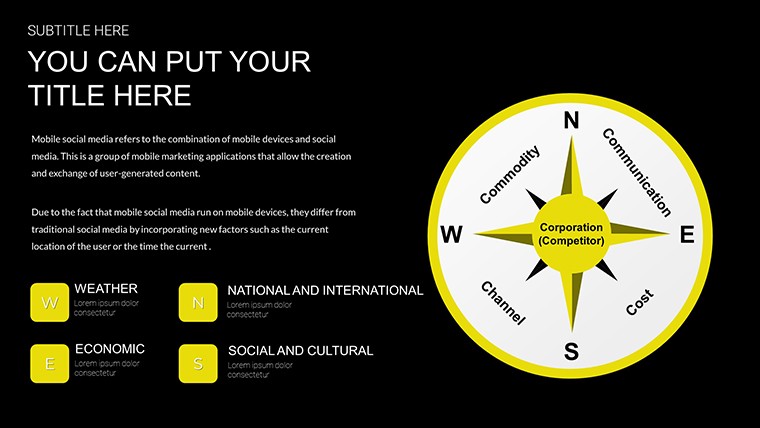
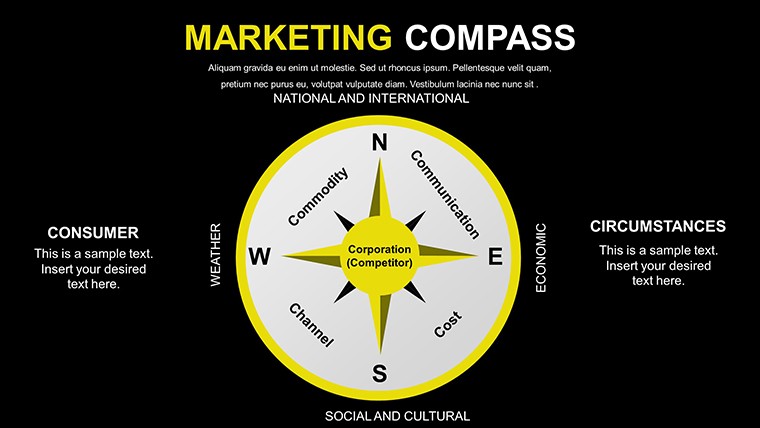
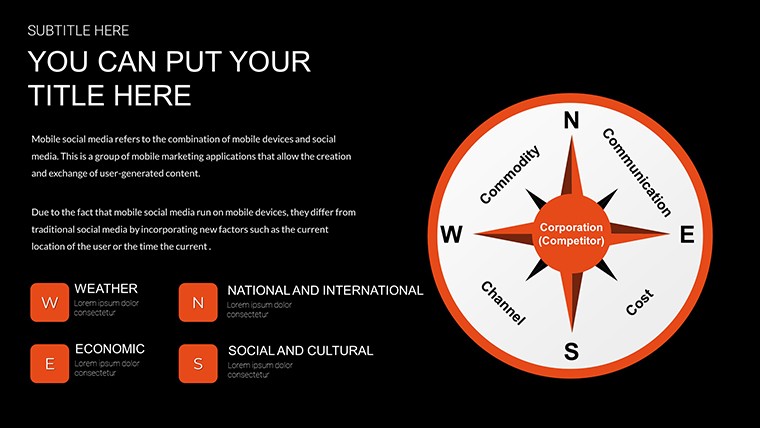
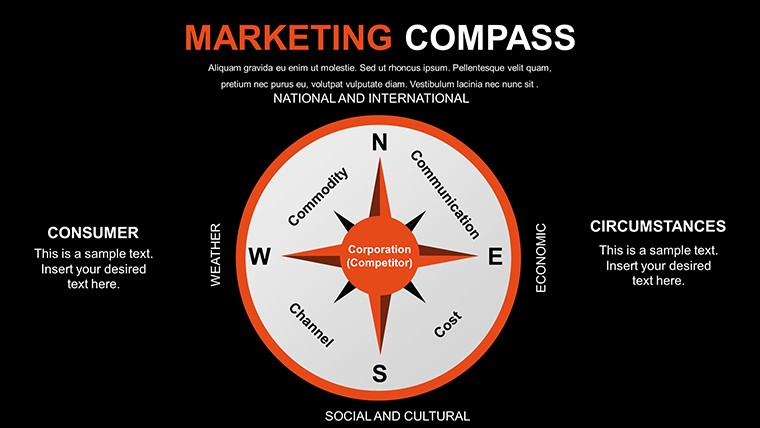
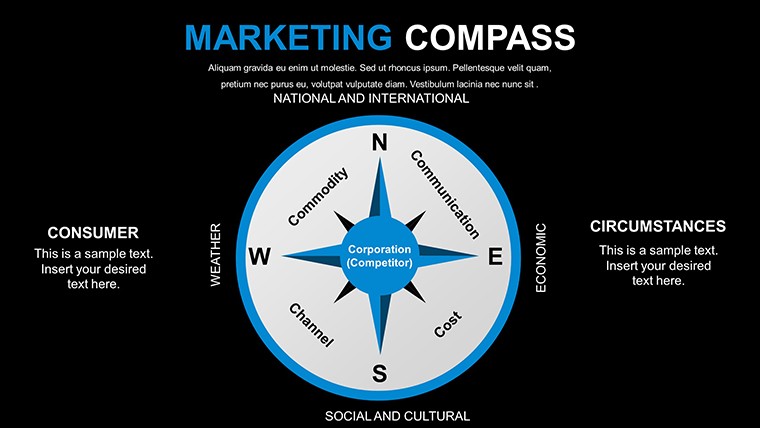
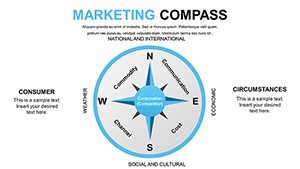
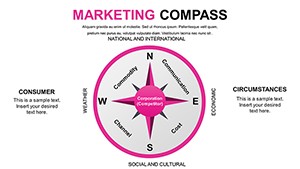
Picture this: You're a marketing director at a tech startup preparing for a venture capital pitch. Instead of dense bullet points, you use the compass chart to map out your go-to-market strategy - north for opportunities, south for risks, east for tactics, west for metrics. This not only clarifies your vision but also engages investors, as evidenced by case studies from firms like HubSpot, where visual aids increased pitch success rates.
For business analysts, integrate this template into quarterly reviews. Customize slides to showcase market segmentation: a compass divided into customer demographics, with arrows pointing to growth areas. Educators can adapt it for classroom scenarios, teaching students about strategic planning through interactive examples, such as simulating a brand's navigation through economic turbulence.
- Campaign Planning: Outline phases from awareness to conversion, using directional charts to show progression.
- SWOT Analysis: Position strengths, weaknesses, opportunities, and threats around the compass for a holistic view.
- Competitor Mapping: Visualize market positions, helping teams identify gaps and opportunities.
- Performance Tracking: Update data dynamically to reflect real-time metrics, fostering agile decision-making.
In consulting, clients appreciate the professionalism - think of a boutique agency using these charts to present digital transformation roadmaps, resulting in higher client satisfaction scores.
Benefits: Why This Template Transforms Your Presentations
Time is your most precious resource in marketing. This template slashes preparation time by providing ready-to-use designs, freeing you to refine your message. Enhanced engagement comes from visuals that tell a story, reducing audience drop-off and increasing recall - studies from Nielsen Norman Group show visuals improve comprehension by up to 89%.
Build a professional image that positions you as a strategic thinker. For students, it adds polish to projects, potentially elevating grades. Overall, it fosters better communication, turning data dumps into directional dialogues that drive results.
Tips for Maximizing Your Marketing Compass Charts
Start by aligning your data with the compass theme: Use the center for core objectives and radiate outwards for supporting elements. Experiment with color psychology - greens for growth, yellows for cautions. Integrate with tools like Excel for live data links, ensuring updates are effortless.
For advanced users, layer in hyperlinks to external resources, creating an interactive experience. Always preview in slideshow mode to fine-tune transitions. By following these, you'll craft presentations that not only meet but exceed expectations.
Ready to chart your course? Download this free template and steer your marketing efforts toward success.
Frequently Asked Questions
How customizable is the Marketing Compass template?
Extremely - edit every element from colors to data without restrictions, ensuring it fits your unique needs.
Is it compatible with Google Slides?
Yes, upload the PPTX file directly to Google Slides for full functionality and collaboration.
What file formats are included?
The download provides a .pptx file, optimized for Microsoft PowerPoint and equivalents.
Can I use this for commercial presentations?
Absolutely, it's free for personal and professional use, with no attribution required.
How do I add my own data?
Simply click on placeholders and input your figures; charts update automatically for accuracy.