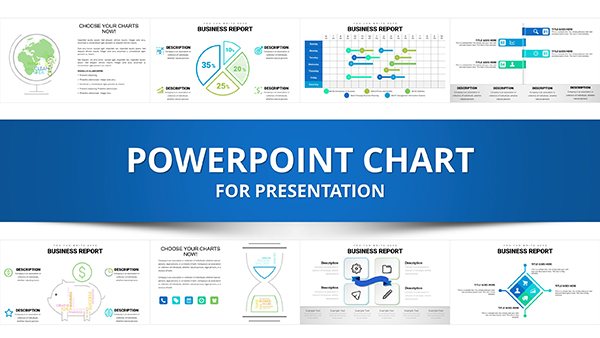
Business Analysis PowerPoint Charts Template: Turn Data into Strategic Mastery


Type: PowerPoint Charts template
Category: Analysis
Sources Available: .pptx
Product ID: PC00628
Template incl.: 40 editable slides
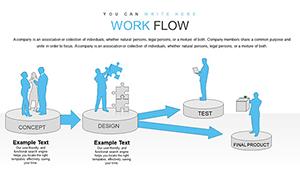
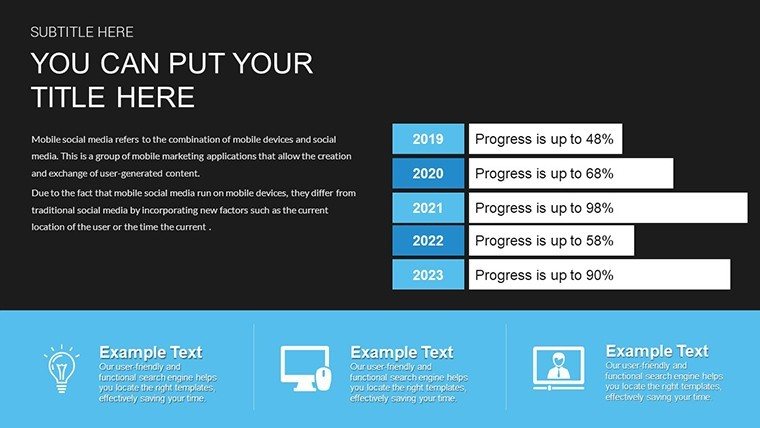
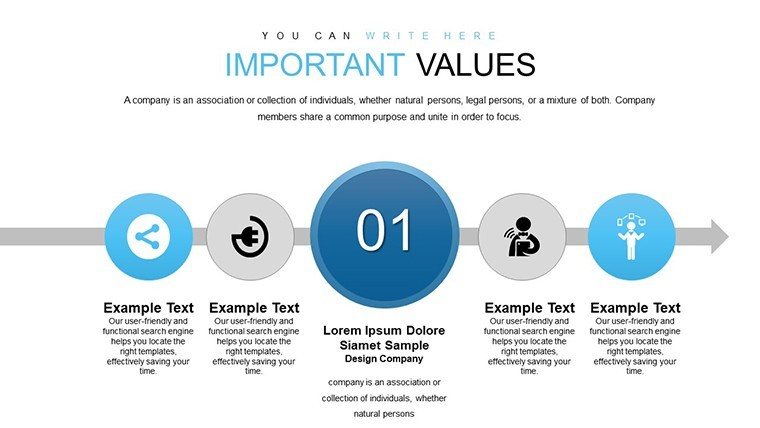
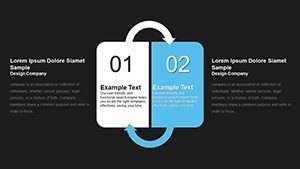
In today's data-saturated business landscape, the ability to distill vast information into actionable insights is a superpower. Our Business Analysis PowerPoint Charts Template equips you with that edge, featuring 40 editable slides packed with sophisticated charts and graphs. Crafted for analysts, executives, and consultants, this tool bridges the gap between raw data and compelling stories, enabling presentations that drive decisions. From financial overviews to market trends, visualize complexities with ease, compatible with PowerPoint and Google Slides. Inspired by analytical frameworks from Gartner, it helps professionals like those at PwC to deliver high-impact reports that resonate in boardrooms and beyond.
The template's sleek design ensures your analyses stand out, avoiding the pitfalls of overcrowded slides. With a focus on professionalism, it empowers you to present with authority, fostering trust and engagement.
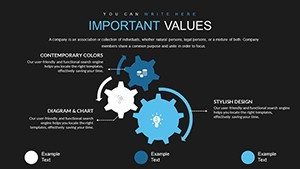
Feature Spotlight: Crafting Professional Narratives
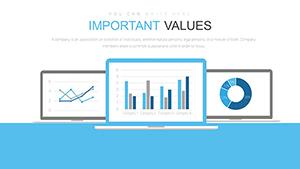
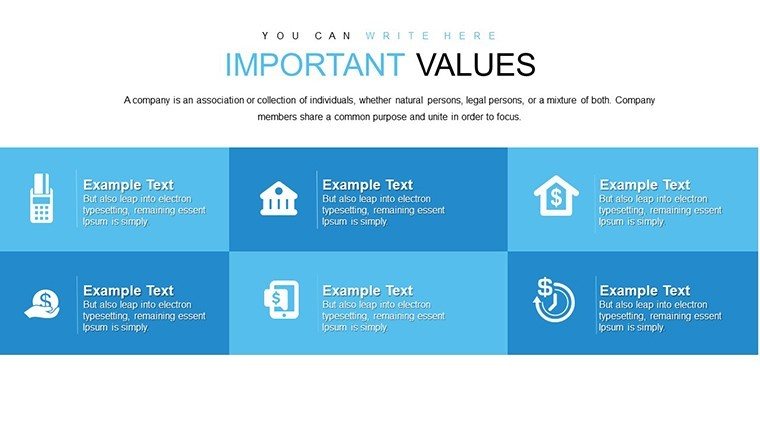
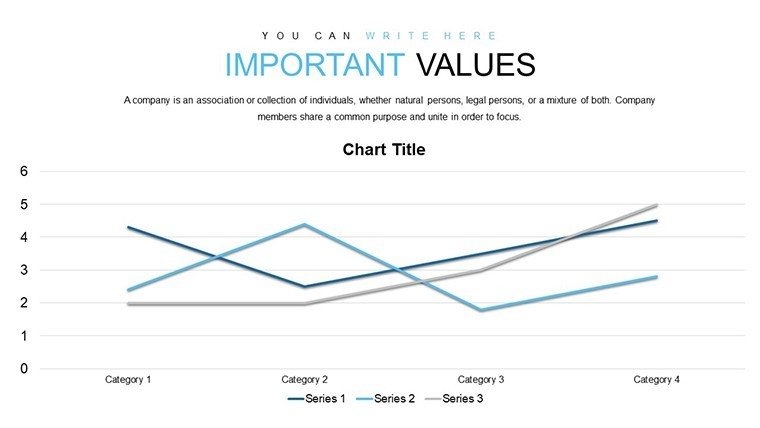
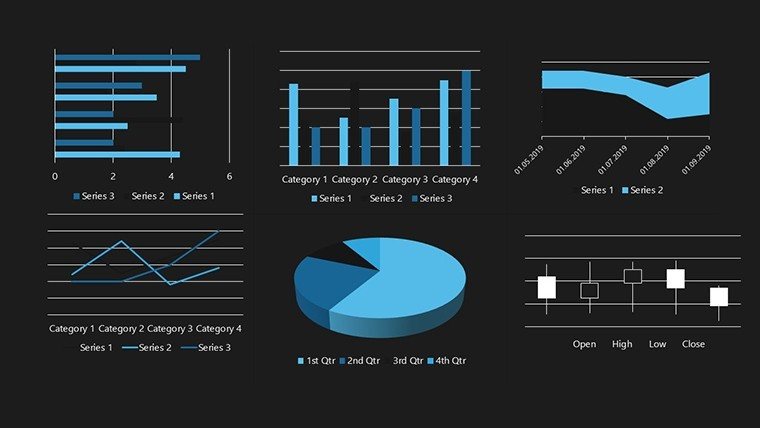
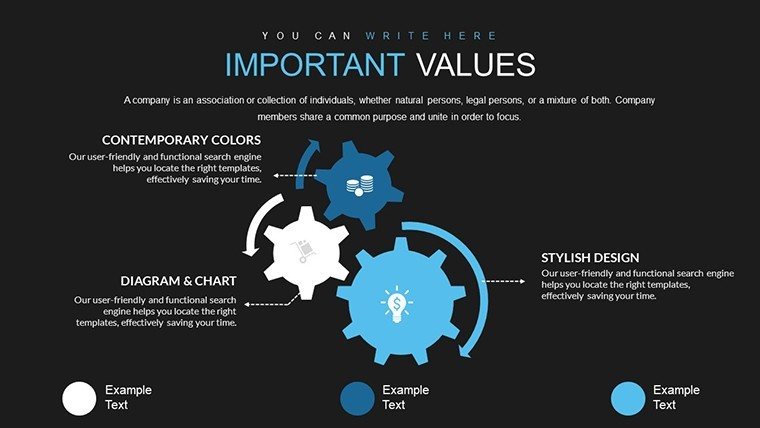
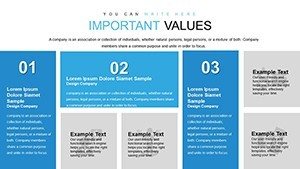
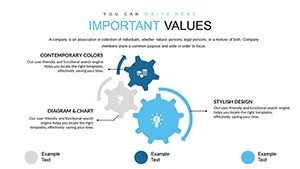
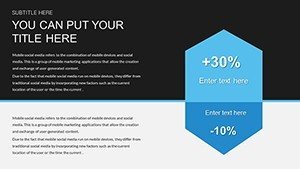
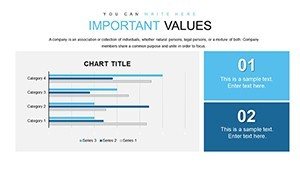
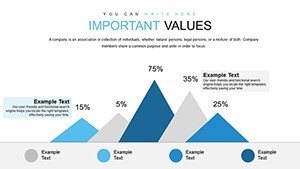
Key to its appeal are the customization options - resize graphs, alter color schemes, and input data seamlessly to match your branding. This flexibility outstrips basic tools, allowing for bespoke visuals like pie charts for market shares or line graphs for trend forecasting.
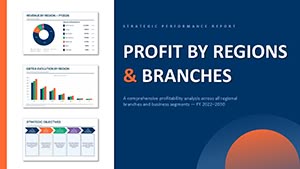
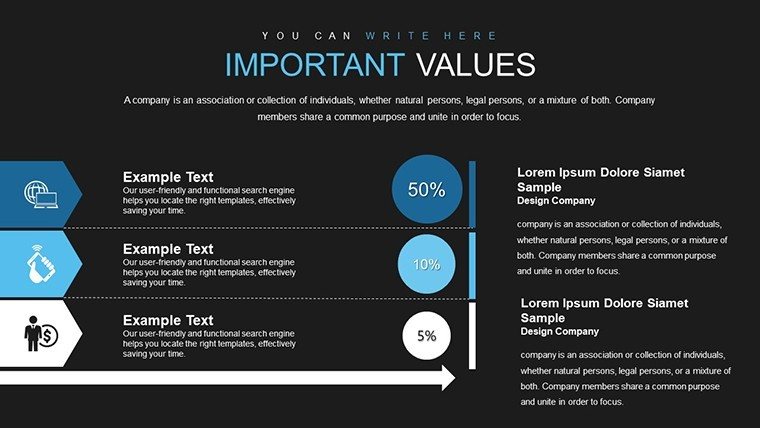
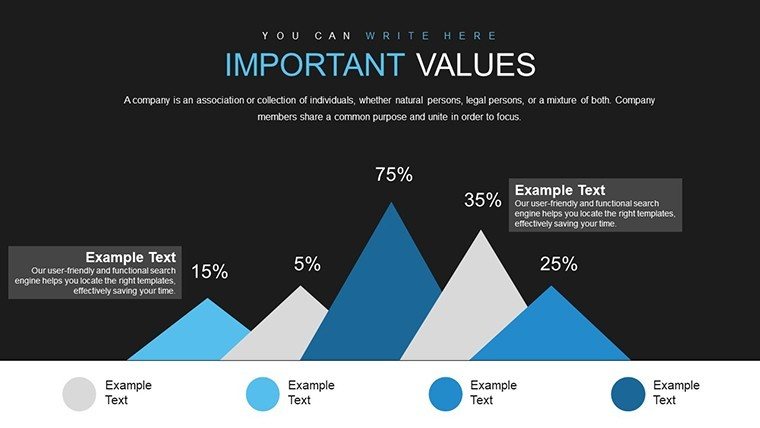
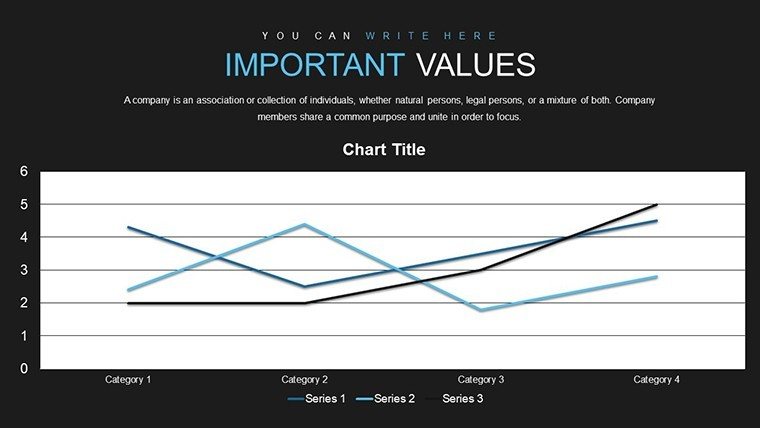
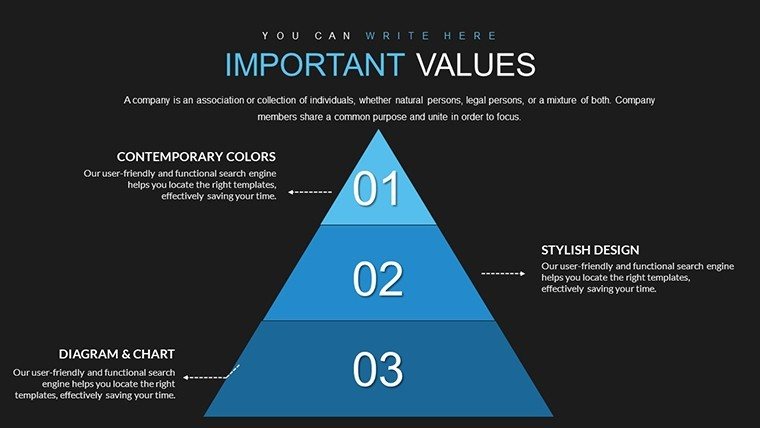
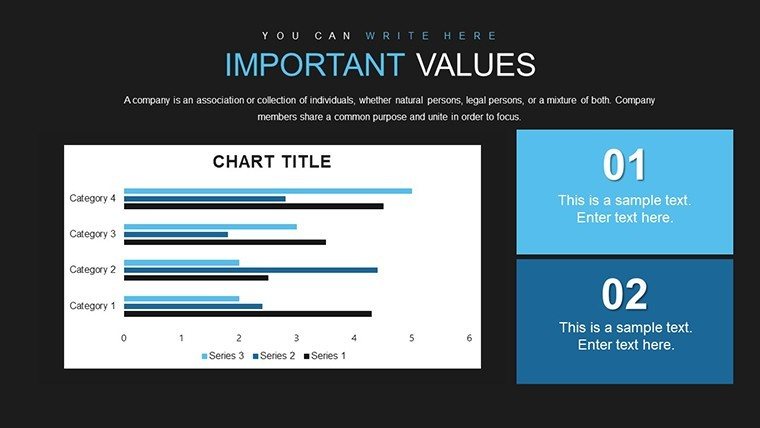
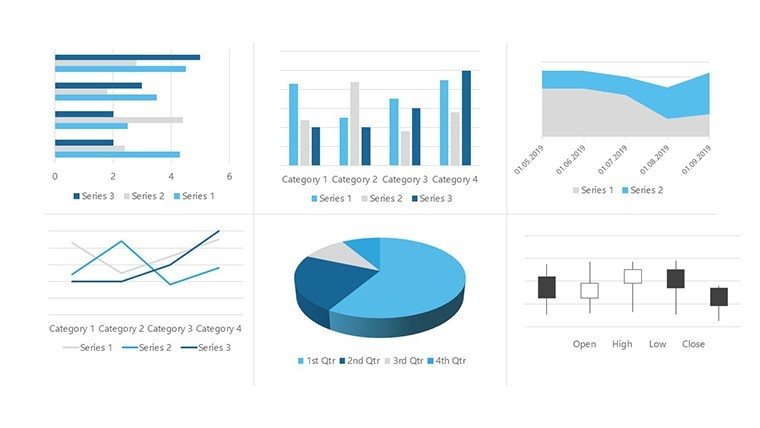
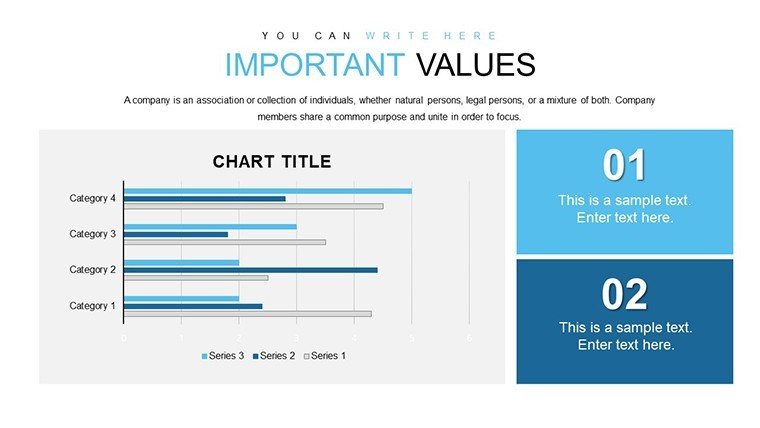
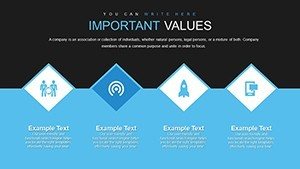
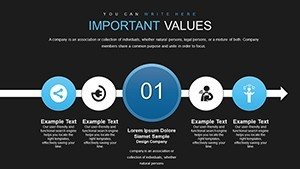
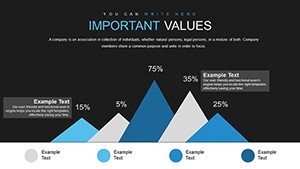
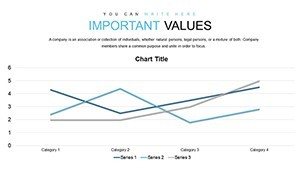
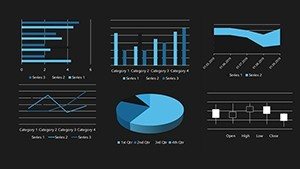
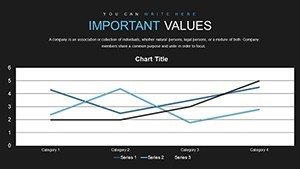
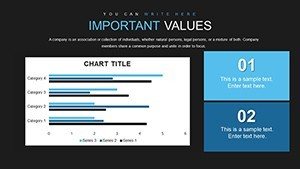
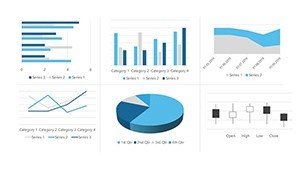
Data-driven visuals form the backbone: bar charts for comparisons, scatter plots for correlations, all rendered with precision. Executives can use these to highlight KPIs, drawing from real-time data sources like Tableau integrations.
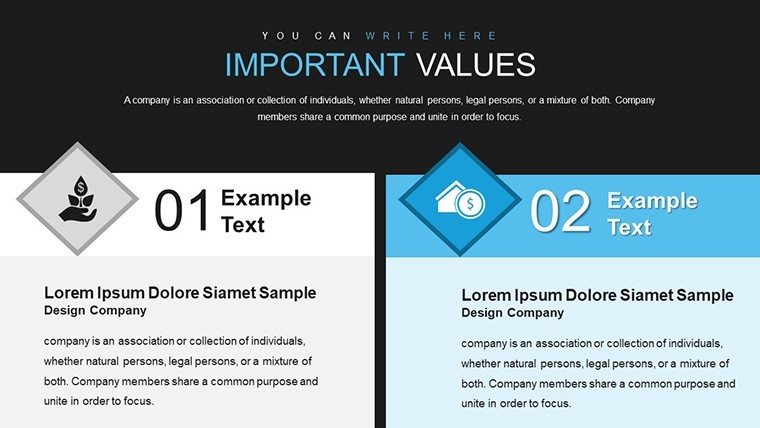
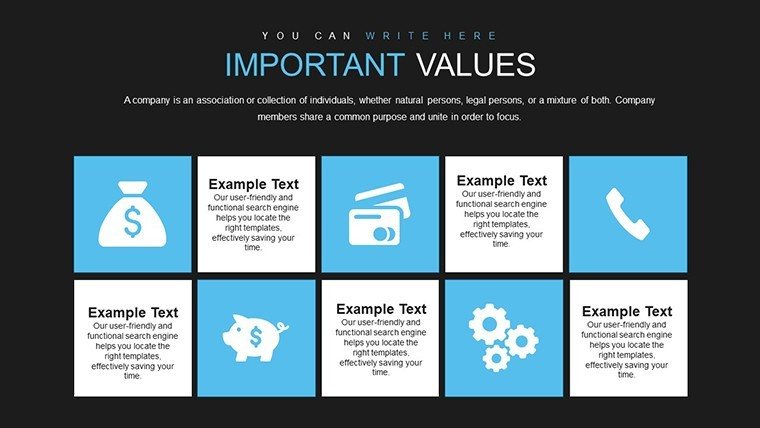
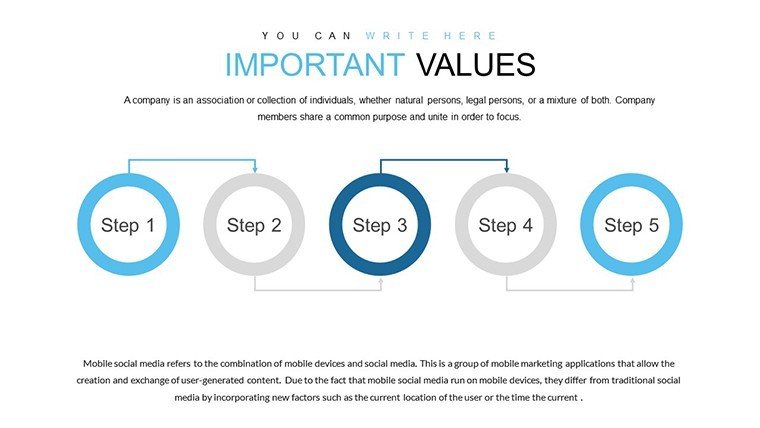
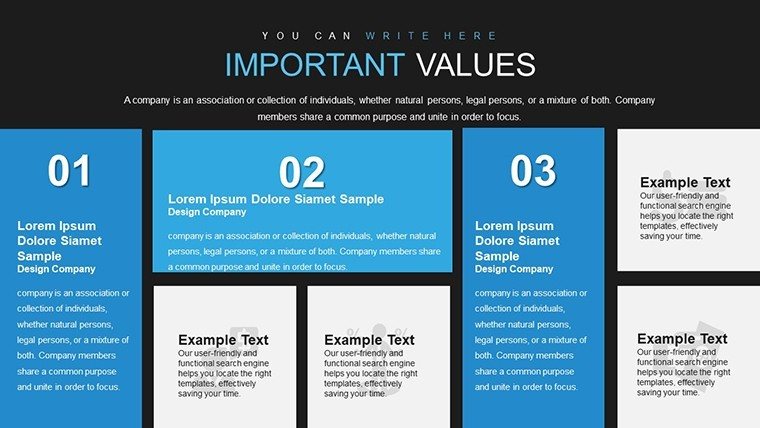
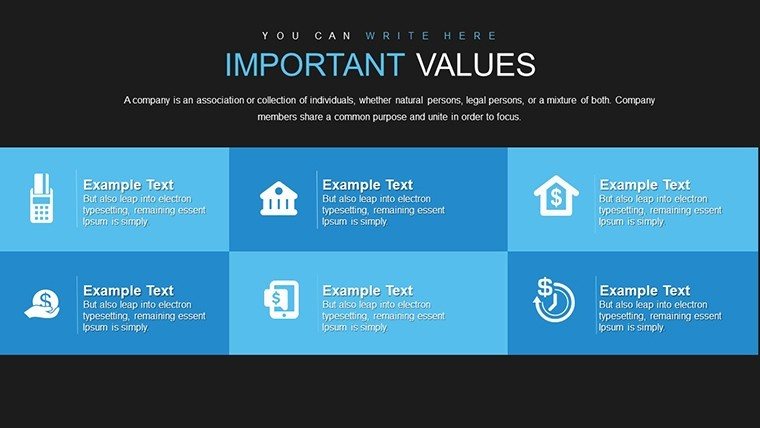
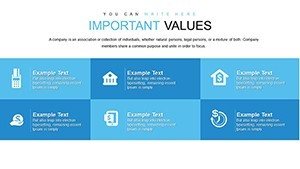
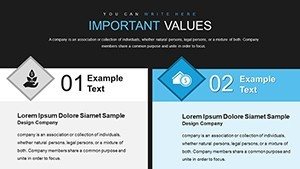
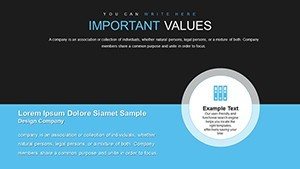
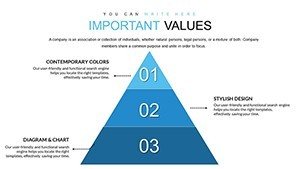
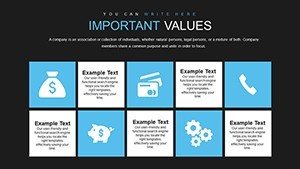
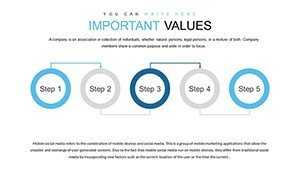
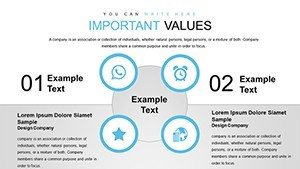
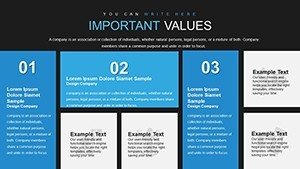
Professionally designed slides exude modernity, with clean lines and subtle animations that guide viewer focus without distraction.
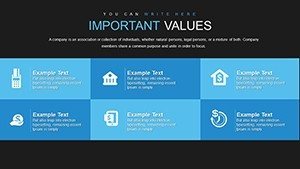
Targeted Use Cases: Empowering Professionals
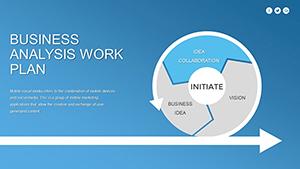
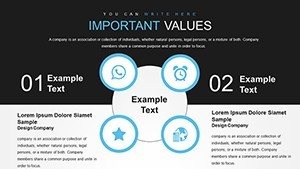
For business analysts, it's a toolkit for deep dives - create dashboards showing SWOT analyses or risk assessments, as in IBM's strategic reviews.
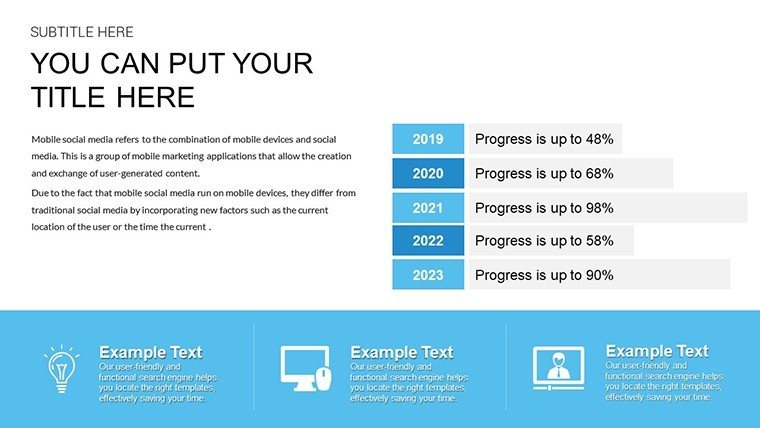
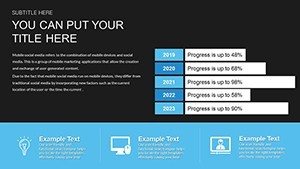
Executives and managers leverage it for overviews, such as quarterly performance metrics, aligning with balanced scorecard methods from Harvard Business Review.
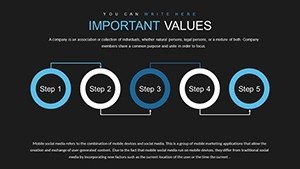
Consultants engage clients with tailored visuals, elucidating strategies like growth projections, mirroring approaches in Bain & Company case studies.
Superior to Defaults: Enhanced Value
With 40 variations, it covers more ground than standard libraries, users report sharper insights and faster prep times.
Optimization Tips and Integrations
Apply best practices: Use legends sparingly, opt for data labels. Integrate with SQL for live pulls, or SharePoint for collaboration. Case studies show efficiency gains in consulting firms.
Ready to master your data? This template is your ally.
Frequently Asked Questions
What chart types are included?
A variety including bars, lines, pies, and scatters for comprehensive analysis.
Can I add my own data?
Yes, easy import from Excel or direct entry.
Is it mobile-friendly?
Fully responsive for editing on devices.
Suitable for large datasets?
Handles complex data with scalable visuals.
Updates available?
Free updates for purchased users.
Branding guidelines?
Included tips for consistent application.