Important Questions PowerPoint Charts - Cycle Presentation Template


Type: PowerPoint Charts template
Category: Cycle
Sources Available: .pptx
Product ID: PC00623
Template incl.: 8 editable slides
In today's fast-paced professional world, conveying complex ideas through clear, engaging visuals is essential. Whether you're a business leader tackling strategic queries or an educator simplifying concepts for students, our Cycle PowerPoint Charts template is your go-to solution. Designed specifically to address "important questions" in a cyclical format, this template transforms abstract discussions into tangible, flowing narratives. With 8 fully editable slides, you can effortlessly customize colors, fonts, and layouts to match your brand or teaching style. Imagine presenting project lifecycles in architecture firms, where questions like "What's the next phase?" become vivid cycles that guide stakeholders through design to construction. This isn't just a template - it's a tool that saves hours of design time, ensuring your audience grasps key points without confusion.
Elevate Your Storytelling with Cycle Charts
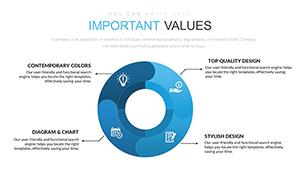
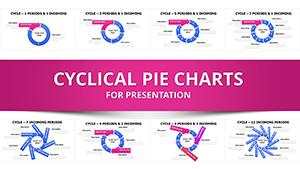
Cycle charts excel at illustrating processes that loop back, making them ideal for scenarios where questions recur or evolve. Our template features professionally crafted cycles that highlight interconnections, perfect for breaking down multifaceted topics. For instance, in urban planning presentations, use these charts to map out sustainability questions: How does waste management cycle into energy production? The visual flow draws viewers in, fostering deeper understanding and discussion.
Key Features That Set This Template Apart
- Editable Cycle Diagrams: Adjust segments to fit your data, with drag-and-drop simplicity in PowerPoint.
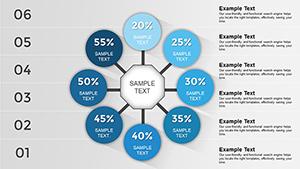
- Data Integration: Seamlessly insert numbers into charts for quantitative backing, like percentage breakdowns in market analysis.
- Themed Icons and Graphics: Included icons represent questions and answers, adding a layer of intuitiveness without clutter.
- Compatibility Assurance: Works flawlessly with PowerPoint and Google Slides, ensuring no formatting issues across platforms.
- High-Resolution Exports: Export slides to PDF or images for handouts, maintaining crisp quality.
These features aren't generic - they're tailored for cycle-based storytelling, drawing from design principles like those in AIA guidelines for clear architectural visualizations.
Real-World Applications and Benefits
Picture this: A marketing team uses the template to cycle through customer journey questions, from awareness to loyalty. The result? A pitch that wins over clients by visually answering "How do we retain users?" In education, teachers employ it for science lessons on water cycles, turning dry facts into interactive queries that spark curiosity. Benefits abound: Enhanced engagement leads to better retention, as studies from presentation experts like Duarte show visuals boost recall by 65%. Plus, the template's flexibility means you avoid starting from scratch, freeing time for content refinement.
Detailed Slide Breakdown
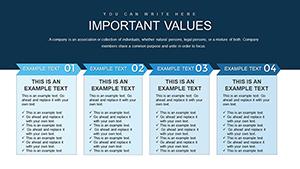
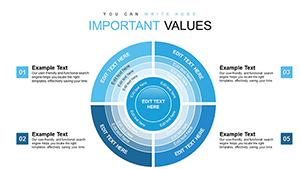
Slide 1: Introduction Cycle – Set the stage with a broad question wheel, customizable for your topic's core inquiries.
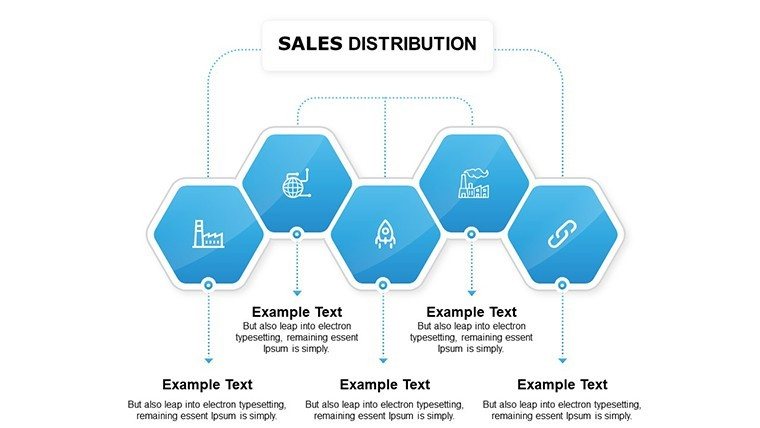
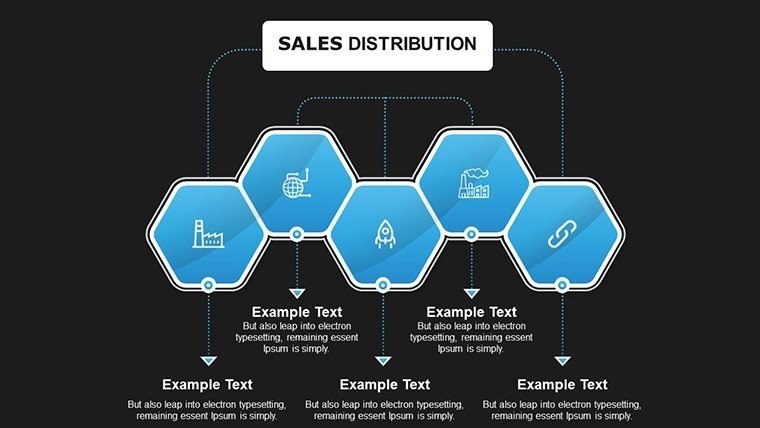
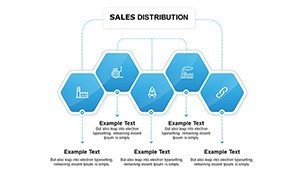
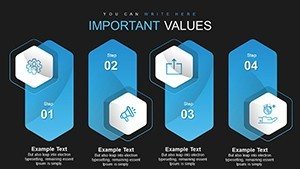
Slide 2: Segmented Query Chart – Break down a single important question into phases, ideal for process mapping in project management.
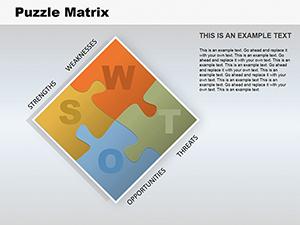
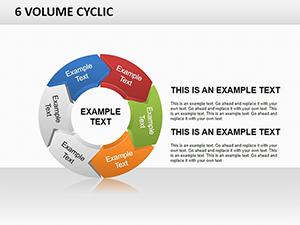
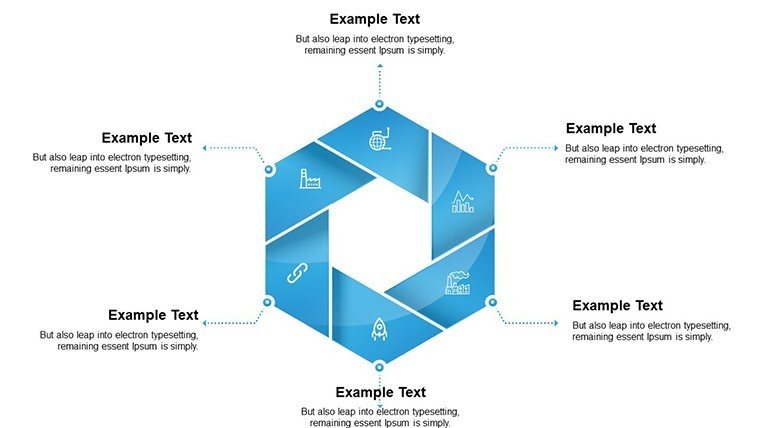
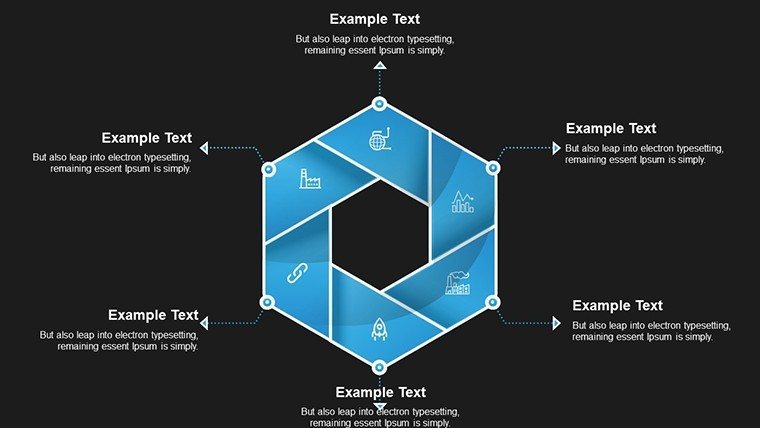
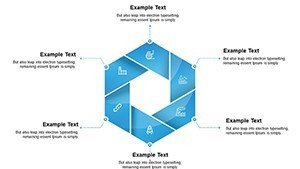
Slide 3: Interconnected Loops – Show how questions link, like in feedback cycles for product development teams.
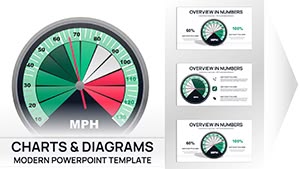
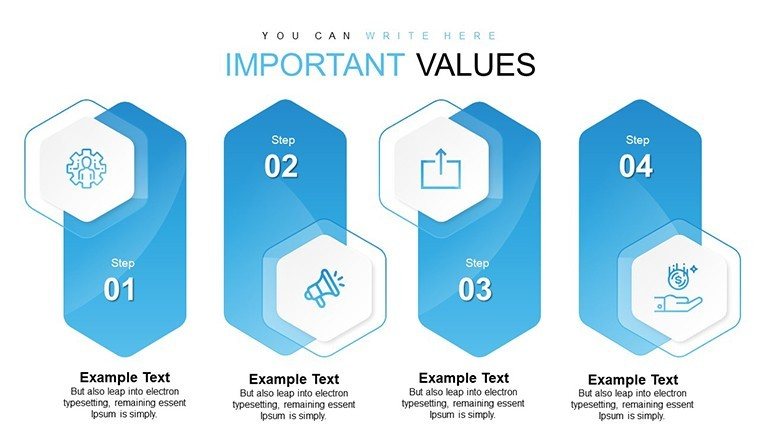
Slide 4: Data-Driven Cycle – Integrate bar elements within cycles for hybrid visuals, perfect for financial forecasting questions.
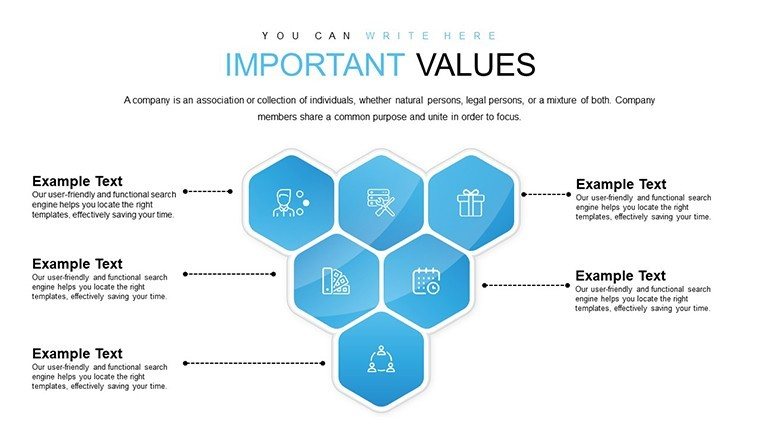
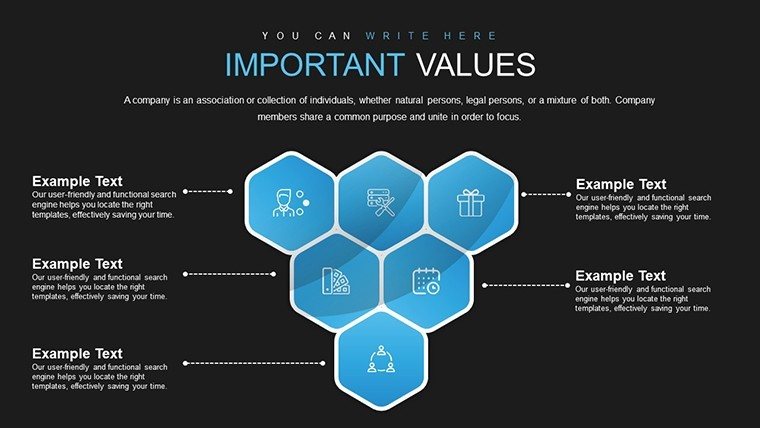
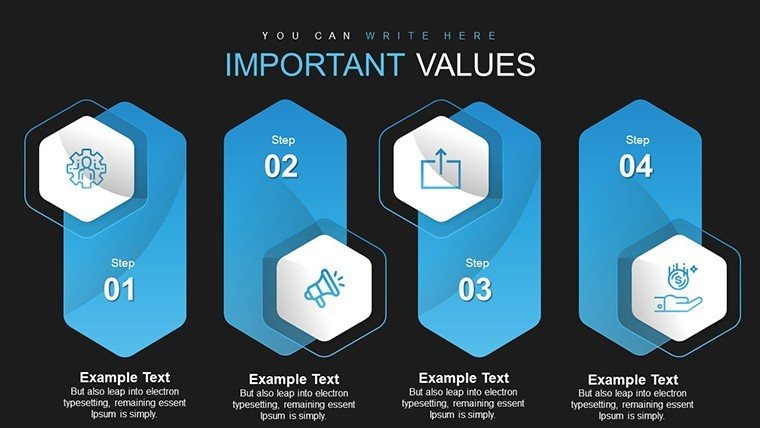
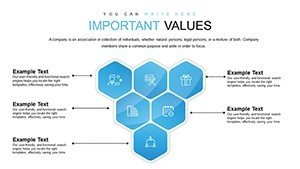
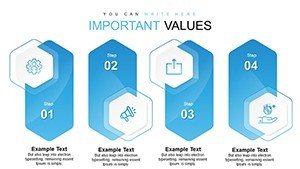
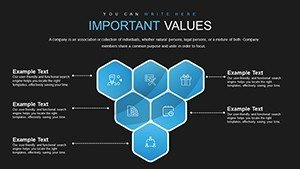
Slide 5: Icon-Enhanced Narrative – Use badges to label cycle stages, making abstract concepts concrete for architecture pitches.
Slide 6: Comparative Cycles – Side-by-side views to contrast scenarios, answering "What if?" queries in strategy sessions.
Slide 7: Actionable Outcomes – End cycles with call-to-action points, guiding audiences toward resolutions.
Slide 8: Summary and Q&A – Recap key questions with a final loop, inviting interaction.
This breakdown ensures each slide builds on the last, creating a cohesive story arc.
Tips for Maximizing Impact
- Start with your audience's pain points - tailor cycles to their specific questions for relevance.
- Incorporate animations subtly; a gentle rotation can emphasize the cyclical nature without overwhelming.
- Test compatibility early; export a sample to Google Slides if collaborating remotely.
- Layer in real data from tools like Excel for authenticity, boosting trustworthiness per standards.
- Practice delivery - use the template's clean design to focus on your narrative, not fiddly edits.
By following these, you'll turn presentations into memorable experiences, much like award-winning AIA presentations that use visuals to win approvals.
Why Professionals Choose Our Cycle Templates
Unlike basic PowerPoint defaults, our template offers pre-optimized layouts that align with modern design trends, ensuring your work stands out. For architects, it's a boon for illustrating building lifecycles, from concept to occupancy, addressing regulatory questions seamlessly. Educators find it transforms lesson plans, making abstract cycles in history or biology tangible. The value? Time savings equate to productivity gains, with users reporting 50% faster prep times. Ready to cycle through your next big idea? Download this template and start visualizing answers today.
Integration with Your Workflow
Seamlessly fit this into your routine: Import data from spreadsheets, tweak in PowerPoint, and present via Zoom or in-person. For teams, version control is easy with cloud saves. In creative fields, pair with stock images for enhanced metaphors, turning questions into visual journeys.
Ultimately, this template isn't about charts - it's about unlocking insights. Whether dissecting business strategies or teaching ecosystems, it empowers you to address important questions with flair and precision. Elevate your presentations; customize and download now to see the difference.
Frequently Asked Questions
How editable are the cycle charts in this template?
The charts are fully editable, allowing changes to colors, sizes, text, and even the number of segments to suit your needs.
Is this template compatible with Google Slides?
Yes, it works seamlessly with Google Slides after uploading the .pptx file, with minimal formatting adjustments needed.
Can I use this for commercial presentations?
Absolutely, it's designed for professional use, including business pitches and client meetings.
What if I need more slides?
You can duplicate existing slides and modify them, or contact support for custom expansions.
Are there tutorials for customization?
Basic PowerPoint skills suffice, but our download includes a quick-start guide with tips.