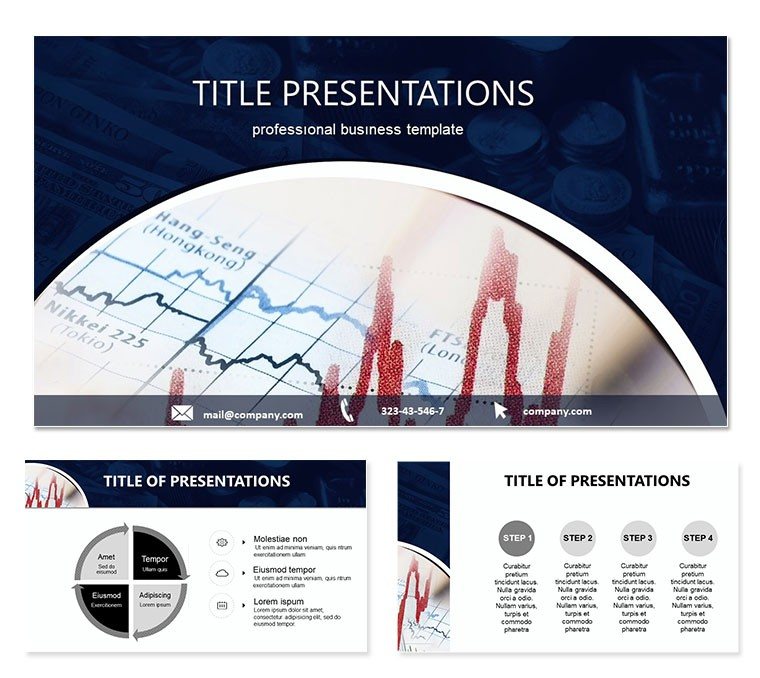
In the labyrinth of consumer behaviors and competitive landscapes, effective market research demands visuals that illuminate paths forward. Our Business Market Research PowerPoint template delivers just that: 28 diagrams honed for dissecting surveys, trends, and forecasts, empowering marketers and researchers to unveil insights that shape destinies. From startup validations to corporate pivots, it bridges data to decisions with elegance and exactitude.
Tailored for the inquisitive minds battling information overload, it eases the burden of uninspired charts. Three masters anchor your brand, complemented by three backgrounds - crisp whites for data purity or accented hues for engaging narratives. Seven color schemes categorize findings, like blues for buyer personas versus oranges for opportunity hotspots, fostering intuitive comprehension.
Consultants, brand strategists, and product leads gain a superpower here. Envision a campaign launch: feed focus group quotes into a word cloud slide, surfacing sentiments that refine messaging. Or, during board strategy huddles, the competitor matrix grids your rivals` strengths, arming you with counters that command respect. It`s less about slides and more about sparking the `aha` moments that drive revenue.
Powerhouse Features for Research Rigor
These 28 diagrams, fluid in PowerPoint 2016+, range from ethnographic maps to predictive models. Anchor with the research framework hierarchy, outlining phases from hypothesis to validation - customize tiers to mirror your methodology.
Standouts: sentiment gauges for qualitative vibes and cohort analyses for behavioral arcs. 65+ research icons, from surveys to funnels, enrich without encumbrance.
- Responsive Resizing: Elements adapt sans quality loss, suiting diverse displays.
- Analytical Aids: Pre-formatted for stats like NPS calculations.
- Multi-Use Assets: .jpg for infographics, .potx for ongoing projects.
Echoing research playbook aesthetics, it sequences logically, from gather to glean.
Insights in Action: Research to Reality
Deployed. For a consumer goods team probing trends, the journey map (slide 13) traces touchpoints, highlighting friction for redesigns.
- Harvest Data: Import survey exports to the crosstab (slide 7).
- Synthesize Stories: Craft the insight pyramid (slide 17).
- Amplify with Animations: Sequence builds to mirror discovery flow.
Academics lecturing on methodologies leverage the process cycle (slide 22) to loop ethics to execution, captivating classes. Trumps DIY with smart layouts, hastening hypothesis tests.
In pitches, the value prop canvas (slide 27) aligns pains to gains, winning buy-in swiftly.
The Research Revelation
Excels in empathetic design, space for reflection, type for quick reads. A agency revamped client reports with it, noting modular insights accelerated approvals.
From persona profiles to trend timelines, it illuminates inclusively.
Unleash discoveries - acquire for $22 and research with revelation.
Frequently Asked Questions
Suitable for beginners?
Yes, intuitive interfaces guide even novice users through edits.
Data import methods?
Supports CSV pastes and Excel embeds for live updates.
Scheme count?
Seven, tailored to data types for optimal distinction.
Google Slides ready?
Fully, with conversion preserving layouts.
Customization limits?
None - unlimited tweaks for unique needs.
Support for visuals?
Icons and placeholders for photos/charts included.