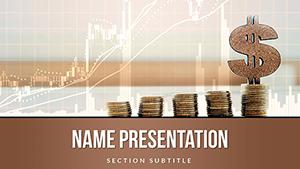
Exchange Trading Stocks PowerPoint Template

Type: PowerPoint templates
Category: Finance - Accounting
Sources Available: .jpg, .potx, .pptx
Product ID: PP03602
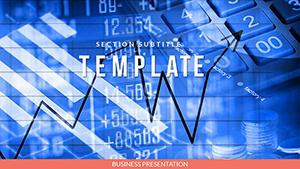
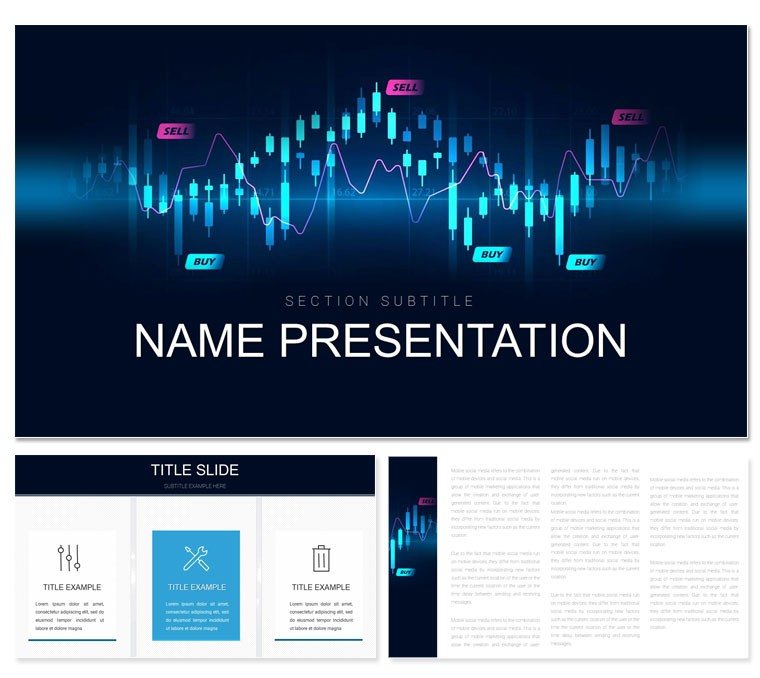
3 Backgrounds
3 Backgrounds,
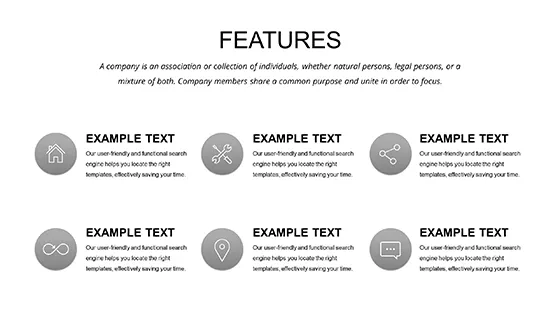
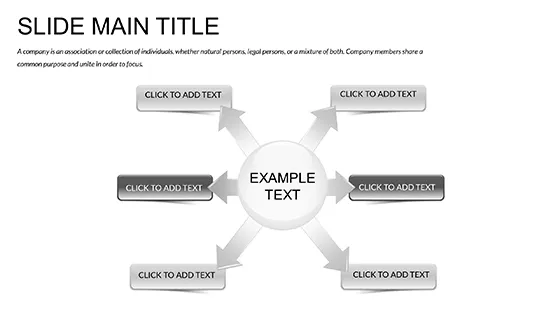
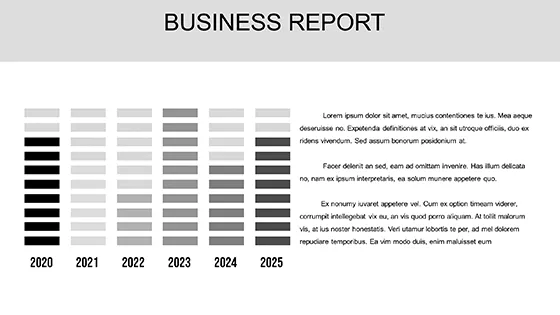
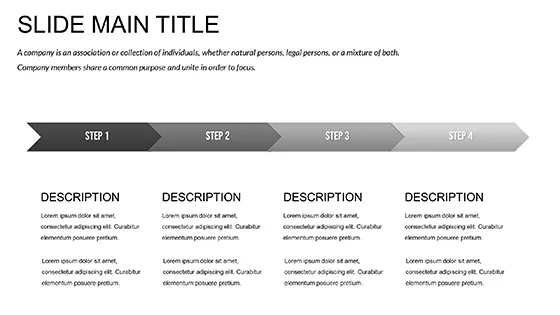
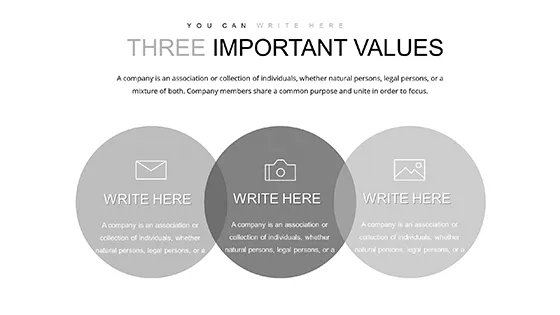
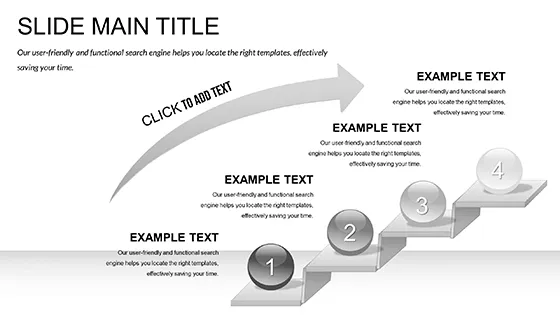
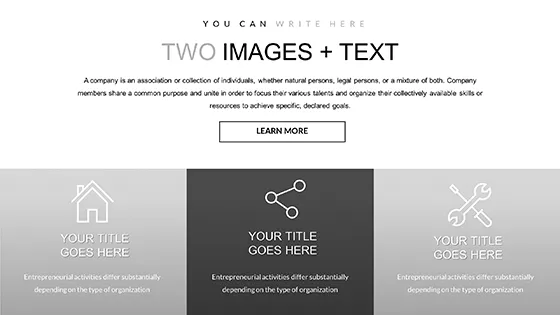
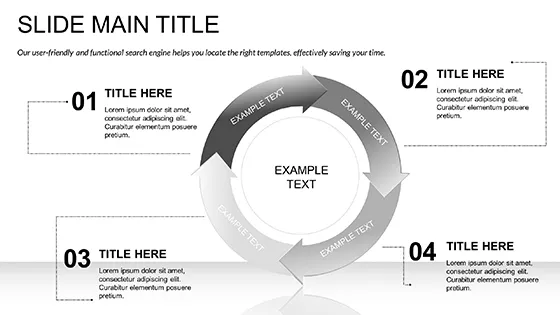
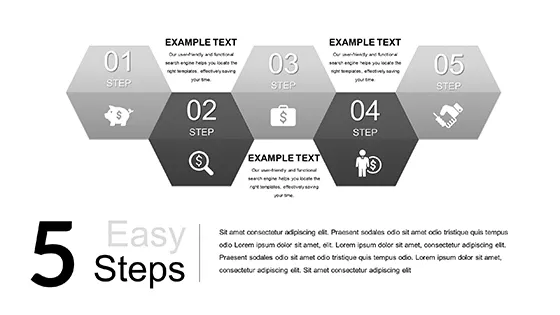
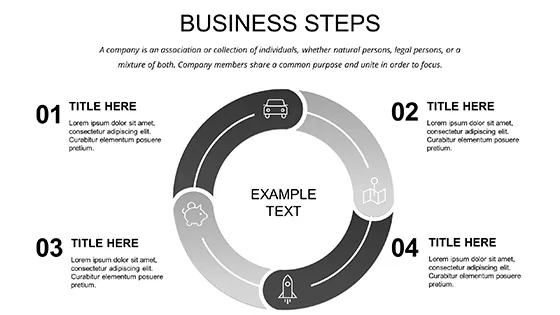
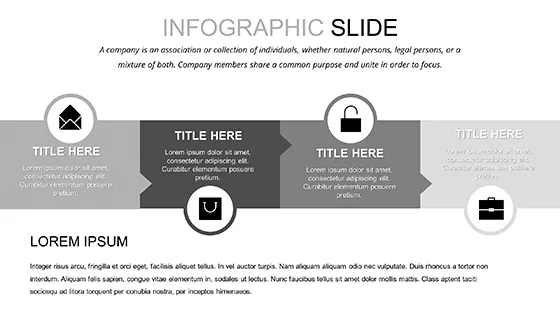
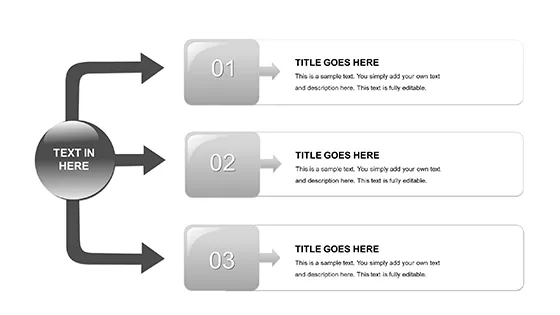
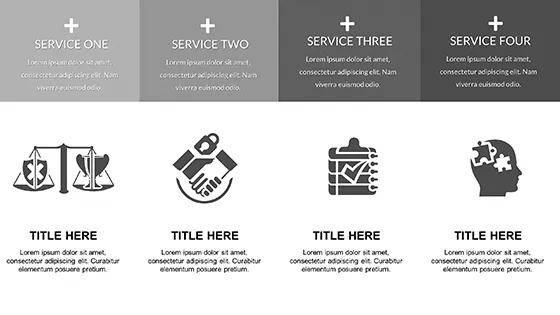
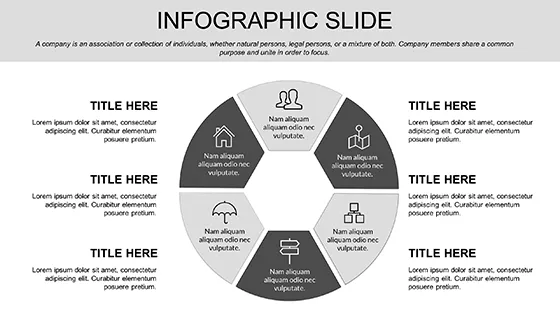
28 Diagrams,
7 color schemes for diagrams
Picture this: you're in the thick of a high-stakes boardroom, charts flickering on the screen as you break down the latest bitcoin surge or forex fluctuations. The room hangs on your every visual cue, but instead of fumbling with clunky defaults, your slides flow seamlessly, turning raw data into a narrative that seals the deal. That's the power of the Exchange Trading Stocks PowerPoint template at your fingertips. Designed for traders, analysts, and finance pros who need to convey complex market dynamics without the design headache, this template packs 28 meticulously crafted diagrams ready to adapt to your latest trade insights.
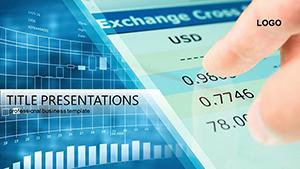
Whether you're prepping for a client seminar on stock volatility or an internal review of currency converters, these slides cut through the noise. With three master layouts and backgrounds to choose from, plus seven vibrant color schemes, you can match your brand's energy - think crisp blues for stability or bold greens for growth potential. Each element is fully editable in PowerPoint, from reshaping arrows in a process flow to swapping icons for specific assets like equities or commodities. No more starting from scratch; just plug in your data and watch your presentation elevate from informative to unforgettable.
This isn't just a set of slides - it's a strategic ally for anyone navigating the fast-paced world of exchange trading. Imagine layering in real-time stock tickers onto a dynamic timeline diagram, or using a radial chart to spotlight interconnected global markets. Professionals like those at major brokerage firms have leaned on similar structured visuals to clarify trends, much like how leading economists use clean graphics in reports to demystify economic shifts. Here, you get that level of polish, tailored for your next pitch.
Core Features That Drive Trading Insights Home
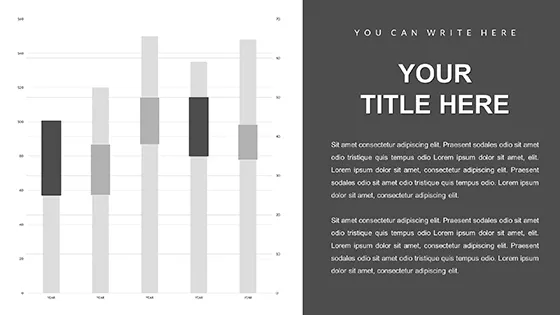
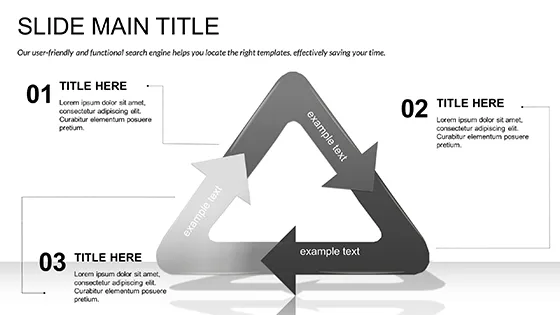
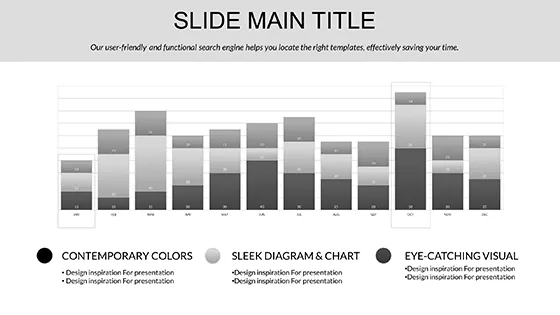
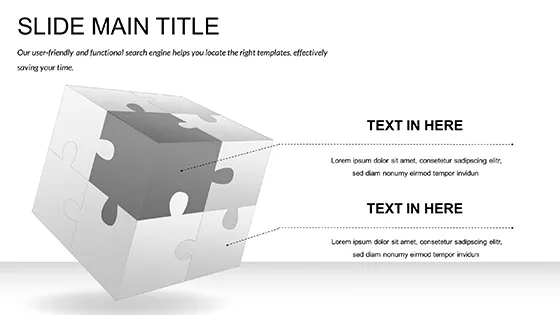
At the heart of this template lies a library of 28 diagrams, each built to handle the nuances of financial storytelling. From basic bar graphs for volume comparisons to intricate network maps showing trade linkages, every piece is vector-based for sharp scalability. The three included masters ensure consistency across your deck - header footers auto-adjust, fonts stay uniform, and animations trigger smoothly for emphasis without overwhelming.
Customization is effortless: open in PowerPoint 2016 or later, select a diagram, and tweak colors via the scheme selector. Need to highlight a bull market run? Swap to the energetic orange palette. For a conservative audit, the neutral grays keep it grounded. Backgrounds range from subtle gradients to textured overlays that evoke market charts, all optimized for both light and dark modes to suit any projector setup.
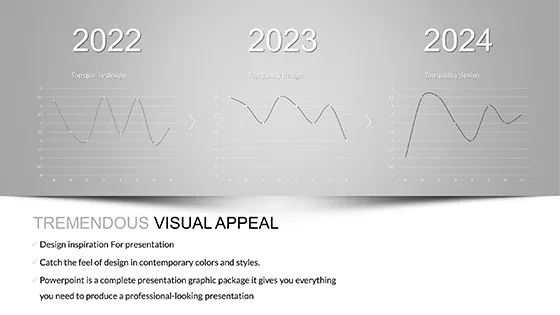
- Diagram Variety: Includes timelines for historical price movements, pie charts for portfolio allocations, and flowcharts for trade execution processes.
- Color Schemes: Seven options, each with harmonious accents that align with financial branding - easy to preview and apply deck-wide.
- File Formats: Delivered as .potx for templates, .pptx for immediate use, and .jpg previews for quick references.
These features aren't bells and whistles; they're tools that let you focus on analysis, not aesthetics. A trading desk lead might use the scatter plot diagram to correlate currency pairs, dragging data points directly from Excel for live updates during your talk.
Streamlining Your Workflow with Smart Edits
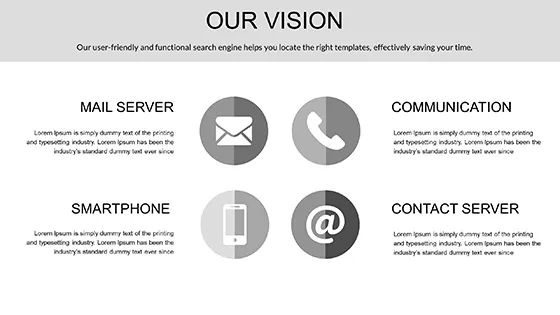
Getting started is straightforward. After downloading, launch PowerPoint and apply the master - your slides inherit the pro layout instantly. For a stock overview slide, insert the column chart diagram, input your quarterly figures, and adjust the axis labels to reflect trading volumes. The built-in icons library offers finance-specific symbols, like upward arrows for gains or shields for risk hedges, saving you hunting time.
Pro tip: Layer transparency on overlapping elements in the Venn diagram to illustrate overlapping market influences, such as how geopolitical events ripple through stocks and crypto. This template shines in hybrid environments too - export sections as images for reports or embed hyperlinks to live feeds, keeping your audience engaged beyond the slide.
Real-World Applications for Exchange Pros
Dive into scenarios where this template transforms routine updates into standout sessions. For a bitcoin seminar, start with the introductory infographic slide to set the stage on blockchain basics, then transition to a step-by-step flowchart detailing transaction flows. Each phase highlights editable text boxes for your unique angles, like regulatory impacts or wallet security.
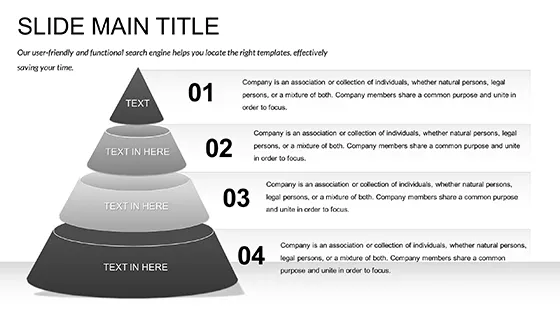
In a stock trading workshop, leverage the pyramid diagram to build a hierarchy of investment strategies - from core holdings at the base to speculative plays at the top. Attendees grasp the structure visually, sparking questions that lead to deeper discussions. Or, for currency converter demos, the comparison table slide lets you side-by-side exchange rates, with conditional formatting via PowerPoint's tools to color-code favorable shifts.
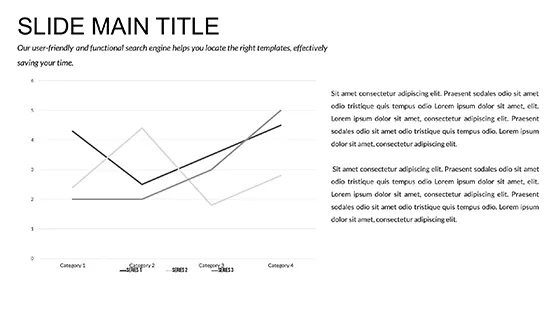
- Market Analysis Deck: Use the line graph series to plot trends over time, annotating peaks with callout shapes for key events like earnings releases.
- Investor Pitch: Employ the balance scale icon set to weigh pros and cons of a trade, balancing visuals with bullet-point summaries below.
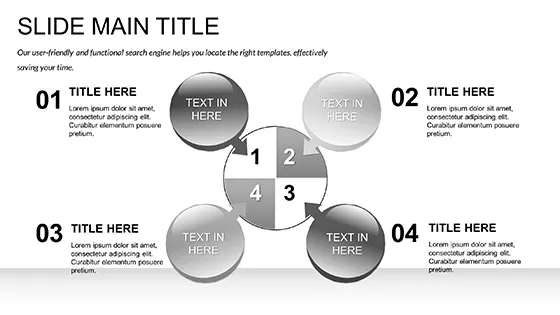
- Team Briefing: The mind map diagram connects global exchanges, branching out to regional effects - ideal for remote calls where clarity wins.
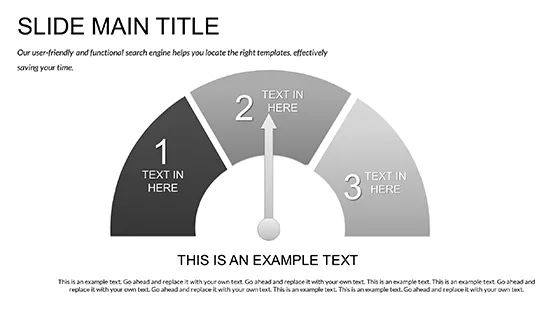
Consider how a forex analyst might adapt the radar chart for multi-currency performance, plotting axes for volatility, liquidity, and yield. It's these targeted adaptations that make your presentations not just seen, but remembered, fostering trust in your expertise.
Enhancing Engagement with Interactive Elements
To amp up interaction, embed subtle animations - like a wipe reveal on the progress bar for trade milestones - that guide the eye without distraction. Pair this with speaker notes integrated into the template, scripting transitions like "As we see here, the euro's climb against the dollar..." This setup, drawn from best practices in financial communications, ensures your delivery feels natural and authoritative.
For larger audiences, the template's widescreen compatibility means no cropping issues on big screens, preserving every detail from icon edges to label fonts. And since it's lightweight, loading times stay snappy, even with embedded charts.
Why This Template Outshines Basic Builds
Compared to vanilla PowerPoint charts, this template skips the guesswork. Default shapes often look dated or disproportionate; here, every element is proportioned for impact, with smart guides for alignment. You avoid hours resizing, focusing instead on narrative flow - does this slide build tension toward a buy recommendation?
It's also versatile beyond trading: adapt for commodity overviews or even economic forecasts, swapping themes to fit. Users appreciate the thematic icons - stock tickers, candlesticks, globe markers - that add context without clutter.
Integrate it into your toolkit alongside tools like Excel for data pulls or Tableau for deeper viz, but standalone, it handles 90% of trading needs with finesse.
Ready to Trade Up Your Slides?
Don't let subpar visuals undermine your market edge. Grab the Exchange Trading Stocks PowerPoint template for $22 and start crafting decks that command attention. Your next seminar deserves the clarity and punch only pro diagrams can deliver - download today and turn data into decisions.
Frequently Asked Questions
What formats are included with this template?
The template comes in .potx for easy application to new presentations, .pptx for direct editing, and .jpg files for quick previews or handouts.
Is it compatible with older PowerPoint versions?
Yes, fully supported in PowerPoint 2016 and newer versions on Windows and Mac.
Can I use this for non-trading topics?
Absolutely - adapt the diagrams for any data-driven presentation, like economic reports or investment overviews.
How many color schemes are available?
Seven distinct schemes, each optimized for readability and thematic relevance in finance contexts.
Are the diagrams fully editable?
Every diagram is vector-based and customizable, from colors and sizes to text and icons.