Teaching the vast tapestry of our world shouldn't feel like charting unknown territories alone. This PowerPoint template equips educators with a vibrant toolkit to bring continents, countries, and cultures to life on screen. Aimed at teachers in geography, history, or cultural studies who seek to spark curiosity without the hassle of from-scratch designs, it delivers 28 diagrams in seven engaging color schemes. From mapping migration patterns to spotlighting cultural festivals, these slides make abstract places personal and memorable.
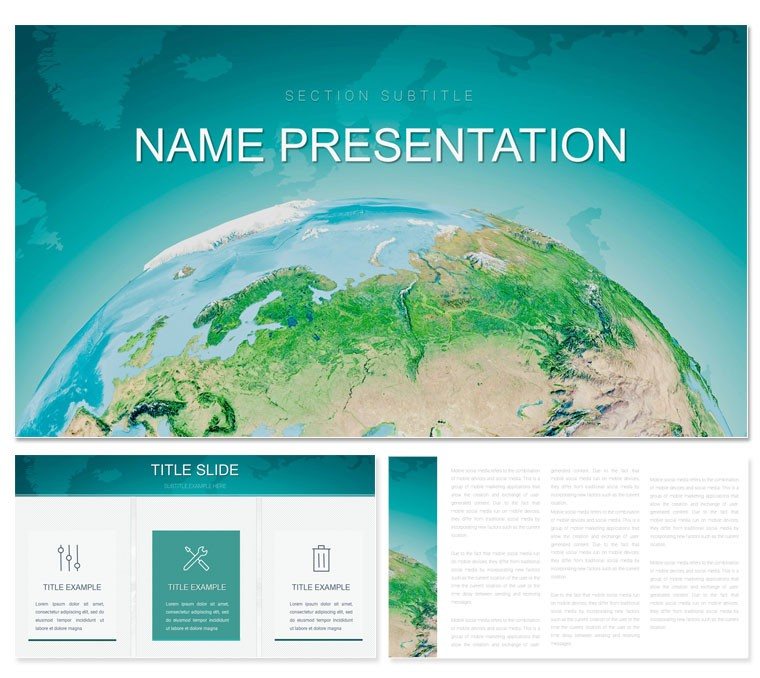
Developed with classroom dynamics in mind, the template works flawlessly in PowerPoint 2016 and subsequent releases, complete with three masters and three backgrounds that evoke worldly themes - like subtle globe motifs or earthy tones. Replace stock images with your fieldwork photos or student contributions, and watch as lessons transform from lectures to journeys. It's for those educators who believe visuals aren't just aids - they're gateways to understanding.
Key Features That Bring the World Closer
The template's design philosophy centers on accessibility and allure, ensuring every element serves the learning objective. With 28 diagrams tailored to geographic storytelling, customization becomes second nature.
- High-Impact Graphics: Crisp maps, flags, and cultural icons that resize effortlessly, ideal for projecting in dim auditoriums or sharing digitally.
- Seven Color Palettes: Earthy neutrals for factual overviews or vivid primaries to highlight biodiversity hotspots - pick what fits the lesson's mood.
- Three Masters for Harmony: Standardized layouts keep focus on content, with easy swaps for seasonal themes like holiday traditions.
Fonts vary for readability, from sans-serif for body text to elegant scripts for country names, all adjustable to meet accessibility standards. This setup lets you embed quizzes or polls directly into slides, fostering interactive sessions that stick.
Unpacking Diagrams for Classroom Magic
Each diagram is a lesson in itself. The world map slide, for starters, outlines continents with overlayable labels, letting you peel back layers to reveal climate zones or population densities. Customize with hyperlinks to virtual tours, turning a static image into an expedition.
For cultural deep dives, the timeline diagram traces historical events across regions, with nodes for pivotal moments like the Silk Road's influence. Teachers can animate paths to show connectivity, making history feel alive. These aren't filler visuals; they're scaffolds for discovery.
Versatile Applications: From Lesson Plans to Field Trips
Consider a middle school unit on Asia: the pyramid diagram structures economic tiers from agriculture to tech hubs, with editable tiers for student input on case studies like Japan's innovation wave. It encourages debate, as kids layer their perspectives.
In high school, the Venn diagram compares European and African colonial legacies, overlapping shared impacts like trade routes. For virtual exchanges with international classes, the photo grid slide assembles student-submitted images, building a collaborative world album.
Draw from real inspirations, like National Geographic's mapping techniques, to layer data ethically. Pro tip: Use the template's grid layouts for group projects, assigning regions and merging outputs for a class atlas presentation.
Setting Up Your Global Classroom: A Simple Guide
- Access and Adapt: Load the .pptx in PowerPoint 2016+, reviewing masters to align with your curriculum colors.
- Infuse Content: On the flag quiz slide, insert regional banners and scramble for engagement tests.
- Enhance Interactivity: Add action buttons to navigate between continents, creating a choose-your-adventure flow.
- Preview Dynamics: Rehearse timings to pace revelations, like unveiling a country's landmarks one by one.
- Share Seamlessly: Output to video for absent students or LMS uploads, preserving all embeds.
Unlike default PowerPoint maps that blur on resize, this template's vectors stay sharp, saving reformatting frustrations and amplifying teaching time.
What Makes This Template a Classroom Essential
It's the thoughtful touches: diverse representation in icons, from indigenous patterns to urban skylines, promoting inclusive narratives. Veteran teachers value how it reduces prep, allowing more room for spontaneity - like impromptu discussions on current events overlaid on news maps.
Integrate with tools like Google Earth links for hybrid lessons, or print slide excerpts for hands-on labeling activities. The .potx format supports school-wide templates, standardizing visuals across departments.
Ready to make every lesson a passport to possibility? Download this world geography PowerPoint template and embark on adventures that educate and enchant.
Frequently Asked Questions
Can students edit the template for projects?
Yes, the unlocked structure allows safe modifications, with masters protecting core designs.
Does it include map projections?
Diagrams feature Mercator and equal-area options, both fully scalable and annotatable.
What about accessibility features?
High-contrast schemes and alt-text ready placeholders ensure compliance with WCAG guidelines.
Is it compatible with online platforms?
Fully optimized for Google Slides import and Zoom screen sharing without quality loss.
How many cultural elements are covered?
Diagrams span global traditions, with room to add specifics via editable icon libraries.