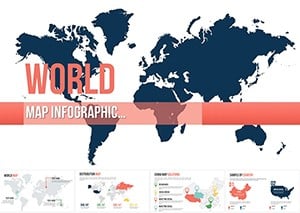
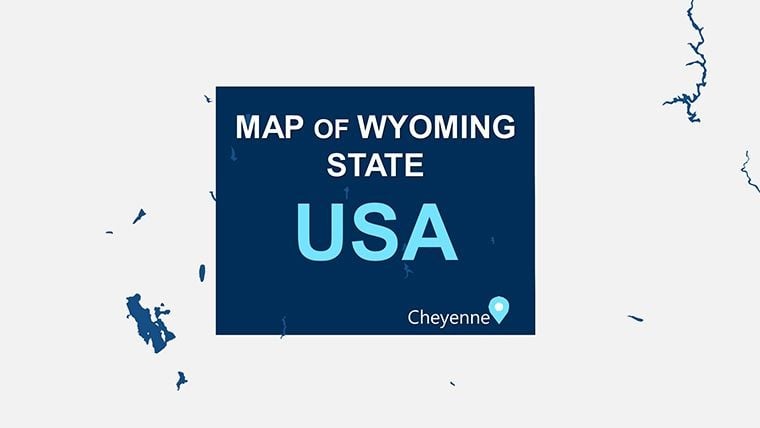
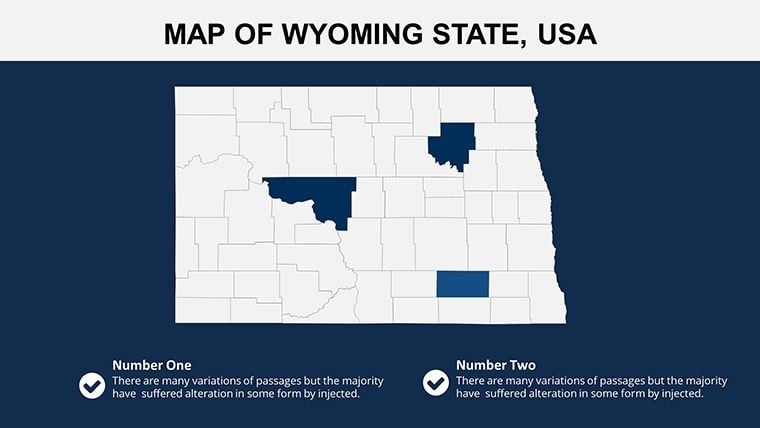
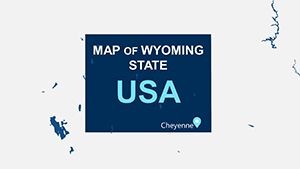
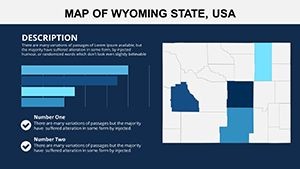
Discover Wyoming's Vast Horizons Through Customizable Keynote Maps


Type: Keynote Maps template
Category: North America
Sources Available: .key
Product ID: KM00155
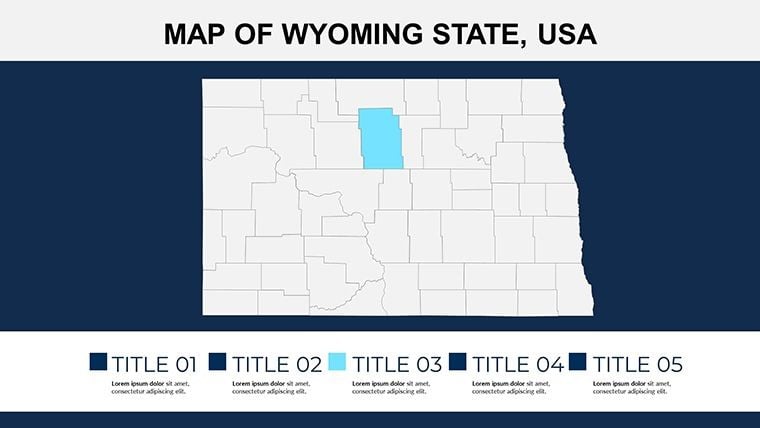
Template incl.: 28 editable slides
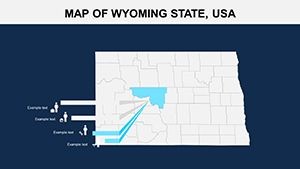
Picture this: You're pitching a renewable energy project in the windswept plains of Wyoming, your slides effortlessly panning across the state's iconic features - from Yellowstone's geothermal wonders to the rugged peaks of the Grand Tetons. Our Wyoming USA Keynote Maps template makes this vision a reality. With 28 meticulously designed, fully editable slides tailored for Apple's Keynote, this tool is a game-changer for anyone needing to convey geographic insights with flair. Ideal for environmental scientists tracking wildlife migration, oil and gas executives mapping drilling sites, or history buffs illustrating the Oregon Trail's path, it turns complex data into digestible, dynamic visuals.
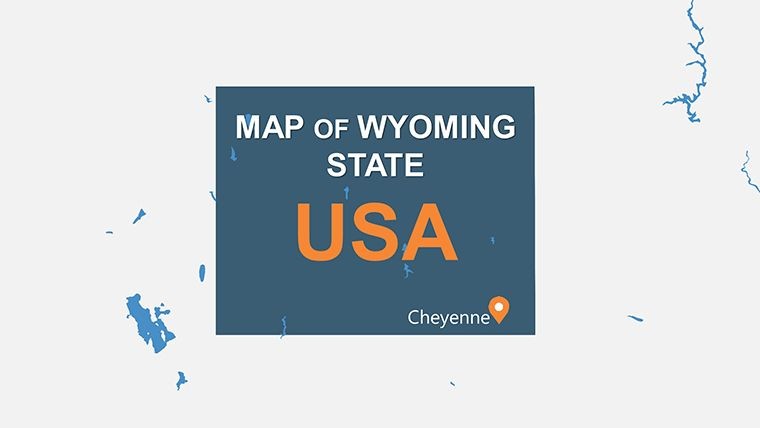
Drawing from authoritative sources like the USGS (United States Geological Survey) and Wyoming's own GIS databases, our template ensures accuracy while offering creative freedom. Adjust county boundaries to highlight economic hubs like Cheyenne, overlay mineral resource data on the Powder River Basin, or animate wind patterns for climate discussions. High-definition graphics shine on widescreen displays, making your presentation not just informative but unforgettable. Forget struggling with default tools; this template streamlines your workflow, letting you focus on the story behind the map.
Standout Features for Professional Polish
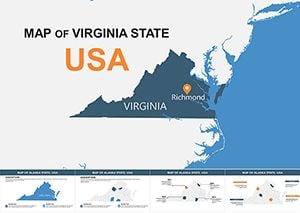
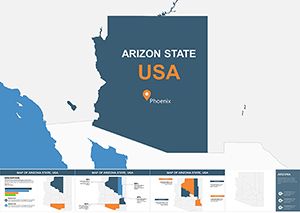
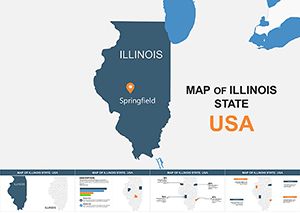
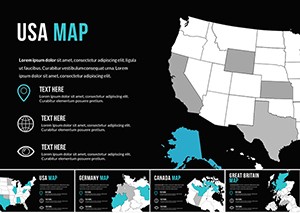
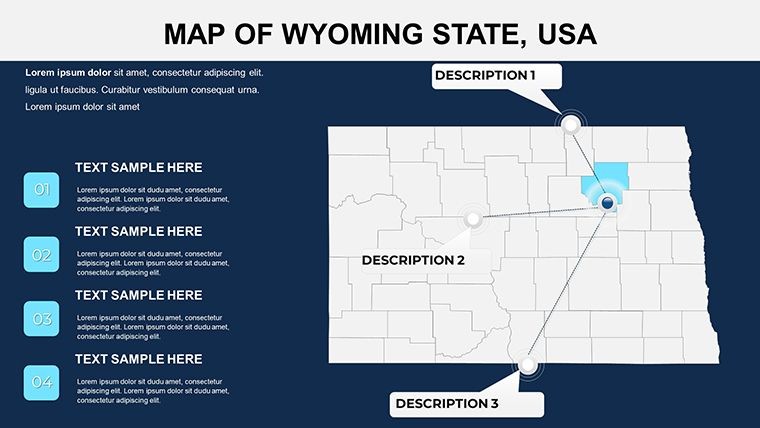
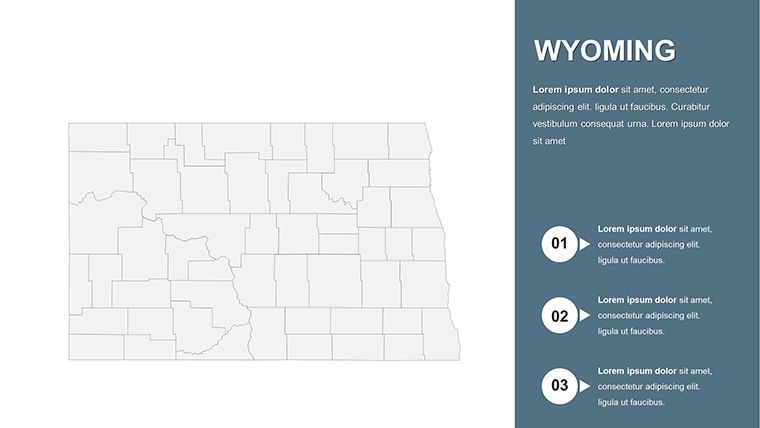
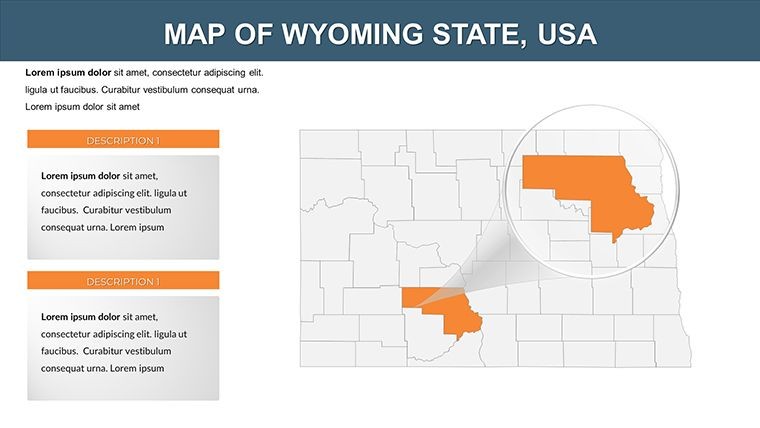
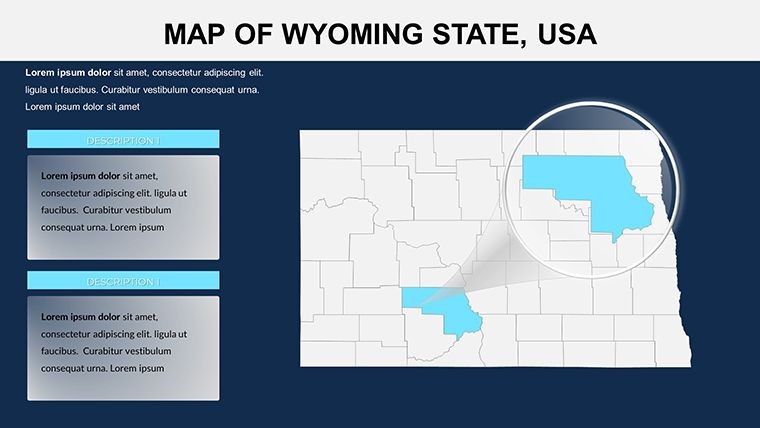
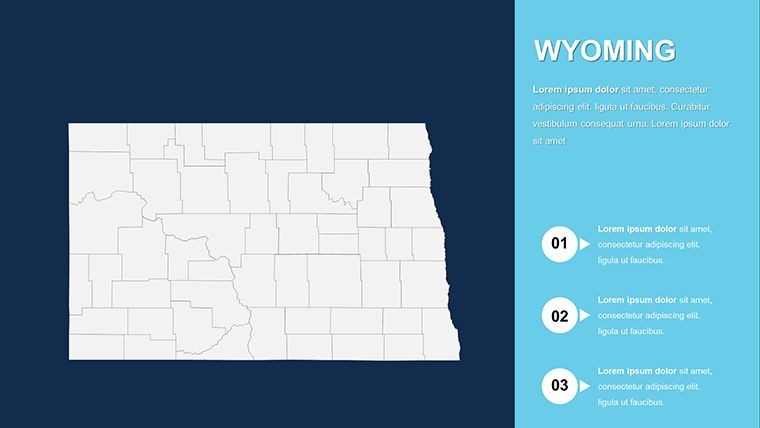
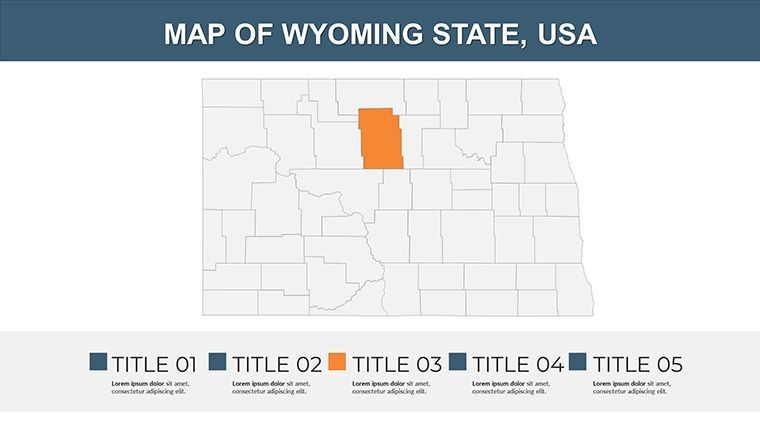
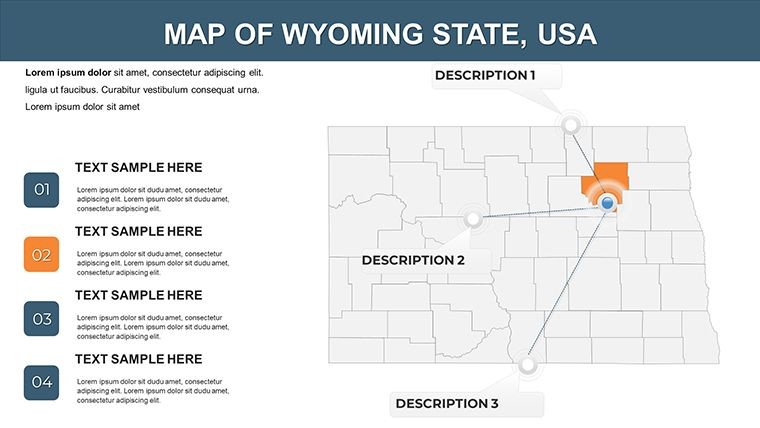
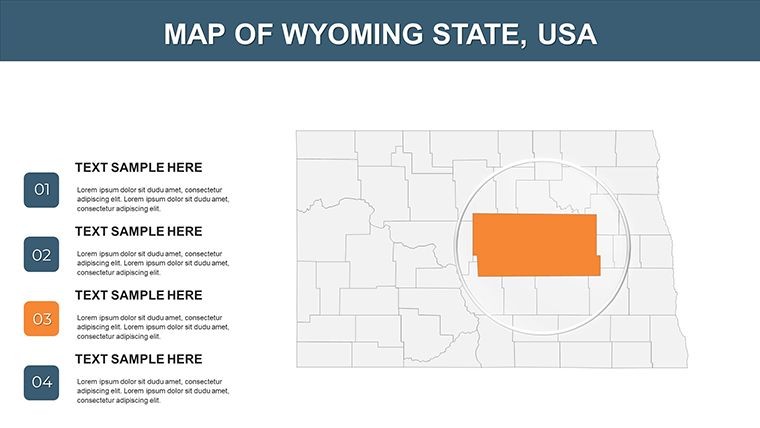
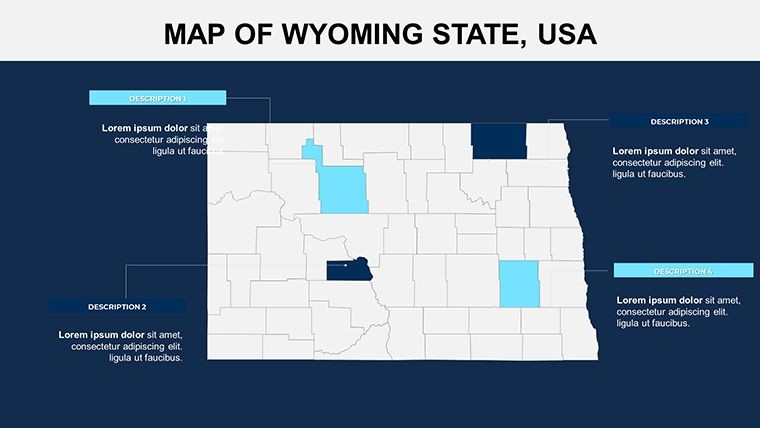
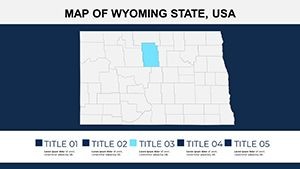
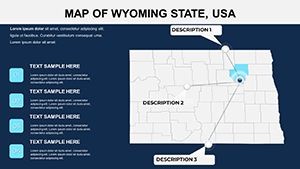
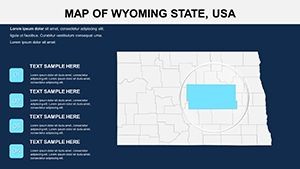
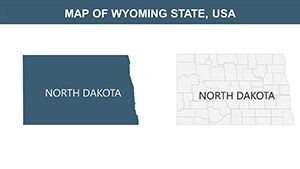
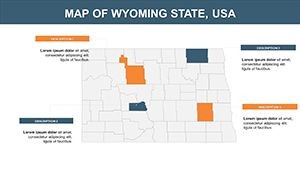
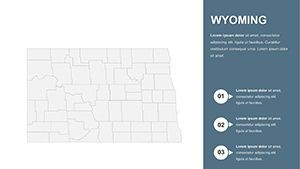
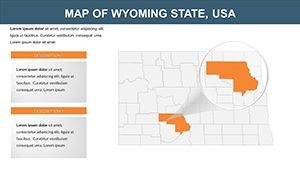
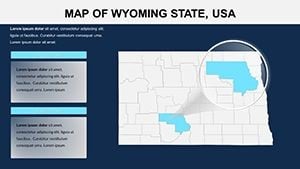
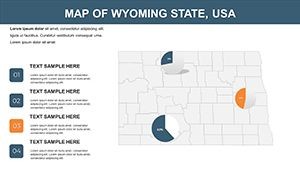
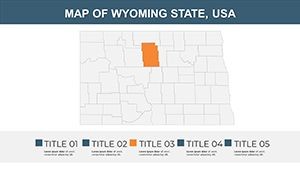
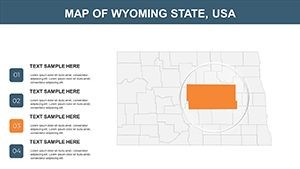
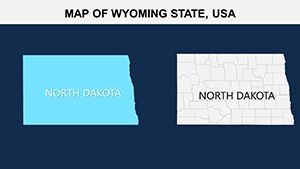
Delve deeper into what this template offers. The 28 slides are structured for versatility: Slides 1-5 provide broad overviews, including Wyoming's position in the Rocky Mountain region with borders to Montana and Colorado clearly defined. Slides 6-12 zoom into national parks, with editable layers for features like geysers in Yellowstone or hot springs in Thermopolis - perfect for tourism pitches aligned with National Park Service standards.
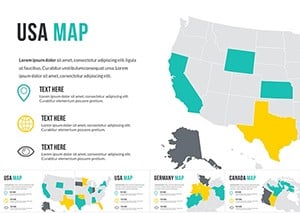
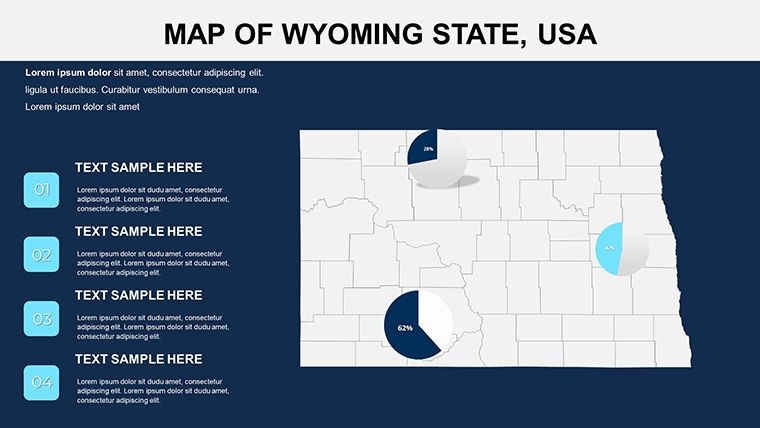
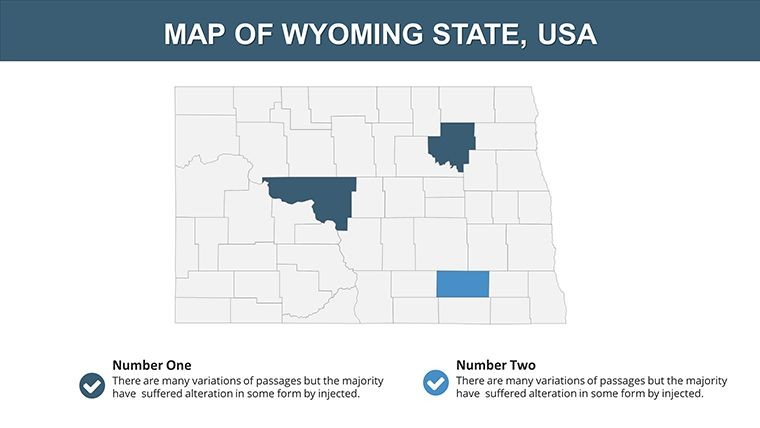
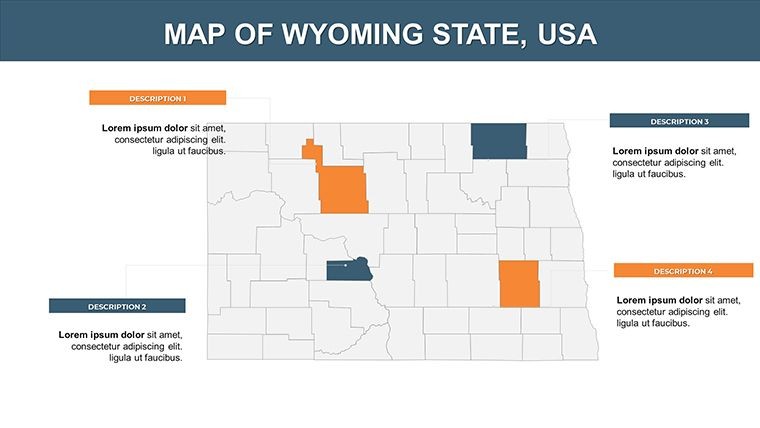
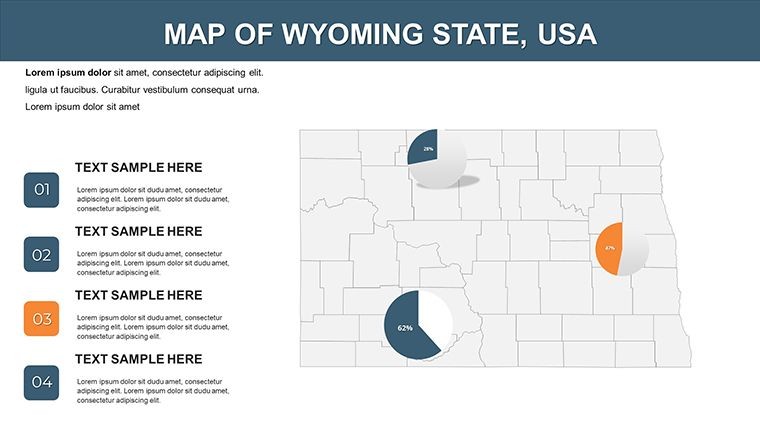
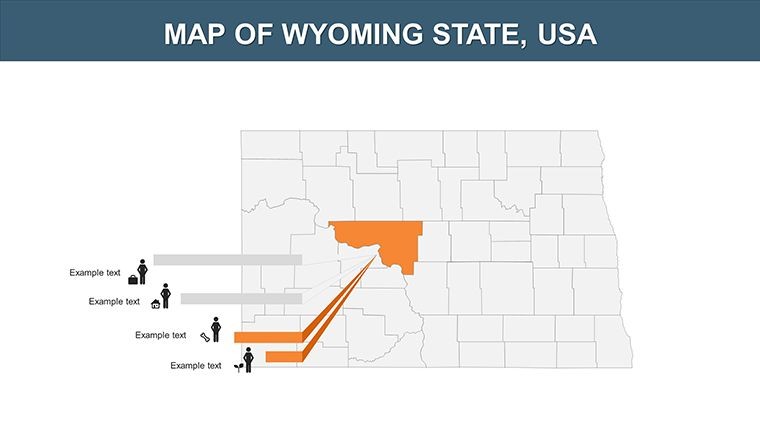
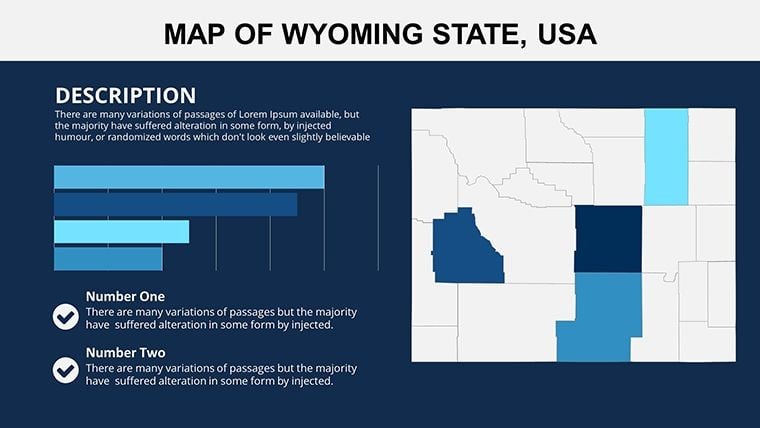
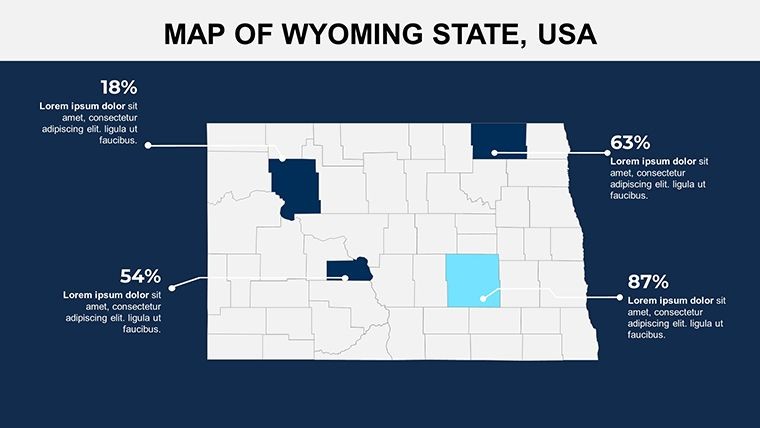
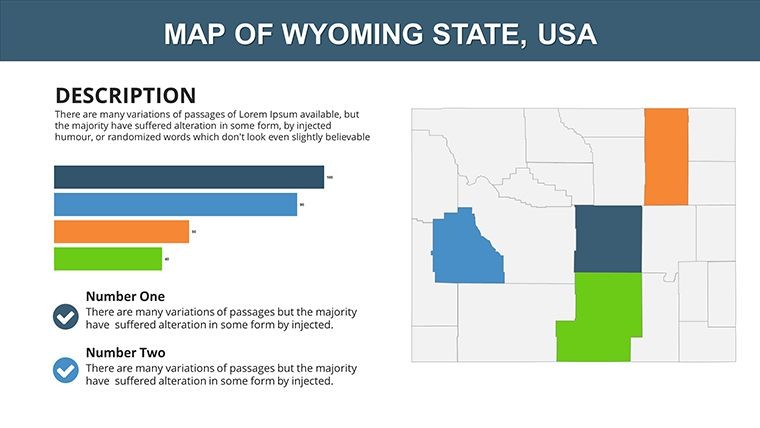
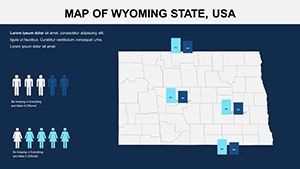
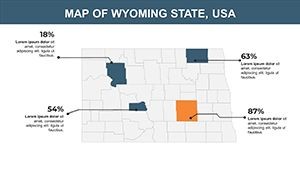
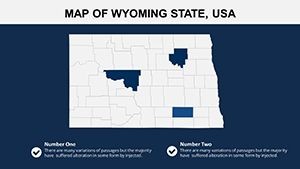
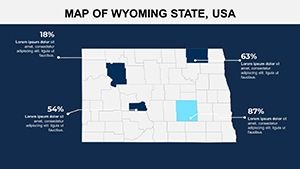
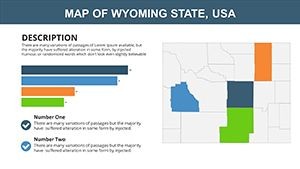
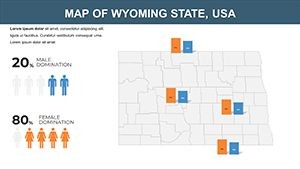
Moving on, slides 13-18 integrate data visualization tools, such as bar graphs showing coal production by county or heat maps for population distribution in sparse areas like Niobrara. These elements are drag-and-drop editable, compatible with imports from tools like ArcGIS. Slides 19-23 focus on thematic maps, covering agriculture (ranching in the Big Horn Basin) and recreation (ski resorts in Jackson Hole). The concluding slides, 24-28, feature advanced animations, like tracing the Continental Divide or simulating river flows in the Green River - essential for hydrological studies.
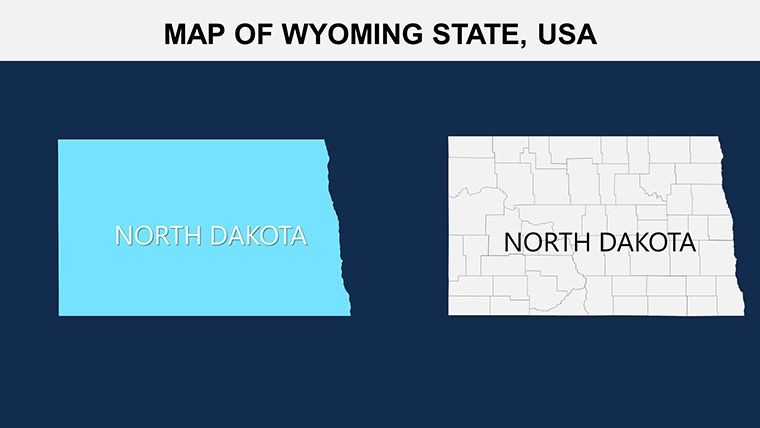
- Seamless Customization: Modify every element, from fill patterns to text overlays, in minutes.
- Retina-Ready Resolution: Crisp details that hold up under scrutiny on any device.
- Themed Icons Included: Wyoming-specific symbols like bison and cowboys for authentic touches.
- Built-in Transitions: Smooth reveals that build narrative tension effectively.
Transformative Benefits in Action
The real magic lies in the outcomes. Consider a case from the Wyoming Business Council: Using similar mapped visuals, a startup secured funding by clearly depicting wind farm potentials, boosting investor confidence. For educators, aligning with NGSS (Next Generation Science Standards), these maps facilitate lessons on plate tectonics via Yellowstone's caldera diagrams, enhancing student retention as evidenced by studies from the Geological Society of America.
Beyond that, the template's LSI-friendly elements - like "Wyoming topographic maps" or "Rocky Mountain geography" - aid in collaborative environments. It's optimized for hybrid setups, ensuring maps render perfectly in shared Keynote sessions.
Diverse Applications Across Wyoming's Expansive Terrain
This template shines in varied scenarios. Energy firms can map fracking sites in the Jonah Field, incorporating safety zones per OSHA guidelines. Wildlife conservationists, inspired by groups like the Greater Yellowstone Coalition, might use it to track wolf populations with editable migration paths.
For academia, visualize Native American reservations like the Wind River, adding cultural annotations for anthropology classes. Economic developers could highlight tech hubs in Laramie, using pie charts for industry breakdowns. Even event planners for Cheyenne Frontier Days can overlay venue maps with crowd logistics.
- Choose your starting slide and load relevant data sets.
- Tweak color schemes to evoke Wyoming's natural palette - earth tones for prairies, blues for rivers.
- Incorporate labels for landmarks like Devils Tower.
- Apply animations to simulate seasonal changes or historical events.
- Present with confidence, knowing your visuals are top-tier.
Versus standard Keynote options, this template provides pre-verified accuracy, avoiding common pitfalls like distorted projections.
Pro Insights for Elevated Presentations
To maximize, blend maps with narratives - e.g., transition from overview to close-ups like a virtual tour. Source data from reliable entities like the Wyoming State Geological Survey for credibility. Ensure accessibility with high-contrast colors, per ADA recommendations, and test animations for smooth playback.
A handy tip: Use overlay slides for comparative analyses, like before-and-after climate impacts on glaciers, drawing from IPCC reports. This method has aided presentations at conferences like the Western Governors' Association meetings.
What Makes Our Template the Top Choice?
Unlike one-size-fits-all tools, ours captures Wyoming's unique scale - from vast open spaces to intricate geological features. Backed by feedback from pros who've presented at TEDx events in Jackson, it delivers value that generic alternatives can't match.
Eager to map out success? Grab this template and chart your course today.
Frequently Asked Questions
How customizable are the regional boundaries?
Completely customizable - you can resize, recolor, or even merge regions as needed in Keynote.
Does it support data import from external sources?
Yes, easily import CSV or Excel data for charts and infographics.
Is this suitable for non-profit use?
Yes, licensed for educational and non-profit applications without restrictions.
What resolution do the maps offer?
Full HD and Retina-ready for professional-quality outputs.
Can I add my own icons or elements?
Absolutely, Keynote's tools allow seamless integration of custom assets.
Are updates available for the template?
Yes, free updates for boundary changes or new features.