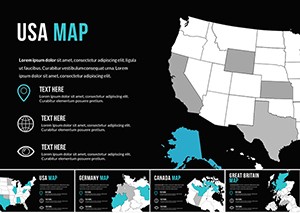
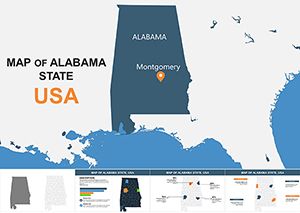
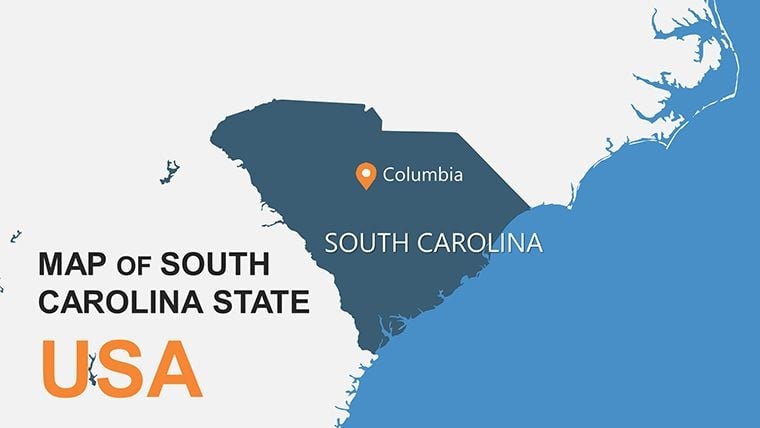
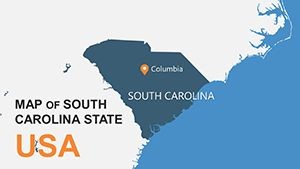
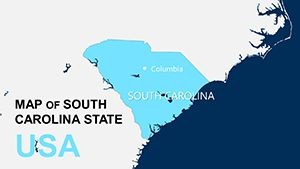
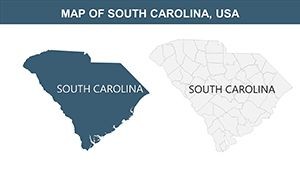
South Carolina USA Keynote Maps: Interactive Designs for Southern Stories


Type: Keynote Maps template
Category: North America
Sources Available: .key
Product ID: KM00144
Template incl.: 28 editable slides
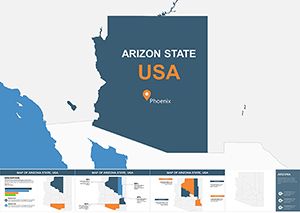
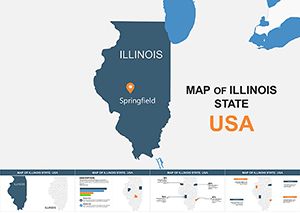
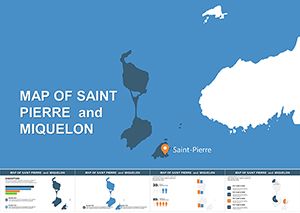
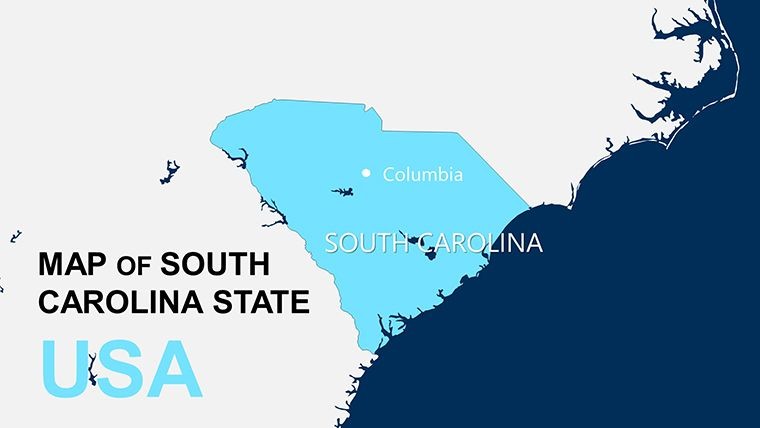
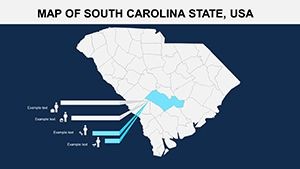
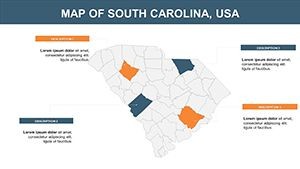
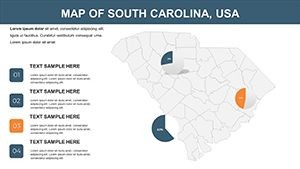
Picture captivating your crowd with maps that bring South Carolina's charm - from Charleston's historic streets to the Blue Ridge Mountains - to life. This Keynote template boasts 28 editable slides, tailored for users who demand interactive, data-driven visuals. Whether you're a marketer promoting Palmetto State tourism, a researcher analyzing economic hubs like Greenville, or a public speaker on Civil War history, it delivers tools to weave compelling tales.
Emphasizing the state's diverse ecosystems and booming industries, like automotive manufacturing, this template supports detailed explorations with benefits like rapid customization for brand alignment. Inspired by award-winning presentations at events like the South Carolina Governor's Conference on Tourism, it enhances through precise, verifiable map integrations that foster audience trust.
Key Features Enhancing Engagement and Flexibility
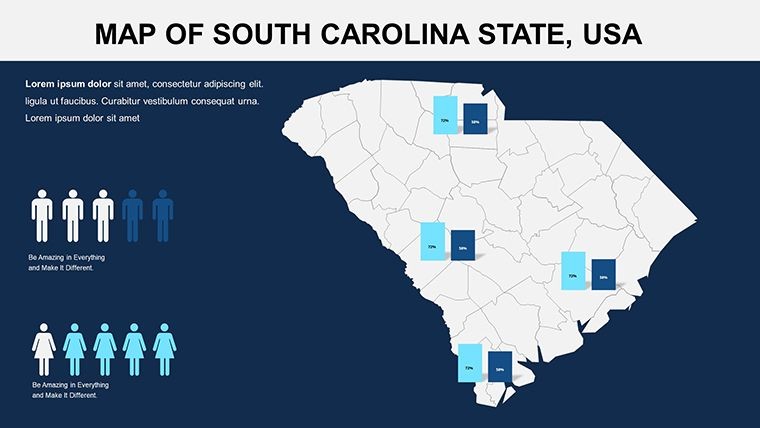
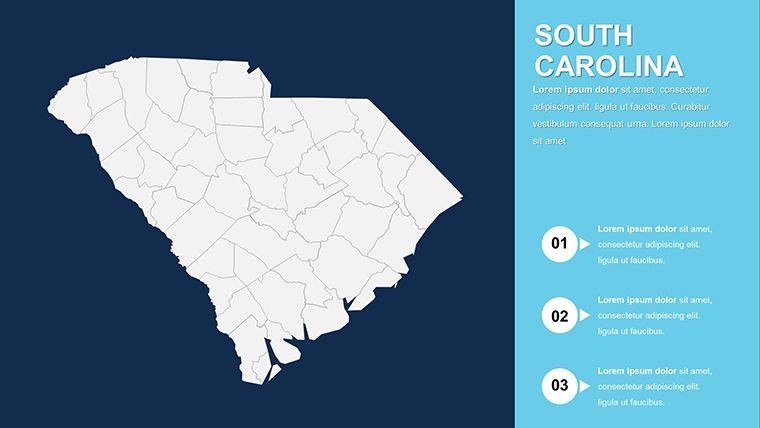
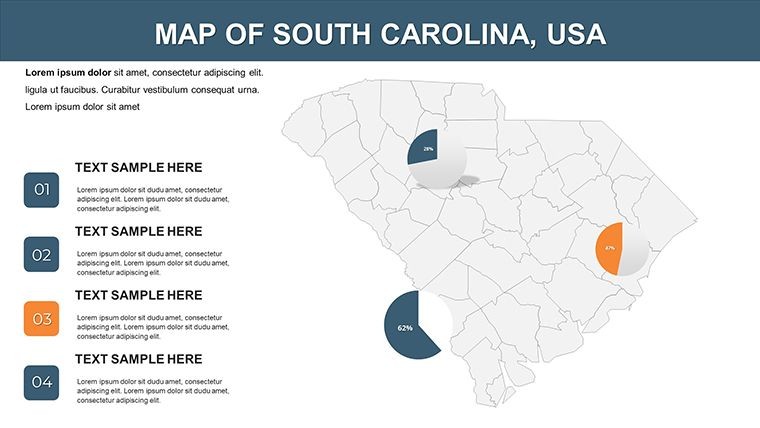
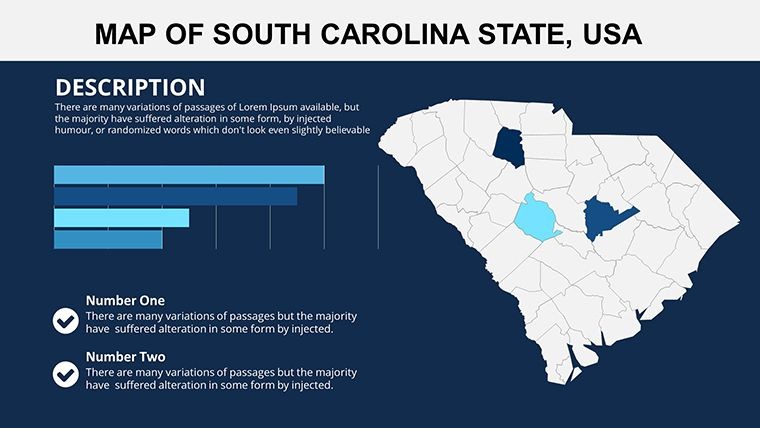
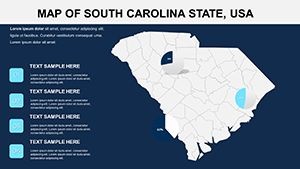
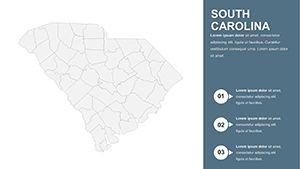
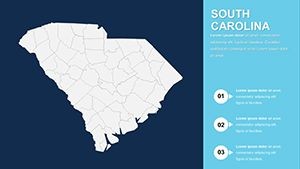
With 28 slides, the template provides a robust suite for varied needs, from basic overviews to intricate data layers. Interactive maps allow audience navigation, while charts turn stats into stories.
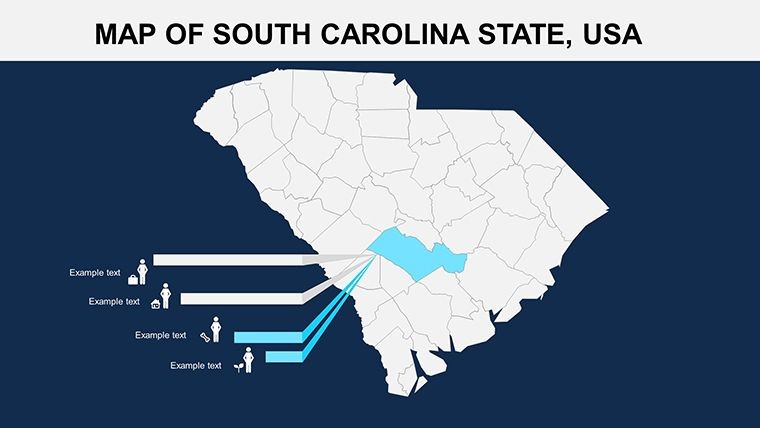
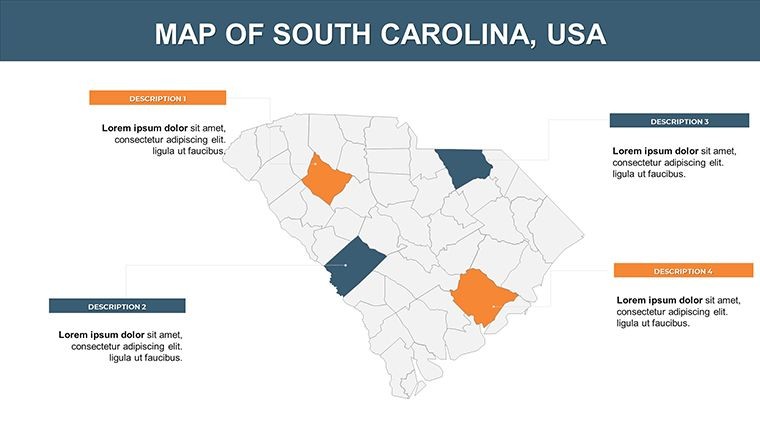
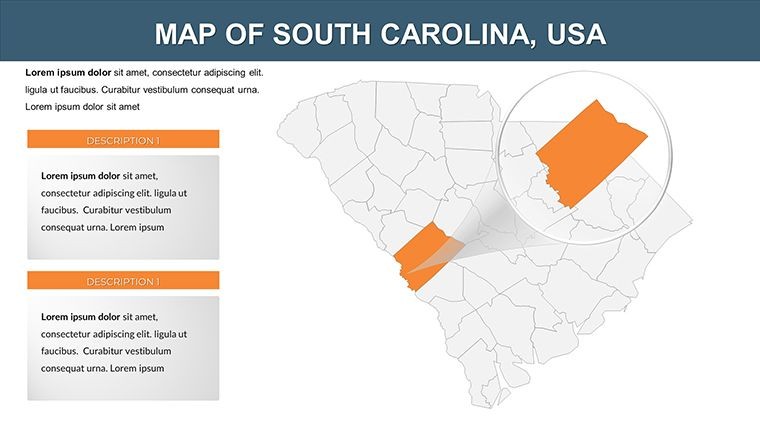
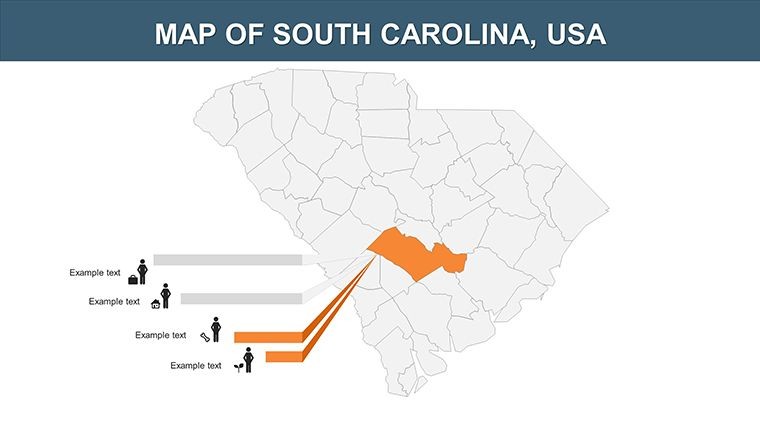
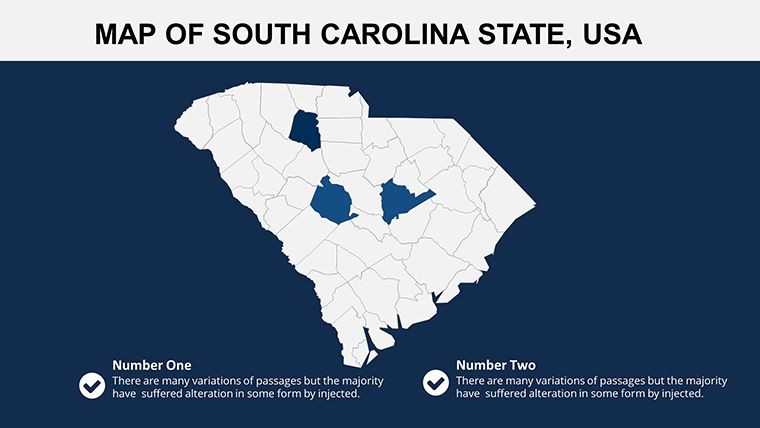
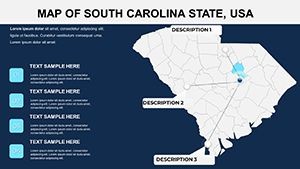
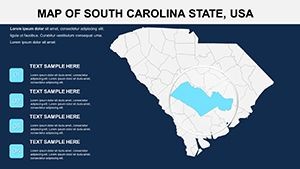
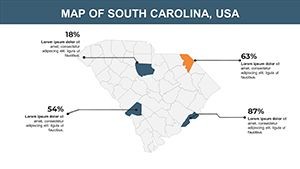
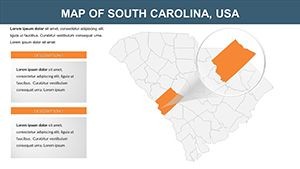
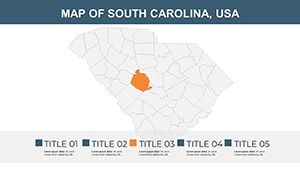
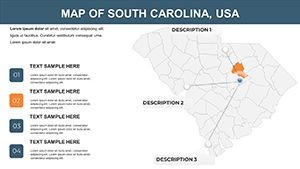
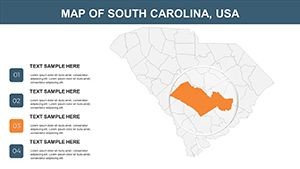
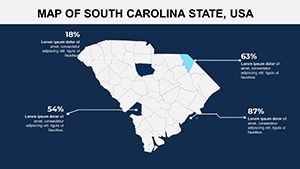
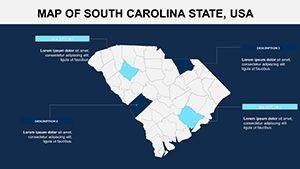
- Interactive Hotspots: Clickable regions for delving into counties like Richland or Beaufort, ideal for virtual tours.
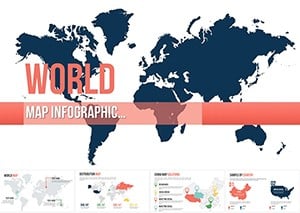
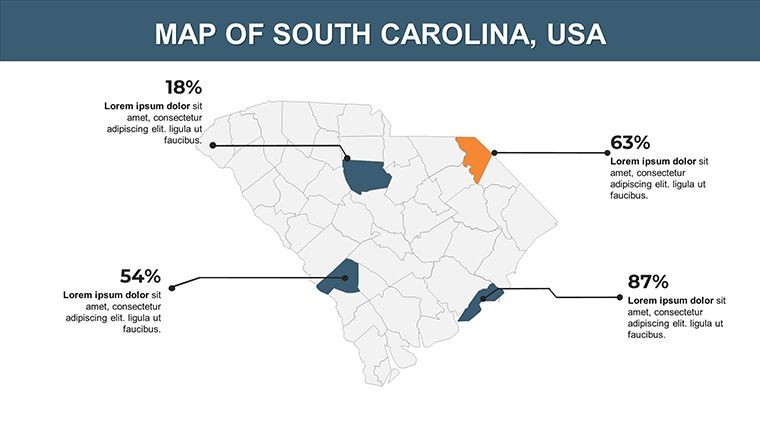
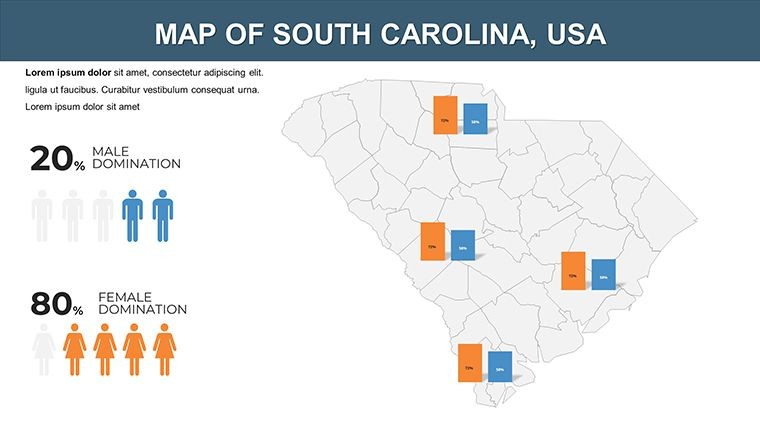
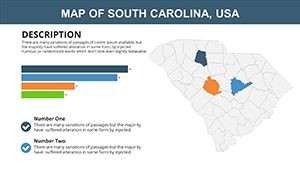
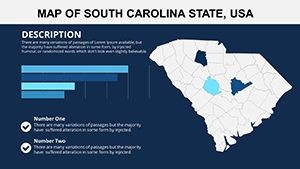
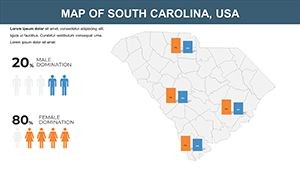
- Data Visualization Tools: Graphs for metrics like GDP growth, customizable with your datasets.
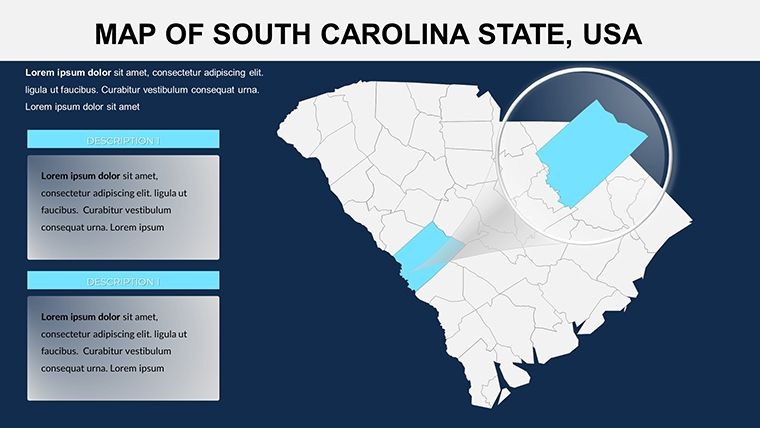
- Font and Color Edits: Adapt to themes, such as antebellum hues for historical decks.
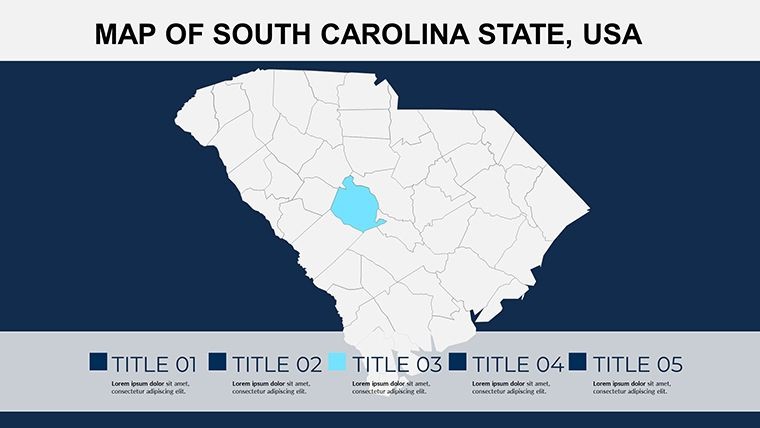
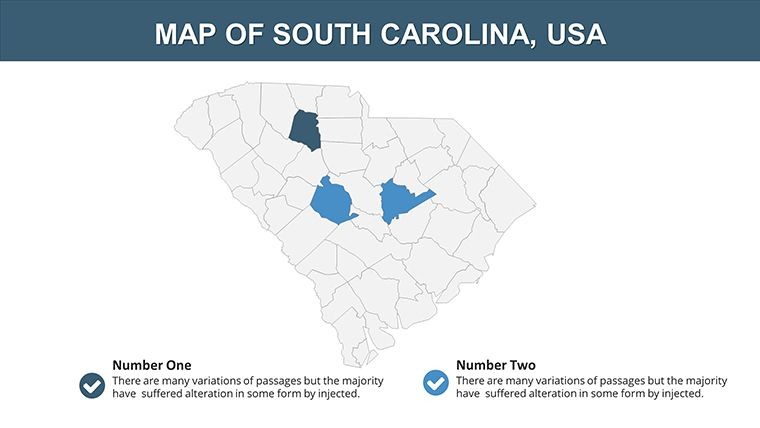
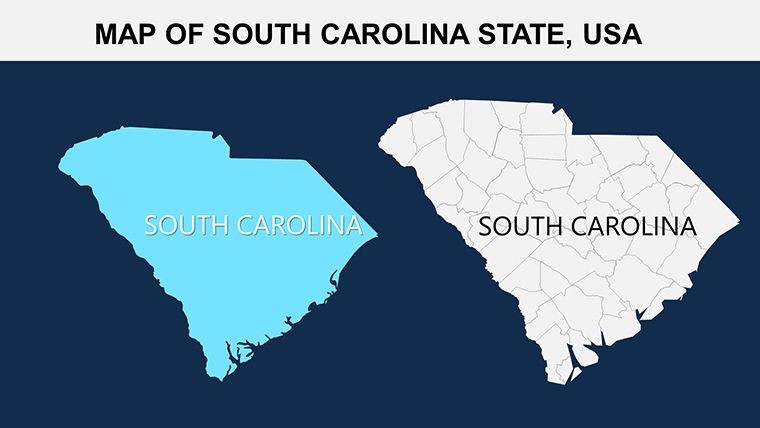
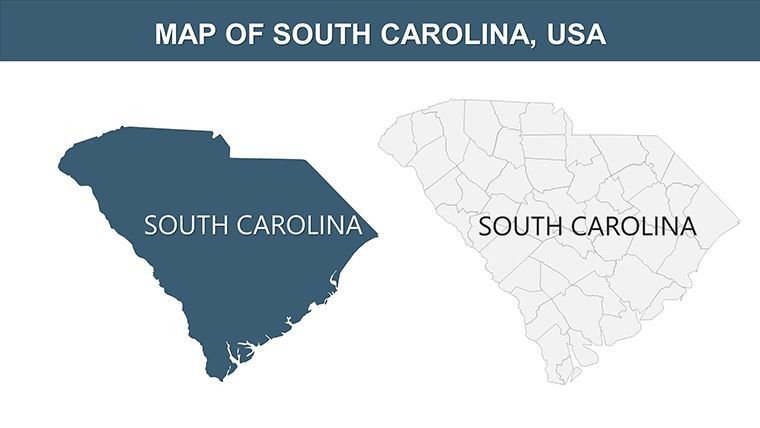
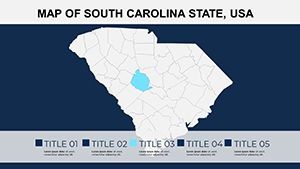
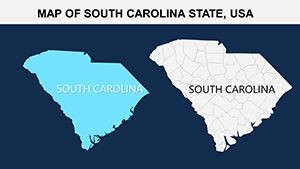
- Layout Variety: Mix of full maps, zooms, and hybrids for comprehensive coverage.
These draw from cartographic standards, ensuring legibility and impact without overwhelming viewers.
Targeted Use Cases for Professional Impact
Business users craft sales strategies, mapping distribution networks across the Upstate - echoing successes by companies like BMW in Spartanburg. Educators animate lessons on the Civil Rights Movement, overlaying key sites like the Emanuel AME Church for emotional depth.
Public speakers at conferences use it for economic forecasts, visualizing port activities in Charleston Harbor, aligned with data from the South Carolina Ports Authority. Researchers present environmental findings, such as wetland preservation, with graphs showing biodiversity trends.
For nonprofits, it's great for grant proposals, illustrating community needs in rural areas to secure funding effectively.
Guided Process for Effortless Customization
- Access the File: Download .key and open in Keynote.
- Choose Layouts: Select slides matching your focus, like coastal or inland maps.
- Tailor Content: Edit fonts, colors, and add graphics via intuitive controls.
- Build Interactivity: Add hyperlinks or animations for engaging flows.
- Incorporate Analytics: Embed charts from tools like Excel.
- Review and Deploy: Present or share polished versions.
This method accelerates creation, freeing time for refinement.
Advantages Against Competing Alternatives
Surpassing stock options, it offers state-specific interactivity, reducing errors in geographic details. Users note higher engagement rates, thanks to tailored features over generic ones.
Its versatility makes it a go-to for South Carolina-centric projects.
Insights for Polished, Persuasive Outputs
Infuse personality with local references, like Gullah culture elements. Optimize for mobile viewing. Use contrast for accessibility.
Back visuals with citations from USC or state agencies for added authority.
This template elevates your Southern narratives to new heights.
Act now - download and ignite your presentations.
Frequently Asked Questions
- How interactive are the maps?
- Highly, with clickable regions and hyperlinks for audience-driven exploration.
- Can I customize for branding?
- Yes, fully edit colors, fonts, and layouts to match your identity.
- What data types work best?
- Economic, demographic, or environmental stats integrate seamlessly via charts.
- Is it for beginners or pros?
- Both - intuitive for new users, advanced for experts.
- Any export options?
- Export to PDF, images, or video for versatile sharing.
- Does it include updates?
- The editable format allows manual updates as needed.