Saint Pierre Miquelon Keynote Map - Instant Download | ImagineLayout


Type: Keynote Maps template
Category: North America
Sources Available: .key
Product ID: KM00142
Template incl.: 12 editable slides
What is a Keynote map template? A Keynote map template is a pre-built .key file containing editable geographic slides - in this case, island territory outlines, zone boundaries, and annotation layers - that open directly in Apple Keynote for use in policy, education, or international business presentations.
Package Contents
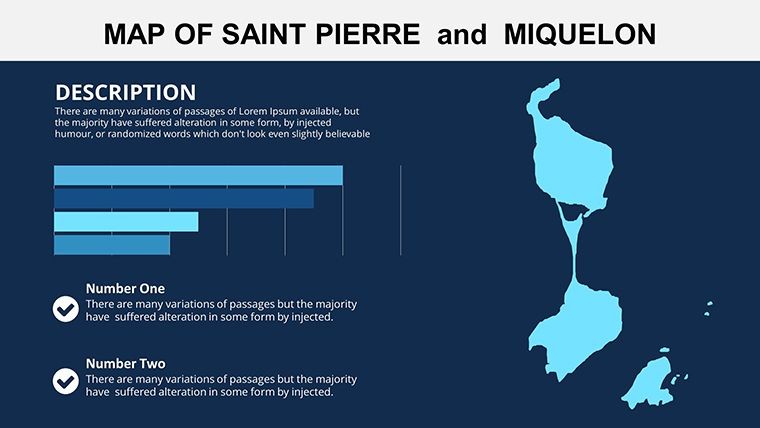
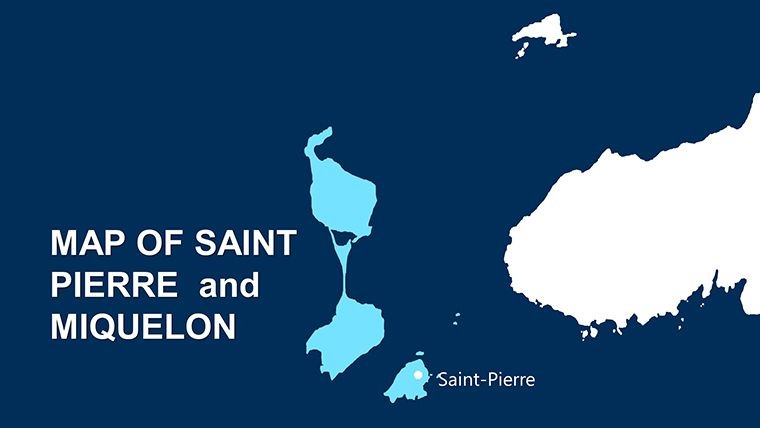
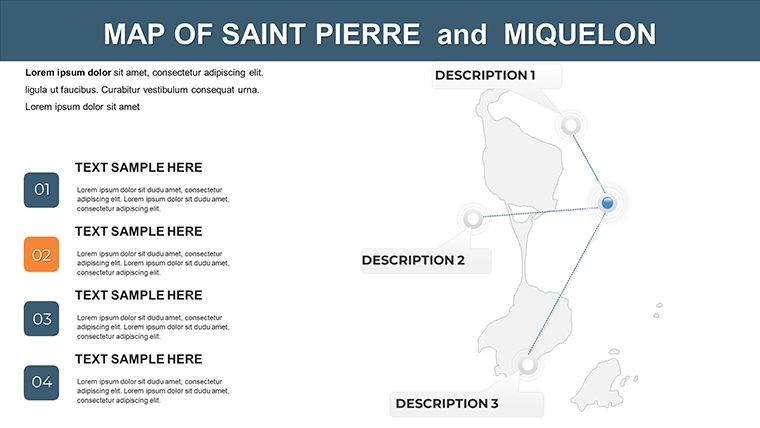
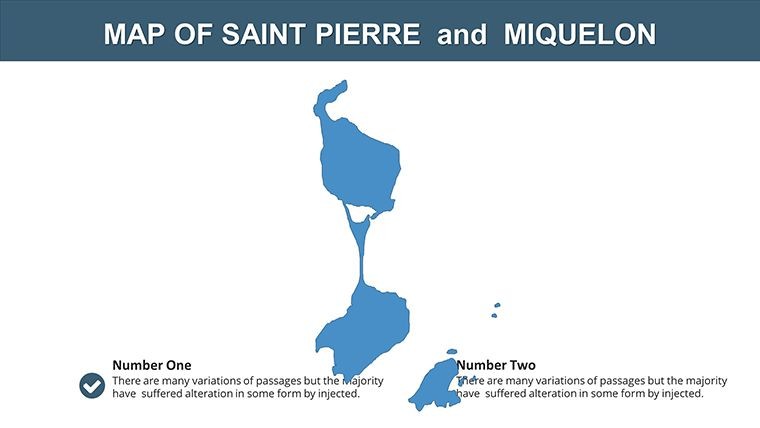
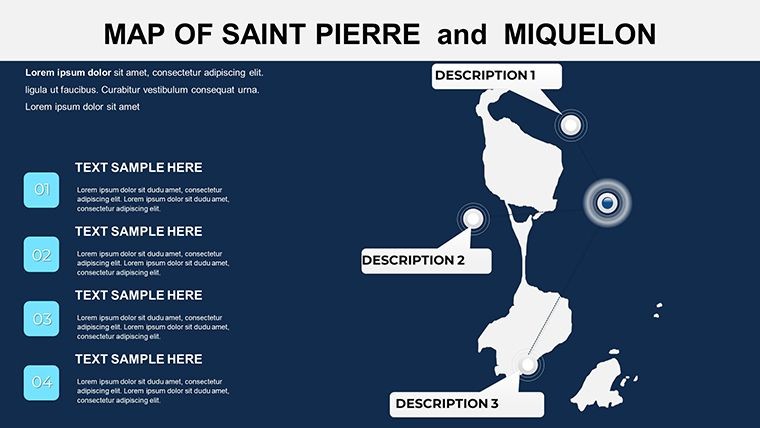
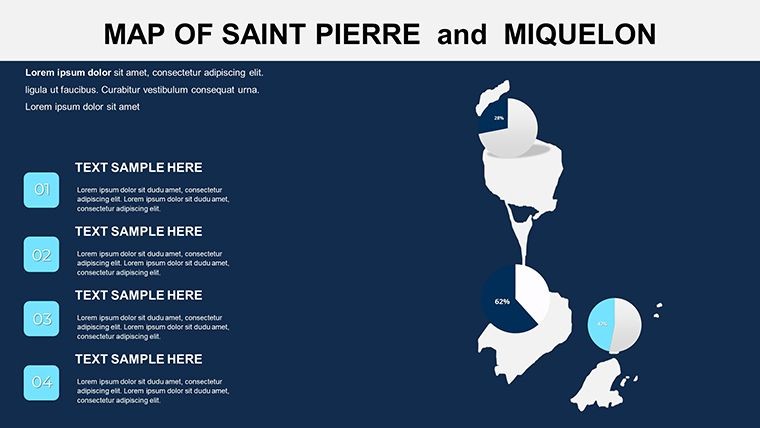
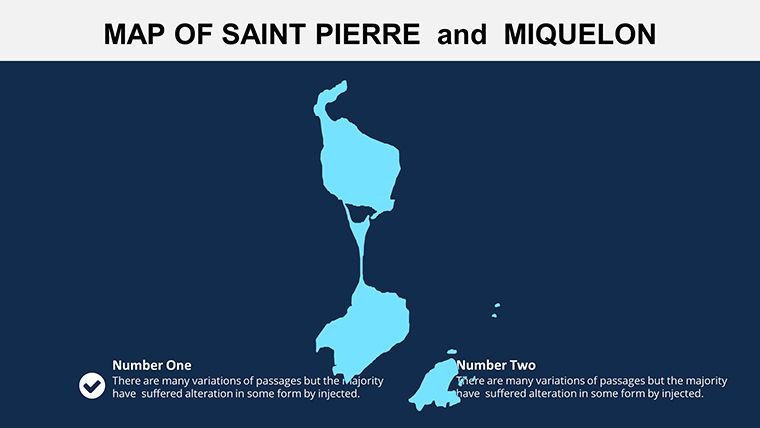
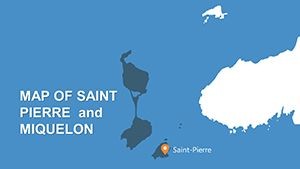
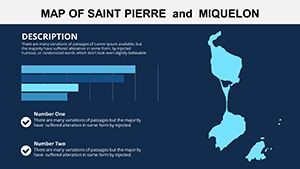
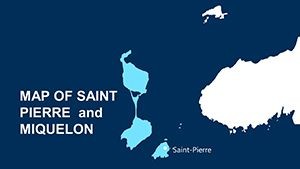
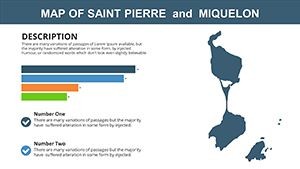
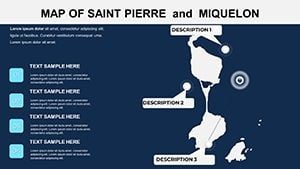
12 slides in a single .key file cover the complete geographic scope of Saint Pierre and Miquelon - France's territorial collectivity off the southwestern coast of Newfoundland. The coverage moves from a full archipelago overview showing both Saint Pierre island and Miquelon-Langlade in geographic relation to the Canadian mainland, through individual island outlines, to region-level zone maps with annotation placeholders for statistical overlays. Each island shape is a standalone vector object, scalable and recolorable without affecting the surrounding ocean or label layers.
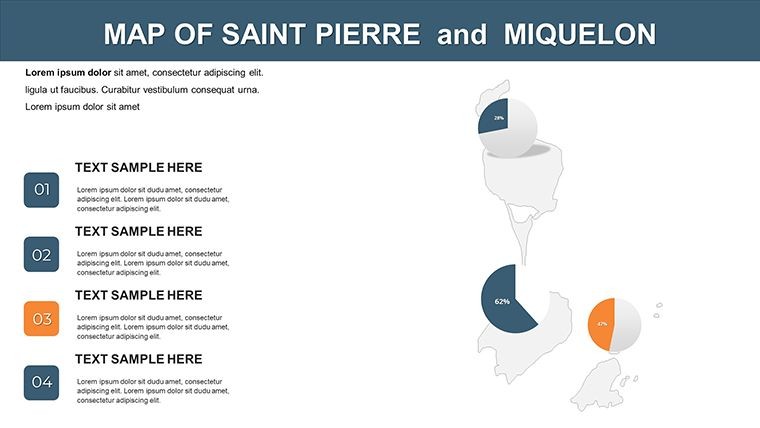
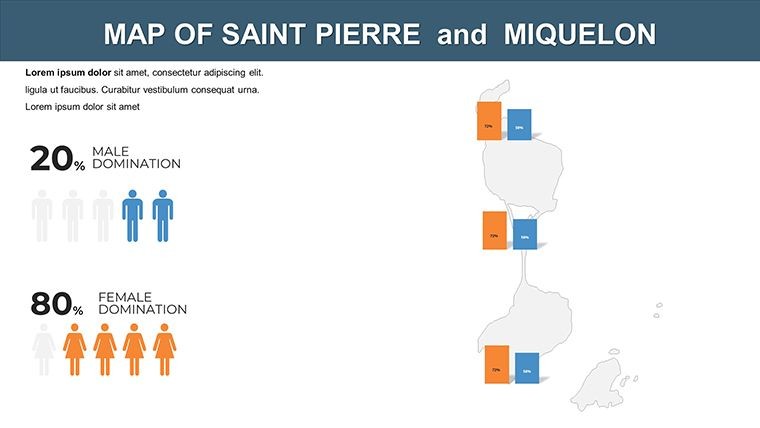
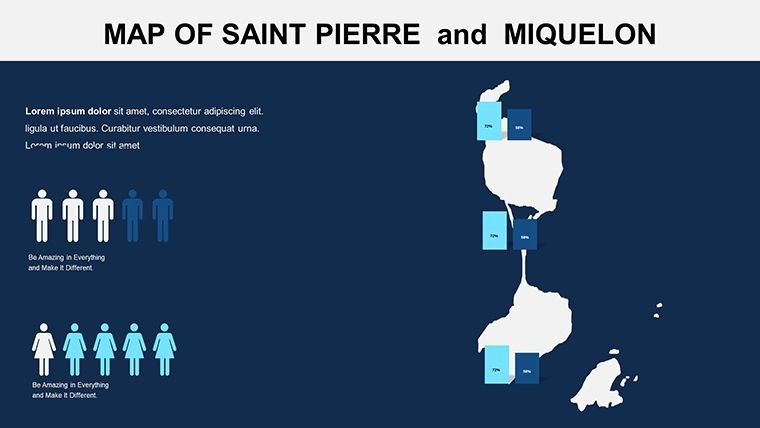
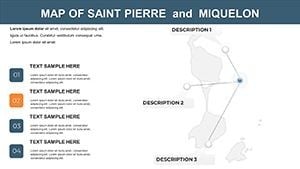
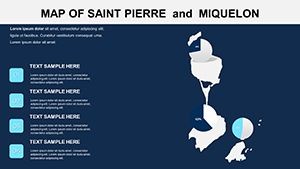
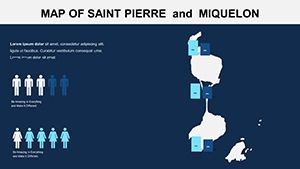
The slides address the dual-language reality of this territory. Label text boxes throughout the set are ungrouped from their parent shapes, and the placeholder text appears in both French and English formatting guides so users working on bilingual presentations - trade briefings, EU-Canada policy discussions, academic comparative studies - can update labels in either language without rebuilding the text layout. Chart placeholder slides position data figures beside the island maps, supporting economic overlays such as fisheries output or tourism volumes.
What separates this set from broader Canada province map collections is geographic specificity. Most Canada-coverage map files treat Saint Pierre and Miquelon as a marginal annotation on a national overview slide - if they appear at all. All 12 slides are dedicated to the archipelago itself, giving policy researchers, international relations educators, and Franco-Canadian trade analysts the island-level detail that regional context slides cannot provide.
Technical Specs
| Feature | Details |
|---|---|
| Slides included | 12 editable territory map slides at 16:9 widescreen ratio |
| File format | .key - requires Keynote 12 or later on macOS |
| Territory coverage | Full archipelago overview, Saint Pierre island, Miquelon-Langlade island, regional zone breakdowns |
| Label language support | Bilingual French/English text box placeholders; labels ungrouped from map shapes for independent editing |
| Color adjustments | Island and zone fills recolor via Format > Fill; master slide palette applies global theme colors |
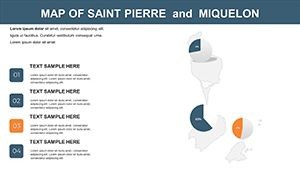
| Data overlay slides | Chart placeholders pre-positioned beside island map shapes for economic or demographic statistics |
| Export options | .key for editing, PDF for distribution, per-slide image export |
| Animation support | No preset animations; all shapes accept Keynote's native build-in/build-out effects |
From Strategy Decks to Boardroom Pitches
An international trade consultant preparing a market entry analysis for a European seafood company needed to illustrate Saint Pierre and Miquelon's unique position - French territorial jurisdiction on the North American continental shelf, operating under EU trade frameworks while sharing the Grand Banks fishery with Canadian provinces. A general Canada map could not show the island boundaries, the exclusive economic zone lines, or the fishing zone demarcations central to the brief. The 12 dedicated island slides gave her the geographic foundation to annotate each zone, overlay catch quota figures, and present a clear territorial context to the client board in under two hours of preparation time.
A university lecturer teaching Franco-Canadian relations used the archipelago overview and the regional zone slides to build a semester lecture on the colonial legacy of French North America. The bilingual label placeholders let students see the French administrative terminology alongside English geographic names - a visual reinforcement of the territory's dual-language governance that a standard English-only map slide cannot convey. Lecture preparation dropped from a full afternoon of custom map building to roughly 40 minutes of data entry.
Download the .key file and start editing immediately.
Adapting the Template to Your Brand
Editing difficulty: Beginner. Keynote 12 or later on macOS is the only software required.
- Step 1 - Open the .key file in Keynote (1 minute). All 12 slides load with island shapes and label boxes in separate, independently editable layers.
- Step 2 - Set your base color via the slide master (2 minutes). Go to View > Edit Master Slides, update the background and primary fill colors to match your organization's palette.
- Step 3 - Recolor island and zone shapes as needed (3 minutes). Click any island polygon or zone boundary, open Format > Fill, and apply a solid or gradient color. Shapes do not need ungrouping.
- Step 4 - Update bilingual labels (3 minutes). Double-click any label text box to replace the placeholder text. French and English formatting is pre-set; typing in either language preserves the font and size relationship.
- Step 5 - Populate the data overlay slides (5 minutes). Double-click any chart object to open Keynote's data editor and replace sample figures with your actual statistics.
- Step 6 - Export (1 minute). Use File > Export To > PDF for handout distribution or retain the .key file for collaborative editing via iCloud.
The Cost of Not Using a Template
Drawing Saint Pierre and Miquelon's island outlines from scratch in Keynote is not a quick approximation task. The archipelago's coastline - particularly Miquelon-Langlade's narrow isthmus connecting its two lobes - requires either tracing from a georeferenced image or manually placing curved bezier paths that match the actual coastal shape. That process runs 2-3 hours for a designer with vector drawing experience. The result is rarely accurate enough to place territorial zone lines over the island shape without visual discrepancy between the coast outline and the zone boundary.
A structural observation about the label placement in this set: island names and zone designations sit outside the island shape fills, not embedded within them. Saint Pierre's landmass is narrow enough that inside-shape labels compress to a point size that becomes unreadable at standard slide projection distances. External labels connected by thin leader lines remain readable at any projection scale without requiring font adjustments between the desktop editing view and the live presentation environment.
The chart placeholder positioning - figures on the right half of the slide, island map on the left - follows the reading-direction convention that Western audiences apply instinctively: geography first, then data. Reversing that layout forces the eye to locate the geographic reference after the figure, which slows comprehension. Keeping the conventional reading order embedded in the slide structure means presenters do not have to think about layout while editing content.
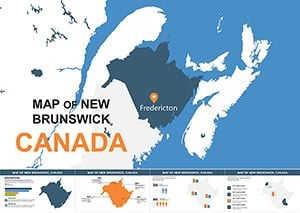
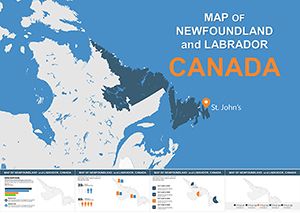
Browse the full North America Keynote map template collection for adjacent Canadian territory coverage. For presentations that extend the narrative to mainland Canadian provinces, the New Brunswick Keynote map covers the nearest Atlantic province with a comparable island-and-coast geographic structure. The Newfoundland and Labrador Keynote map provides the provincial context immediately adjacent to Saint Pierre and Miquelon for cross-boundary policy and environmental presentations.
Download the Saint Pierre and Miquelon Keynote map and begin customizing today.
Which Keynote version do I need to open this file?
Keynote 12 or later is required for full shape and layer editing. Keynote 12 ships with macOS Monterey and is available as a free download from the Mac App Store for any Mac running macOS 11.5 or higher. Earlier Keynote versions may open the .key file but risk rendering problems with grouped shape layers or master slide color settings. Updating Keynote through the App Store before downloading is the safest approach if you are on an older macOS release.
Does this template support bilingual French and English labels?
Yes - label text boxes throughout the set include both French and English placeholder formatting. Each label is a standalone text box ungrouped from its parent map shape, so editing the French name does not affect the island polygon or the adjacent English annotation. The font choice and size relationship between the two language levels is pre-set; replacing placeholder text with your actual French or English terminology preserves the visual hierarchy without manual reformatting. This makes the template particularly suited for EU-Canada policy briefings, academic lectures on Franco-Canadian history, and trade presentations aimed at bilingual audiences.
Can I use this template for commercial client work?
The standard single-purchase license at $6 covers use in presentations prepared for clients, including trade analysis decks, policy briefings, educational course materials, and internal corporate reports. The license prohibits resale of the .key file itself, redistribution to third parties, and sublicensing. One purchase covers one end-user. Teams where multiple members need independent editing access to the source file require individual purchases per user. ImagineLayout's contact page handles inquiries about volume licensing for larger organizations.
How does the refund policy work for digital downloads?
Refunds are available when the downloaded file is corrupted, fails to open in Keynote 12, or does not match the product description on this page. Because digital files are delivered immediately on purchase, ImagineLayout does not process refunds for change-of-mind purchases or accidental wrong-product orders. If a technical issue occurs - the download fails, shapes are missing, or the file format does not match the listing - contact support with your order number and a description of the specific problem. Support reviews each case and responds to confirmed technical failures. Complete policy terms are on the Refund Policy page in the site footer.
Are animations included in the download?
No preset animations are included. All 12 slides are static by default, which ensures clean PDF exports and broad Keynote version compatibility. Every island shape, label text box, and chart object in the file is compatible with Keynote's native Animate panel - select any element, open Animate, and choose a build-in or build-out style and trigger. Keeping the file animation-free by default also prevents unintended motion effects when the file is exported to PDF or shared as static images for print handouts.
What aspect ratio do the slides use?
All 12 slides are set to 16:9 widescreen ratio, the standard for modern projectors, external monitors, and video conference screen sharing. If your venue requires 4:3 - older projectors, certain classroom setups - you can change the slide size in Keynote via Document > Slide Size > Custom Slide Size and enter 1024 x 768 pixels. Keynote will prompt you to scale or crop existing content; choosing scale keeps all map shapes visible but may add horizontal letterboxing. The vector format of all shapes means they resize cleanly to either ratio without edge degradation.